. 2015 Sep;72(9):477-90.
doi: 10.1002/cm.21252. Epub 2015 Sep 16.

Dynein-deficient flagella respond to increased viscosity with contrasting changes in power and recovery strokes

Affiliations

Dynein-deficient flagella respond to increased viscosity with contrasting changes in power and recovery strokes

Kate S Wilson et al. Cytoskeleton (Hoboken). 2015 Sep.

Abstract

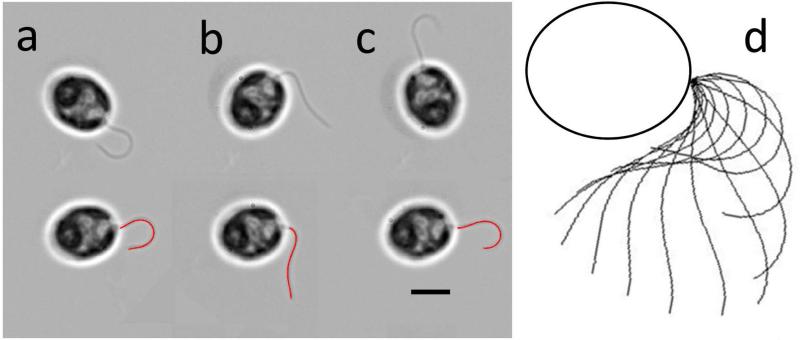
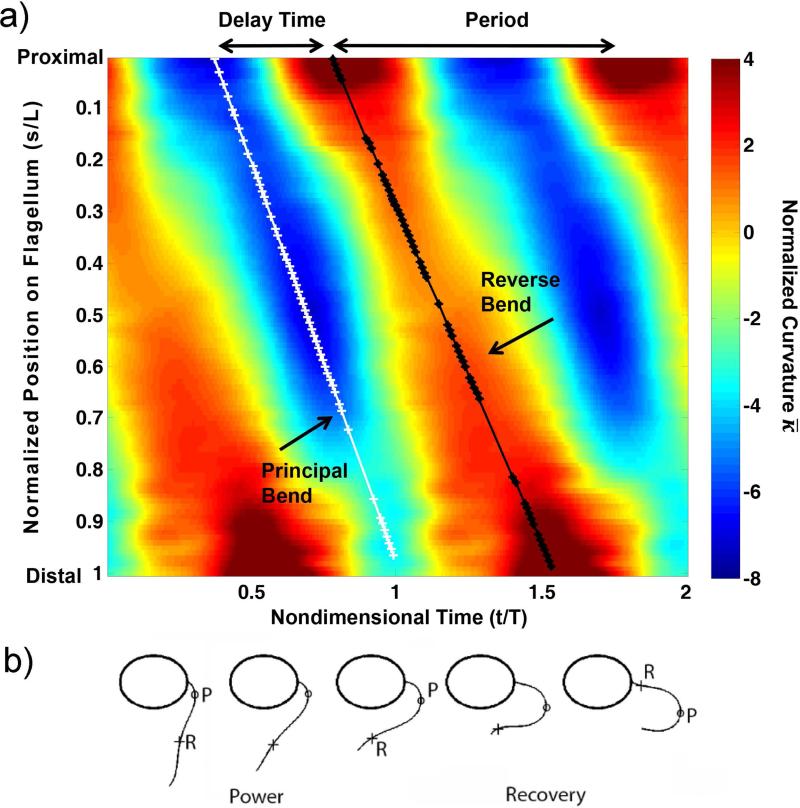
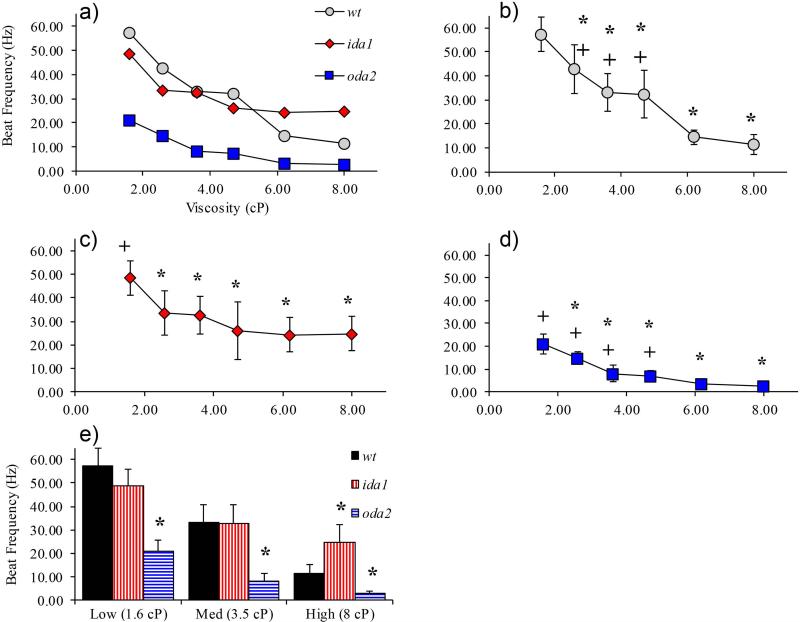
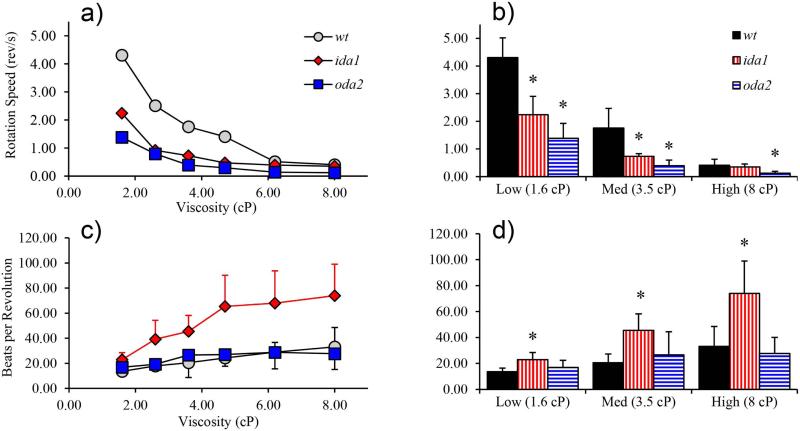
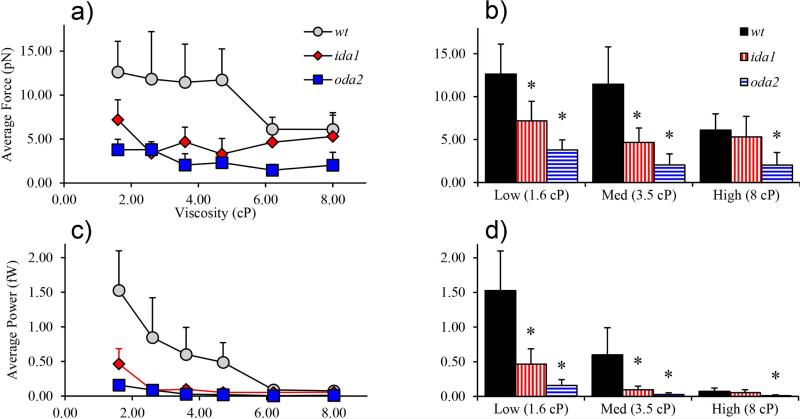
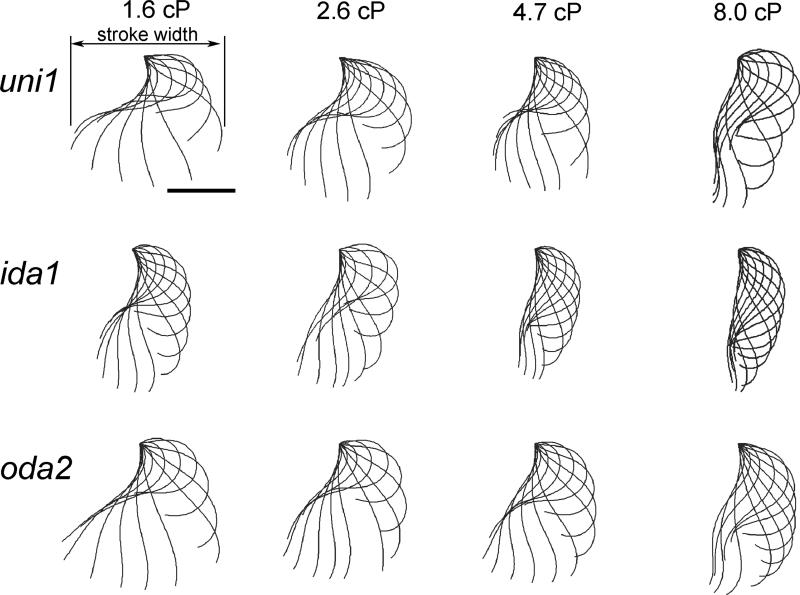
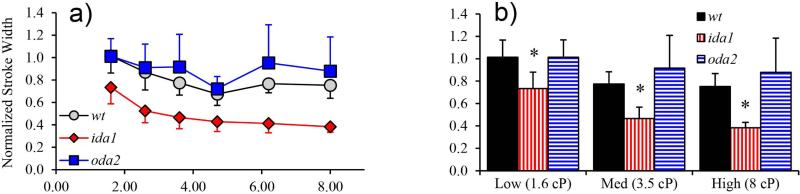
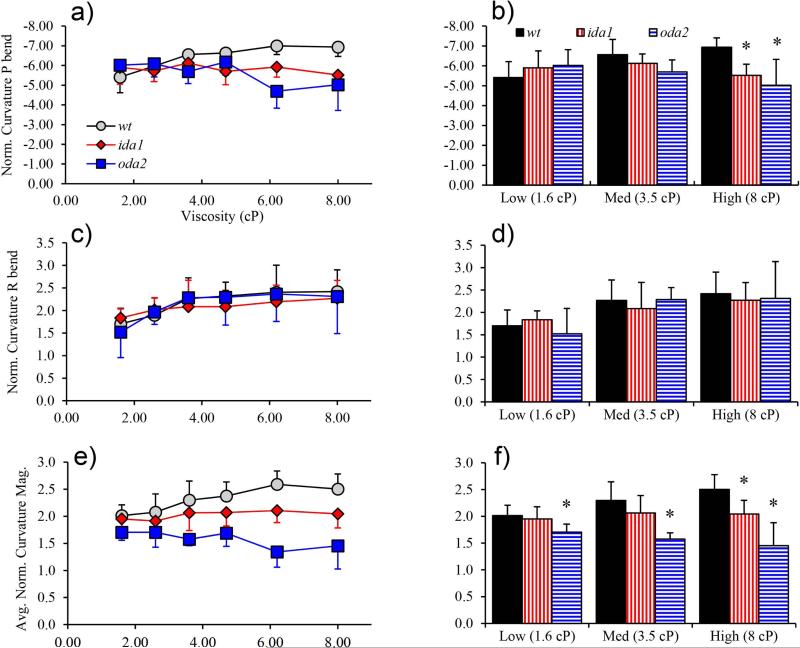
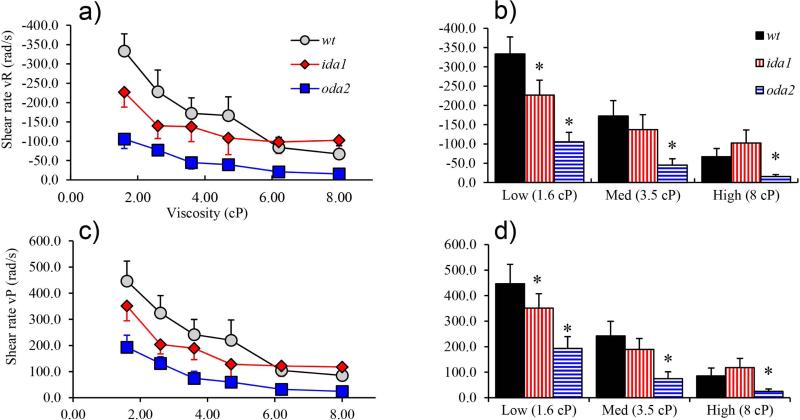
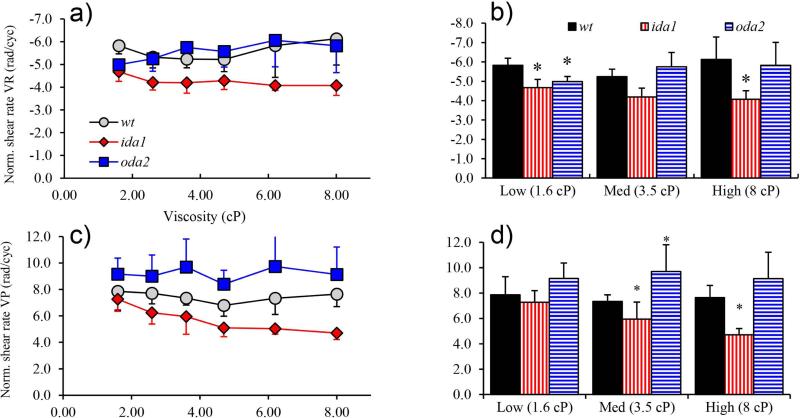
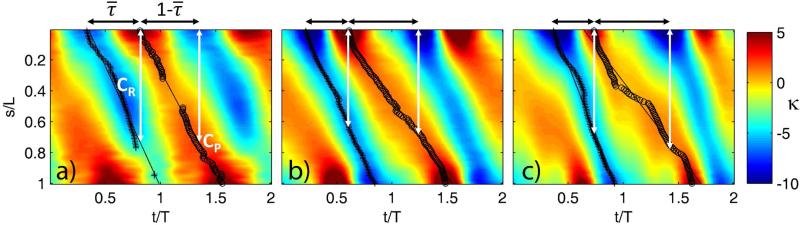
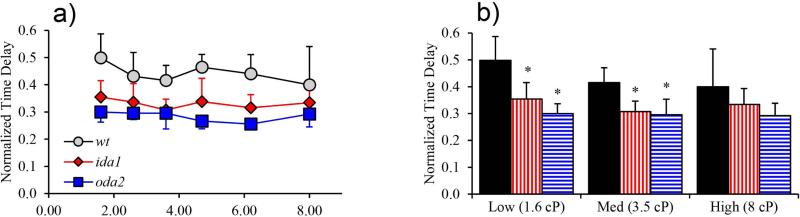
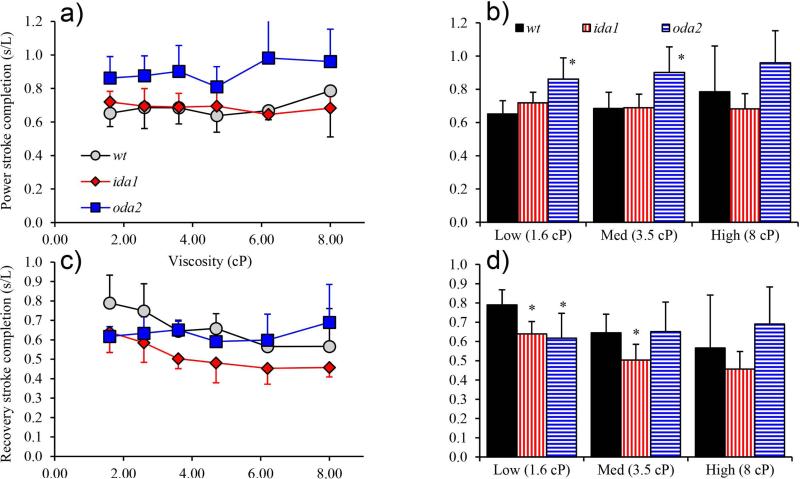
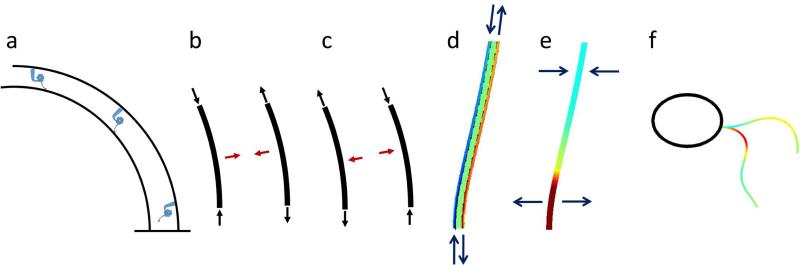
Changes in the flagellar waveform in response to increased viscosity were investigated in uniflagellate mutants of Chlamydomonas reinhardtii. We hypothesized that the waveforms of mutants lacking different dynein arms would change in different ways as viscosity was increased, and that these variations would illuminate the feedback pathways from force to dynein activity. Previous studies have investigated the effects of viscosity on cell body motion, propulsive force, and power in different mutants, but the effect on waveform has not yet been fully characterized. Beat frequency decreases with viscosity in wild-type uniflagellate (uni1) cells, and outer dynein arm deficient (oda2) mutants. In contrast, the inner dynein arm mutant ida1 (lacking I1/f) maintains beat frequency at high viscosity but alters its flagellar waveform more than either wild-type or oda2. The ida1 waveform is narrower than wild-type, primarily due to an abbreviated recovery stroke; this difference is amplified at high viscosity. The oda2 mutant in contrast, maintains a consistent waveform at high and low viscosity with a slightly longer power stroke than wild-type. Analysis of the delays and shear displacements between bends suggest that direct force feedback in the outer dynein arm system may initiate switching of dynein activity. In contrast, I1/f dynein appears to delay switching, most markedly at the initiation of the power stroke, possibly by controlling inter-doublet separation.

Keywords: Chlamydomonas; dynein; flagella; viscosity; waveform.


Figures

Figure 1
Figure 1
Waveform analysis (Bayly et al., 2010). (a-c) Video frames of uniflagellate Chlamydomonas cells (top); rotated into consistent position with polynomial curves fitted to flagellum (bottom). (d) Waveform from polynomial fits displayed every 1/12th period. Scale bar: 5 μm.
Figure 2
Figure 2
(a) Map of normalized curvature, κ (rad/flagellar length) vs. time (horizontal axis; normalized by beat period) and distance (vertical axis; normalized by flagellar length). The map is oriented so that flagellum base is at the top left of figure. Two beat periods are shown. Delay time, τ, is defined as the fraction of the beat cycle between the occurrence of minimum negative curvature at the base of the flagellum (principal, or P-bend initiation) and the occurrence of maximum positive curvature at the base (reverse, or R-bend initiation). (b) A typical waveform at selected times in the beat, showing P-bend (minimum negative curvature, marked with ‘o’) and R-bend (maximum positive curvature, marked with ‘+’).
Figure 3
Figure 3
(a) Average beat frequency vs viscosity for all cells tested (error bars omitted for clarity). Beat frequency significantly decreased with viscosity for each cell type (single factor ANOVA, p<0.01). (b-d) Beat frequency vs viscosity for individual mutants; * indicates significant difference from beat frequency at 1.6 cP (baseline), (p<0.01 by two-tailed student t-test); + indicates significant difference from beat frequency at 8 cP (p<0.01 by two-tailed student t-test). (e) Data from preceding line plots are presented in bar graphs here and in subsequent figures to highlight differences between mutants. Compared to wild-type, oda2 cells beat significantly slower than wt cells at all viscosities; ida1 cells beat faster than wt at 8cP. Here and in subsequent bar graphs * denotes significance by ANOVA followed by two-tailed student t-test p<0.01, compared to wt. In this figure and subsequent figures, solid markers or wide bars represent mean values and error bars show standard deviations.
Figure 4
Figure 4
(a) Rotation rates decreased with viscosity in all mutants. (b) Compared to wt, cell body rotation is slower in oda2 at all viscosities and in ida1 at low and medium viscosity. (c) ida1 flagella exhibit a dramatic increase in beats per revolution with viscosity. The number of beats per revolution in wt and oda2 flagella also tend to increase with viscosity but much less than in ida1 (in wt the increase is statistically significant, ANOVA, p<0.01). (d) The number of beats per revolution in ida1 was significantly higher than in wt at all viscosities.
Figure 5
Figure 5
(a-b) Average propulsive force calculated from Equations (1-2). (a) Average propulsive force varied significantly with viscosity in wt, ida1, and oda2 (ANOVA, p<0.01). (b) Compared to wt, ida1 and oda2 cells produced less force at low and medium viscosity. At high viscosity wt and ida1 generated similar average forces. (c-d) Average power vs. viscosity. (c) Decrease in power with viscosity was significant for all mutants (ANOVA, p<0.01). (d) Wild-type (wt) cells generate more power than dynein-deficient mutants. The values of propulsive force and power in this figure are close to corresponding previous estimates in biflagellate cells (Minoura and Kamiya, 1995; Yagi et al., 2005).
Figure 6
Figure 6
Representative waveforms for selected experimental conditions. Each column shows results at a specific viscosity; each row corresponds to a specific mutant. Flagellar waveforms are shown at intervals of 1/12th period; scale bar 5 μm.
Figure 7
Figure 7
Flagellar stroke width (maximum difference in x-coordinates of any points on flagellum over the beat, normalized by length, L). (a) Both wt and ida1 showed significant decreases in stroke width with viscosity (ANOVA, p<0.01) (b) Differences in stroke width between wt and ida1 were identified at all viscosities and amplified at high viscosity.
Figure 8
Figure 8
Normalized curvature values (radians/flagellum length). (a) Only wt flagella displayed a statistically significant, consistent increase in P-bend curvature with viscosity. P-bend curvature decreased in oda2 flagella at high viscosity (ANOVA, p<0.01). (b) P-bend curvature in ida1 and oda2 differ significantly from wt only at high viscosity. (c) Flagella exhibit a trend of increased R-bend curvature with viscosity, which is statistically significant in wt and oda2 (not ida1). (d) R-bend curvature was similar between mutants under almost all conditions. (e) Average curvature magnitude over the entire waveform. Flagella of wt flagella showed significant increase in average curvature magnitude with viscosity. In oda2 average curvature magnitude decreased with viscosity. (f) Average curvature magnitude in oda2 was significantly lower than in wt at all viscosities.
Figure 9
Figure 9
(a, c) Shear rates (rad/s) associated with propagation of both R-bends (vR) and P-bends (vP) decrease with increased viscosity in all mutants but level off at high viscosities in ida1. (b, d) At low viscosity shear rates are lower in dynein-deficient mutants ida1 and oda2 than in wt (p<0.01), but at high viscosity shear rates in ida1 flagella are similar to or higher than wt.
Figure 10
Figure 10
(a) Normalized shear rate VR (rad/cycle) remains roughly constant as viscosity is increased except for a slight decrease in ida1 (ANOVA p=0.01). (b) Normalized shear rate VR is significantly lower in ida1 than wt (p<0.01) at both high and low viscosity. (c) Normalized shear rate VP is consistently lowest in ida1 at each viscosity, and the decrease in with viscosity in ida1 is significant (ANOVA, p<0.01). (d) Normalized shear rate VP differs between ida1 and wt at medium and high viscosity.
Figure 11
Figure 11
Normalized curvature maps (rad/L) showing the time dela, τ, between principal and reverse bends at the base. (a) wt:τ=0.48; (b) ida1:τ=0.39; and (c) oda2:τ=0.37. Also shown are recovery completion (CR) and power stroke completion (CP) ratios which are estimated from the bend propagation speed and the corresponding time delay.
Figure 12
Figure 12
Normalized delay times between P-bend and R-bend at the base of the flagellum correspond to the fraction of the beat devoted to the recovery stroke. (a) There was no significant trend in normalized delay time with viscosity in any mutant. (b) ida1 and oda2 cells exhibited smaller normalized delay times than wt (p<0.01 at low and medium viscosity).
Figure 13
Figure 13
Stroke completion is characterized by the distance between the P-bend and R-bend at the time the opposing bend begins. This value is estimated from the product of the bend propagation speed and the time delay before the opposite bend begins (Figure 11). (a) Power stroke completion increases with viscosity in oda2. (b) oda2 cells have a generally longer power stroke than wt. The difference is statistically significant at low and medium viscosity values. (c) Recovery stroke completion in wt and ida1 cells decreases with viscosity. (d) Recovery completion is significantly lower (p<0.01) in ida1 than in wt at low and medium viscosity.
Figure 14
Figure 14
(a) In the geometric clutch model (Lindemann, 2002, 1994, e.g.) the probability of dynein (blue) attachment depends on inter-doublet spacing. (b-c) Tension and compression (black arrows) in curved doublets will lead to resultant transverse force components (red arrows) that pull the doublets together or push them apart. (d) Finite element mechanical simulations of curved beams with internal shear forces show that these forces lead to longitudinal tension (red) and compression (blue) in the doublets. (e) Tension and compression in curved doublets attached to one another produce transverse tensile (red) and compressive (blue) forces between the doublets. (f) A simulation of mathematical equations based on the geometric clutch model (Bayly and Wilson, 2014) shows that the transverse tensile force between doublets is greatest (red) near the base at the conclusion of the power stroke.

References

    1. Afzelius BA. Cilia-related diseases. J. Pathol. 2004;204:470–477. - PMC - PubMed
    1. Bayly PV, Lewis BL, Kemp PS, Pless RB, Dutcher SK. Efficient spatiotemporal analysis of the flagellar waveform of Chlamydomonas reinhardtii. Cytoskelet. 2010;67:56–69. - PMC - PubMed
    1. Bayly PV, Lewis BL, Ranz EC, Okamoto RJ, Pless RB, Dutcher SK. Propulsive forces on the flagellum during locomotion of Chlamydomonas reinhardtii. Biophys J. 2011;100:2716–2725. - PMC - PubMed
    1. Bayly PV, Wilson KS. Equations of interdoublet separation during flagella motion reveal mechanisms of wave propagation and instability. Biophys. J. 2014;107:1756–72. - PMC - PubMed
    1. Bray D. Cell movements : from molecules to motility. Garland Publishing; New York: 2001.

Publication types

LinkOut - more resources