. 2015;37(2):419-431.
doi: 10.1159/000430365. Epub 2015 Aug 28.

Concentration-Dependent Diversifcation Effects of Free Cholesterol Loading on Macrophage Viability and Polarization

Affiliations

Concentration-Dependent Diversifcation Effects of Free Cholesterol Loading on Macrophage Viability and Polarization

Xiaoyang Xu et al. Cell Physiol Biochem. 2015.

Abstract

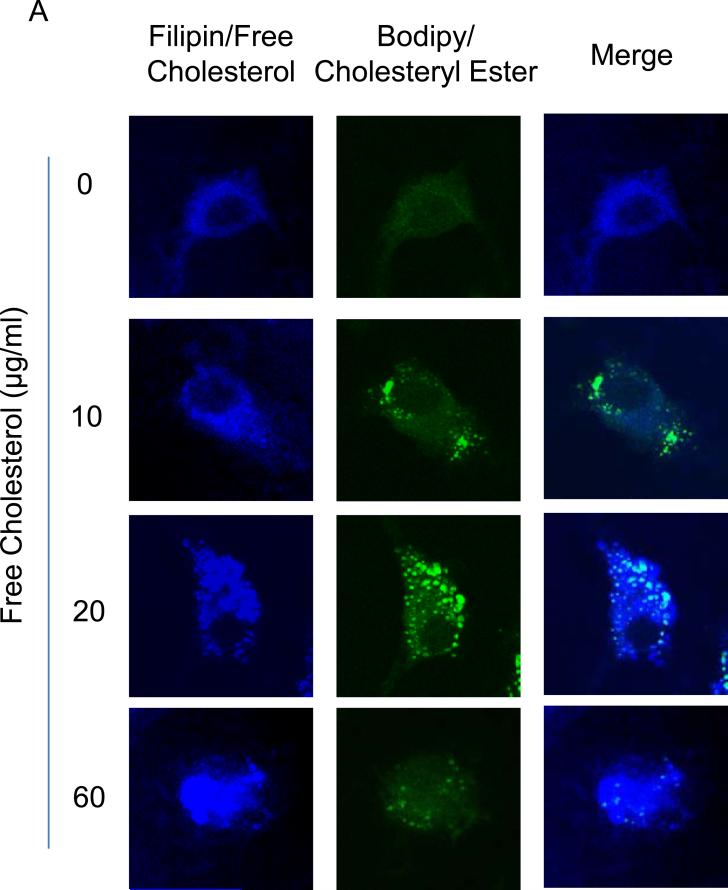
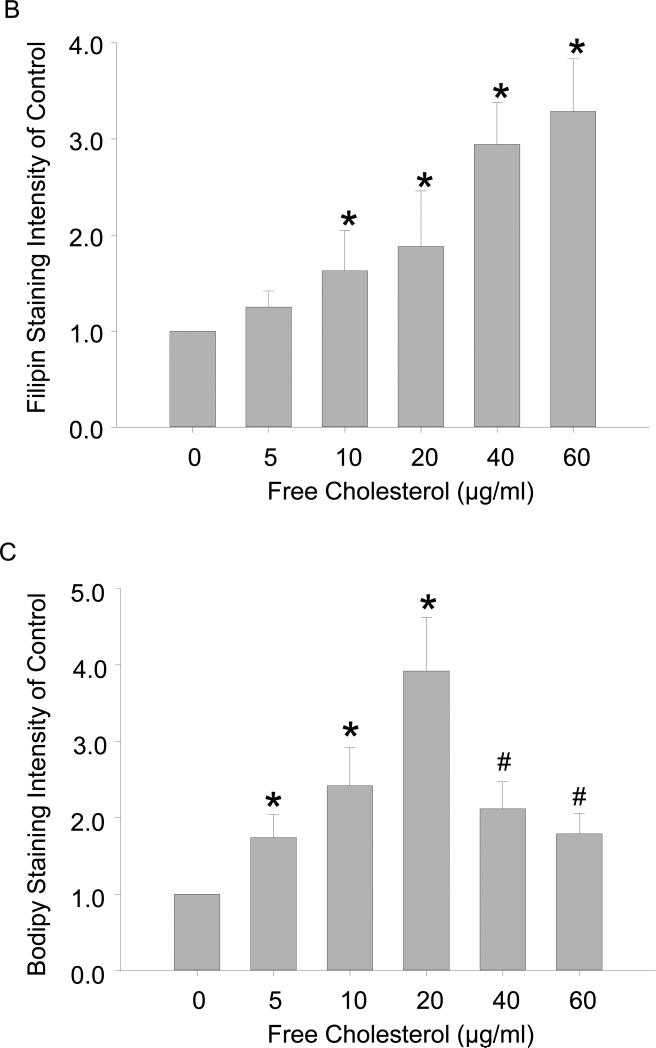
Background/aims: The accumulation of free cholesterol in atherosclerotic lesions has been well documented in both animals and humans. In studying the relevance of free cholesterol buildup in atherosclerosis, contradictory results have been generated, indicating that free cholesterol produces both pro- and anti-atherosclerosis effects in macrophages. This inconsistency might stem from the examination of only select concentrations of free cholesterol. In the present study, we sought to investigate the implication of excess free cholesterol loading in the pathophysiology of atherosclerosis across a broad concentration range from (in µg/ml) 0 to 60.

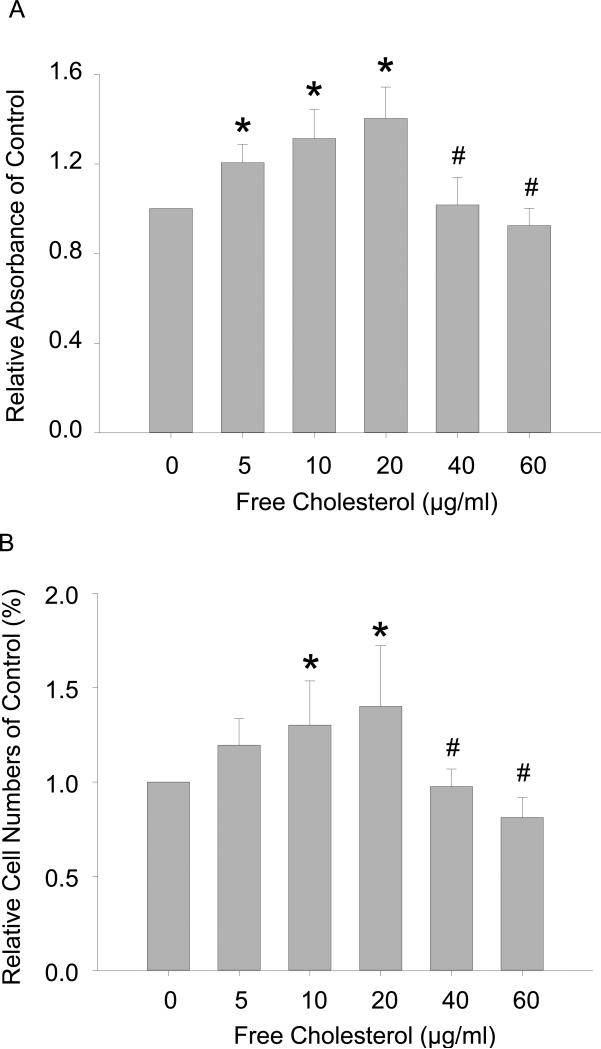
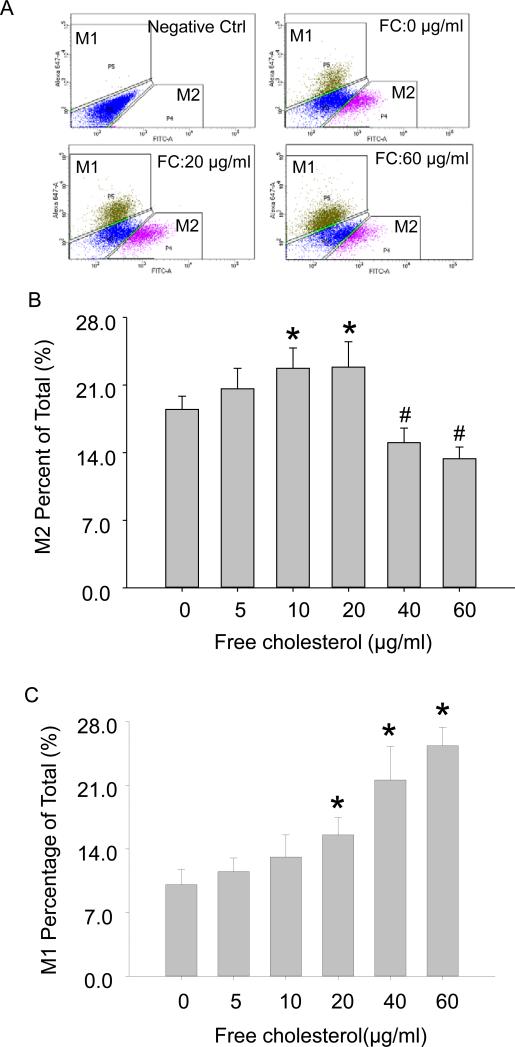
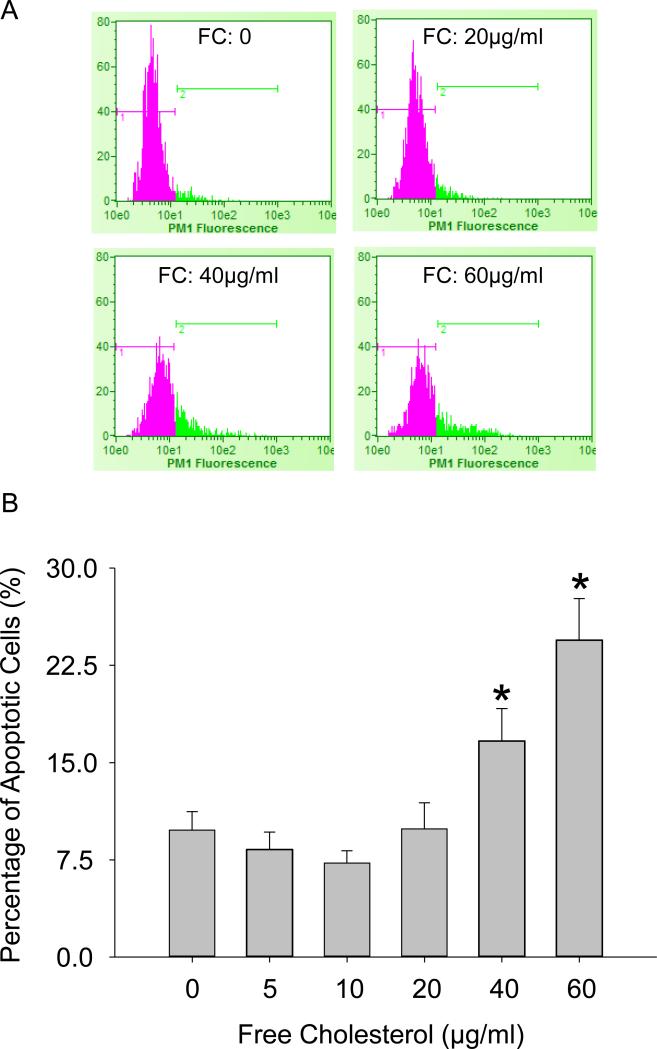
Methods: Macrophage viability was determined by measuring formazan formation and flow cytometry viable cell counting. The polarization of M1 and M2 macrophages was differentiated by FACS (Fluorescence-Activated Cell Sorting) assay. The secretion of IL-1β in macrophage culture medium was measured by ELISA kit. Macrophage apoptosis was detected by flow cytometry using a TUNEL kit.

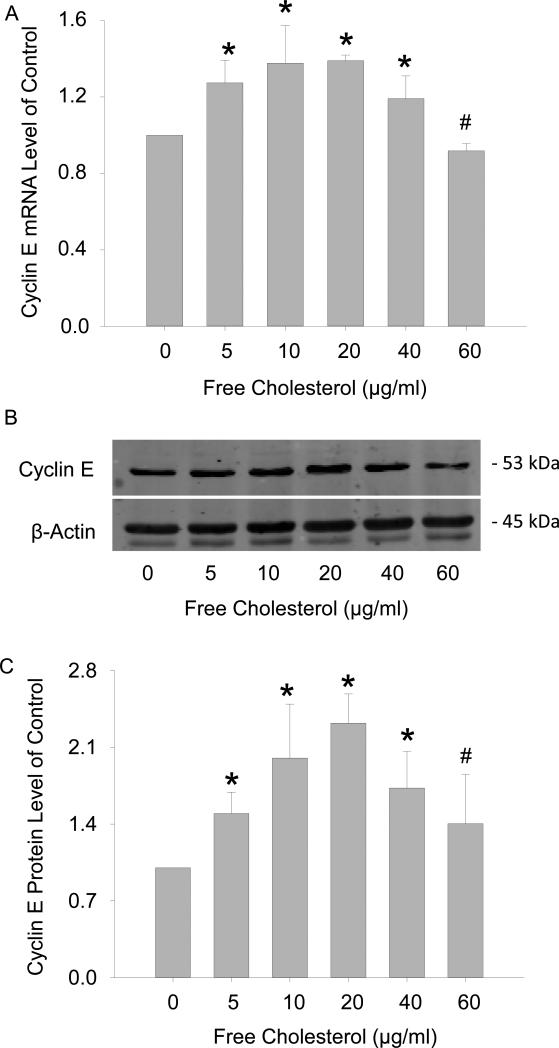
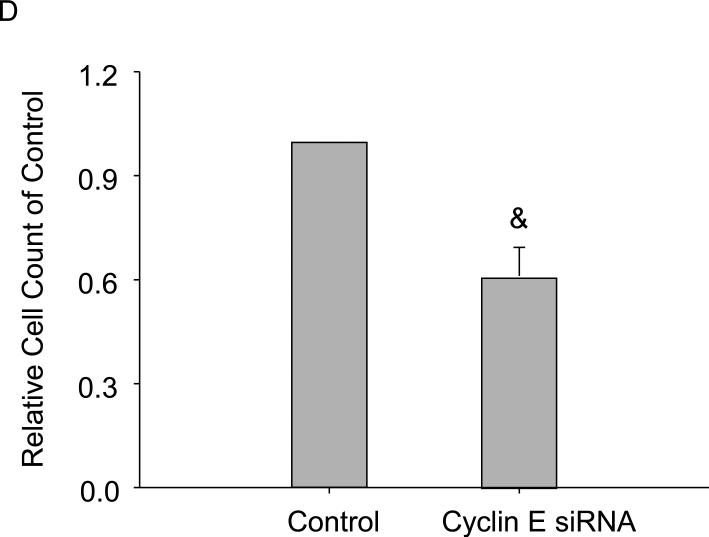
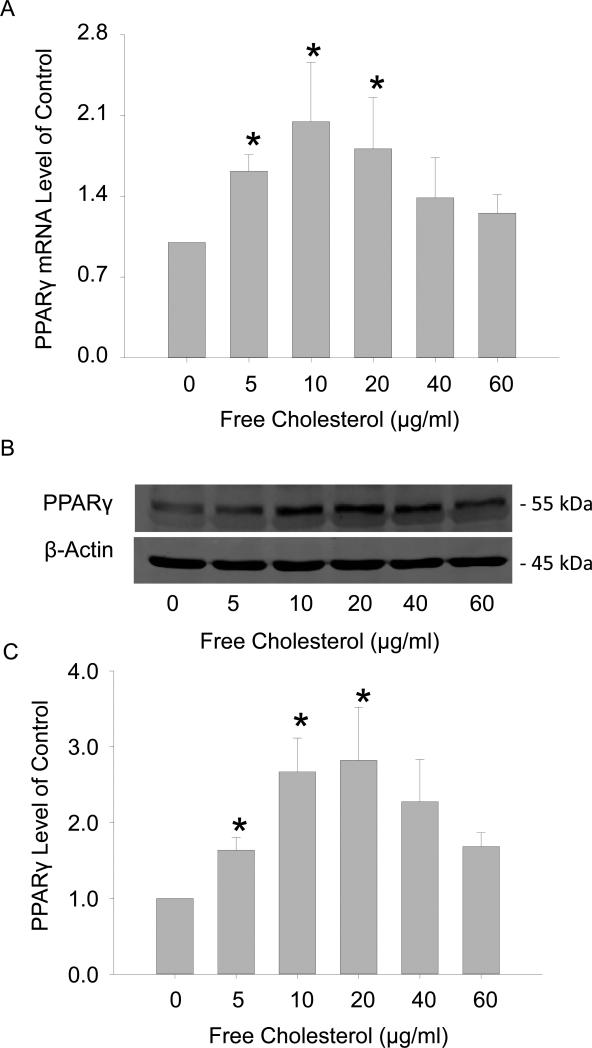
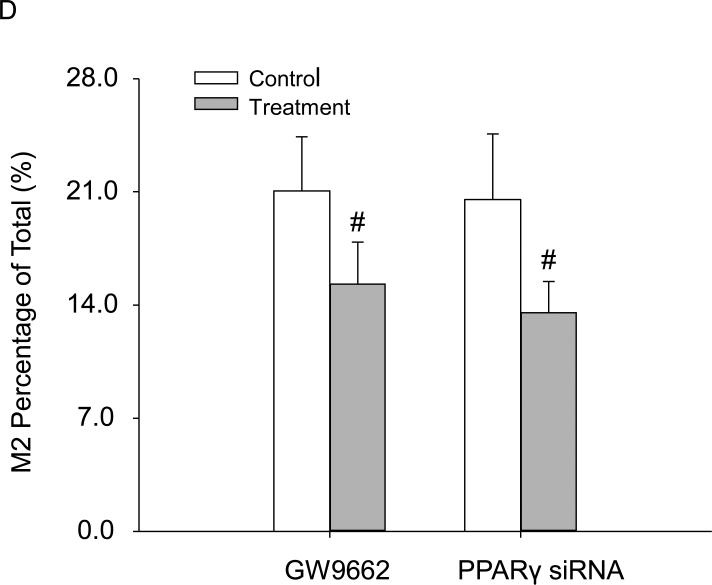
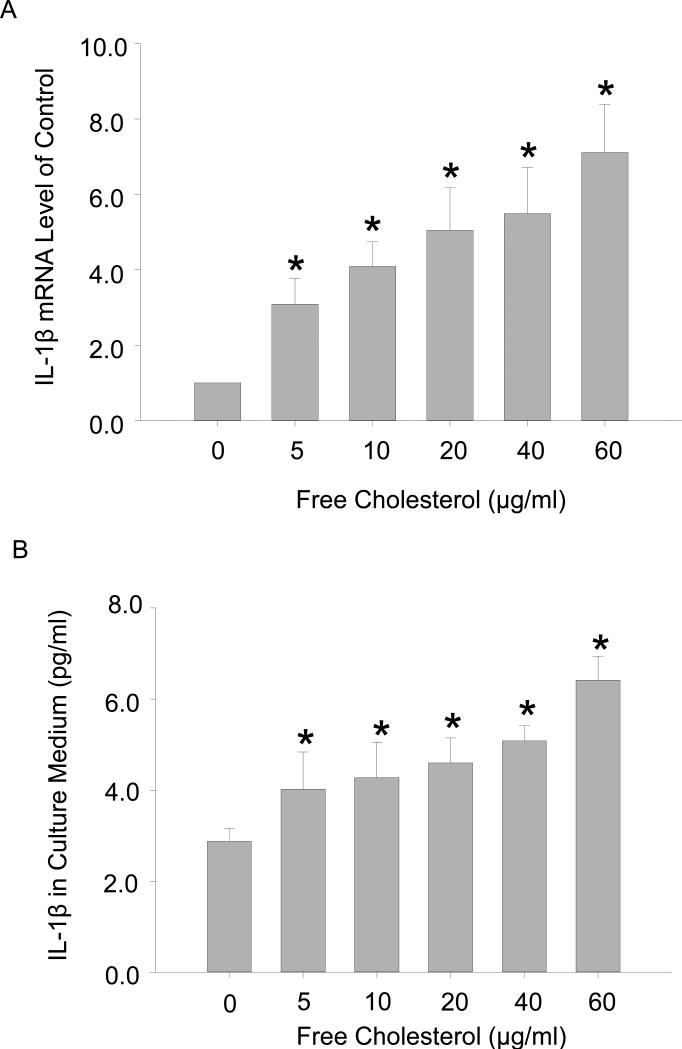
Results: Macrophage viability was increased at the treatment of lower concentrations of free cholesterol from (in µg/ml) 0 to 20, but gradually decreased at higher concentrations from 20 to 60. Lower free cholesterol loading induced anti-inflammatory M2 macrophage polarization. The activation of the PPARx03B3; (Peroxisome Proliferator-Activated Receptor gamma) nuclear factor underscored the stimulation of this M2 phenotype. Nevertheless, higher levels of free cholesterol resulted in pro-inflammatory M1 activation. Moreover, with the application of higher free cholesterol concentrations, macrophage apoptosis and secretion of the inflammatory cytokine IL-1β increased significantly.

Conclusion: These results for the first time demonstrate that free cholesterol could render concentration-dependent diversification effects on macrophage viability, polarization, apoptosis and inflammatory cytokine secretions, thereby reconciling the pros and cons of free cholesterol buildup in macrophages to the pathophysiology of atherosclerosis.


Figures

Figure 1
Figure 1
Accumulation of cholesterol in macrophages upon free cholesterol loading. A: Confocal microscopy images showed that free cholesterol, stained blue by filipin, progressively accumulated in macrophages as applied free cholesterol concentrations increased from (in μg/ml) 0 to 60. As well, free cholesterol deposition changed from a smear pattern to compartmentalization-like aggregation. In contrast, the buildup of cholesteryl ester, stained green by bodipy 493/503, featured an increase and a subsequent decrease with greater cholesterol loading. B and C: Quantification of free cholesterol and cholesteryl ester buildup by fluorescence intensity analysis. (P<0.05, *: vs., 0 group; #: vs. 20 μg/ml group, n = 6).
Figure 1
Figure 1
Accumulation of cholesterol in macrophages upon free cholesterol loading. A: Confocal microscopy images showed that free cholesterol, stained blue by filipin, progressively accumulated in macrophages as applied free cholesterol concentrations increased from (in μg/ml) 0 to 60. As well, free cholesterol deposition changed from a smear pattern to compartmentalization-like aggregation. In contrast, the buildup of cholesteryl ester, stained green by bodipy 493/503, featured an increase and a subsequent decrease with greater cholesterol loading. B and C: Quantification of free cholesterol and cholesteryl ester buildup by fluorescence intensity analysis. (P<0.05, *: vs., 0 group; #: vs. 20 μg/ml group, n = 6).
Figure 2
Figure 2
Concentration-associated dual effects of free cholesterol loading on macrophage viability. A: Absorbance readings showed that the relative production of the formazan metabolite increased from 1.0 in control to 1.40 ± 0.14 at 20 μg/ml of free cholesterol and then gradually decreased to 0.92 ± 0.08 at 60 μg/ml of cholesterol. B: Flow cytometry readings of relative viable macrophage numbers showed a concentration-associated pattern of change similar to that of formazan metabolite production presented in A. (P<0.05, *: vs. 0 group; #: vs. 20 μg/ml group, n = 7).
Figure 3
Figure 3
Effects of free cholesterol loading on cyclin E1 expression in macrophage viability. Free cholesterol concentration-dependently increased and decreased expressions of cyclin E1 mRNA (A) and proteins (B, C). D: Macrophage proliferation at 20μg/ml of free cholesterol was attenuated by cyclin E1 gene interference as measured by flow cytometry viable cell counting. (P<0.05, *: vs. 0 group, #: vs. 20 μg/ml group, n = 4; &: vs. control, n = 6)
Figure 3
Figure 3
Effects of free cholesterol loading on cyclin E1 expression in macrophage viability. Free cholesterol concentration-dependently increased and decreased expressions of cyclin E1 mRNA (A) and proteins (B, C). D: Macrophage proliferation at 20μg/ml of free cholesterol was attenuated by cyclin E1 gene interference as measured by flow cytometry viable cell counting. (P<0.05, *: vs. 0 group, #: vs. 20 μg/ml group, n = 4; &: vs. control, n = 6)
Figure 4
Figure 4
Distinguishing M1 and M2 polarization upon free cholesterol loading by fluorescence-activated cell sorting (FACS). A: FACS diagram of polarized M1 and M2 subgroup macrophages. B: Summarized FACS results showed that M2 activation was increased at lower concentrations of free cholesterol but markedly reduced at higher concentrations. C: M1 activation experienced significant increases with the application of higher free cholesterol concentrations. (P<0.05, *: vs. 0 group, #: vs. 20 μg/ml group, n = 6).
Figure 5
Figure 5
Free cholesterol induced the M2 phenotype through the activation of the nuclear factor PPARγ. A: The expression of PPARγ mRNA increased with the application of free cholesterol at concentrations from (in μg/ml) 0 to ~20, but gradually decreased thereafter at higher concentrations. B: The representative Western blot image of PPARγ C: The expression of PPARγ proteins upon free cholesterol treatment had a pattern similar to that of the mRNA. D: Inhibiting or silencing PPARγ markedly attenuated M2 activation by free cholesterol at 20 μg/ml. (P<0.05, *: vs. 0 group, #: vs. control, n = 6).
Figure 5
Figure 5
Free cholesterol induced the M2 phenotype through the activation of the nuclear factor PPARγ. A: The expression of PPARγ mRNA increased with the application of free cholesterol at concentrations from (in μg/ml) 0 to ~20, but gradually decreased thereafter at higher concentrations. B: The representative Western blot image of PPARγ C: The expression of PPARγ proteins upon free cholesterol treatment had a pattern similar to that of the mRNA. D: Inhibiting or silencing PPARγ markedly attenuated M2 activation by free cholesterol at 20 μg/ml. (P<0.05, *: vs. 0 group, #: vs. control, n = 6).
Figure 6
Figure 6
Free cholesterol loading boosted pro-inflammatory cytokine IL-1expression. A: IL-1β mRNA levels were enhanced with increases in free cholesterol loading. B: ELISA analysis of secreted IL-1β in macrophage culture medium. (P<0.05, * vs. 0 group, n = 3).
Figure 7
Figure 7
Macrophage apoptosis upon free cholesterol application at high concentrations. A: Flow cytometry diagram of apoptotic macrophages. B: Summarized results showing that the percentage of apoptotic macrophages was markedly increased with the application of high concentrations of cholesterol. (P<0.05, * vs. 0 group, n = 7).

Similar articles

Cited by

References

    1. Levitan I, Volkov S, Subbaiah PV. Oxidized LDL: diversity, patterns of recognition, and pathophysiology. Antioxid Redox Signal. 2010;13:39–75. - PMC - PubMed
    1. Collot-Teixeira S, Martin J, Mcdermott-Roe C, Poston R, Mcgregor JL. CD36 and macrophages in atherosclerosis. Cardiovasc Res. 2007;75:468–477. - PubMed
    1. Chang TY, Chang CC, Lin S, Yu C, Li BL, Miyazaki A. Roles of acyl-coenzyme A:cholesterol acyltransferase-1 and -2. Curr Opin Lipidol. 2001;12:289–296. - PubMed
    1. Brown MS, Goldstein JL. Lipoprotein metabolism in the macrophage: implications for cholesterol deposition in atherosclerosis. Annu Rev Biochem. 1983;52:223–261. - PubMed
    1. Maxfield FR, Tabas I. Role of cholesterol and lipid organization in disease. Nature. 2005;438:612–621. - PubMed

Publication types