. 2015 Sep 29;6(29):28341-56.
doi: 10.18632/oncotarget.5117.

MiR-23a sensitizes nasopharyngeal carcinoma to irradiation by targeting IL-8/Stat3 pathway

Affiliations

MiR-23a sensitizes nasopharyngeal carcinoma to irradiation by targeting IL-8/Stat3 pathway

Jia-Quan Qu et al. Oncotarget. .

Abstract

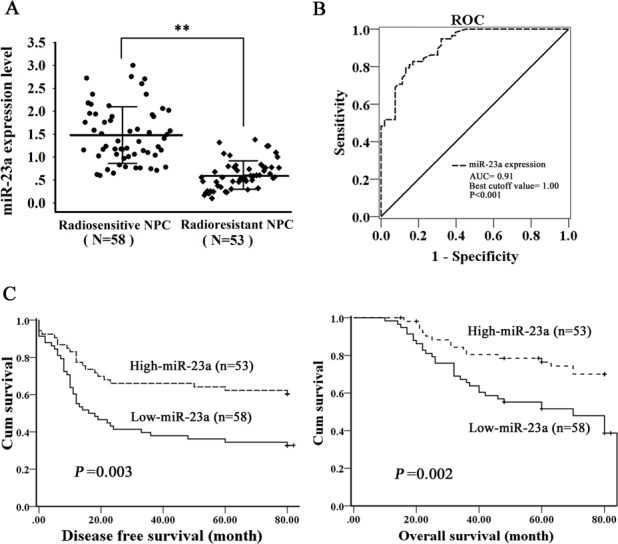
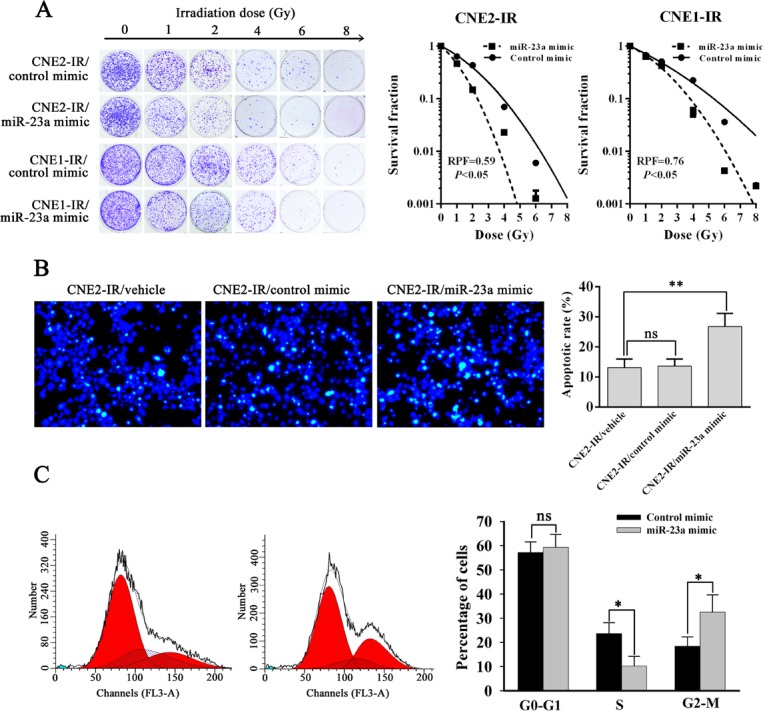
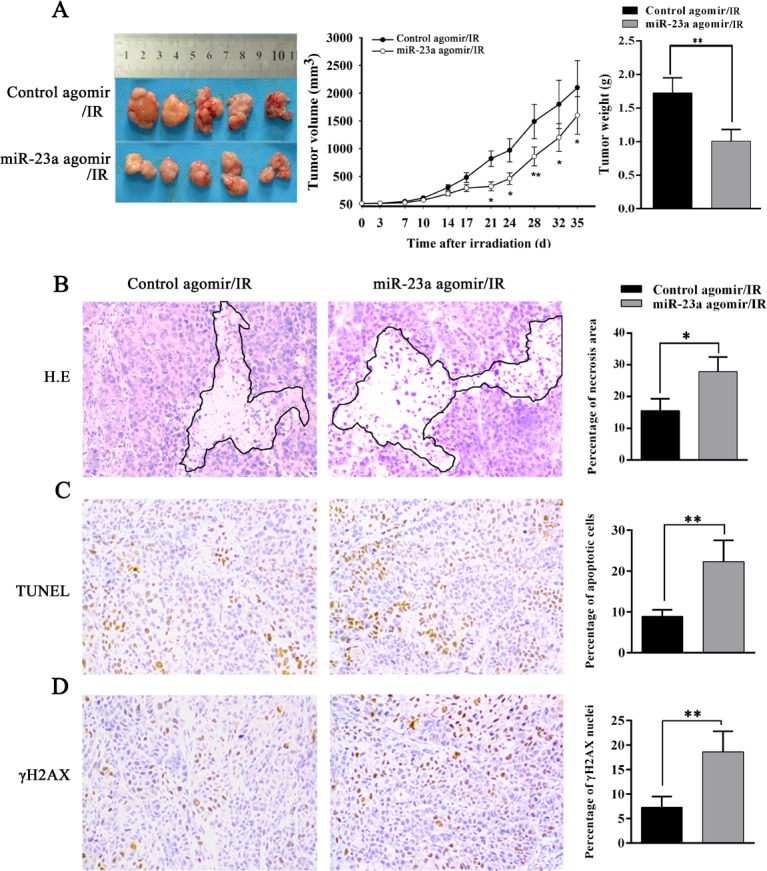
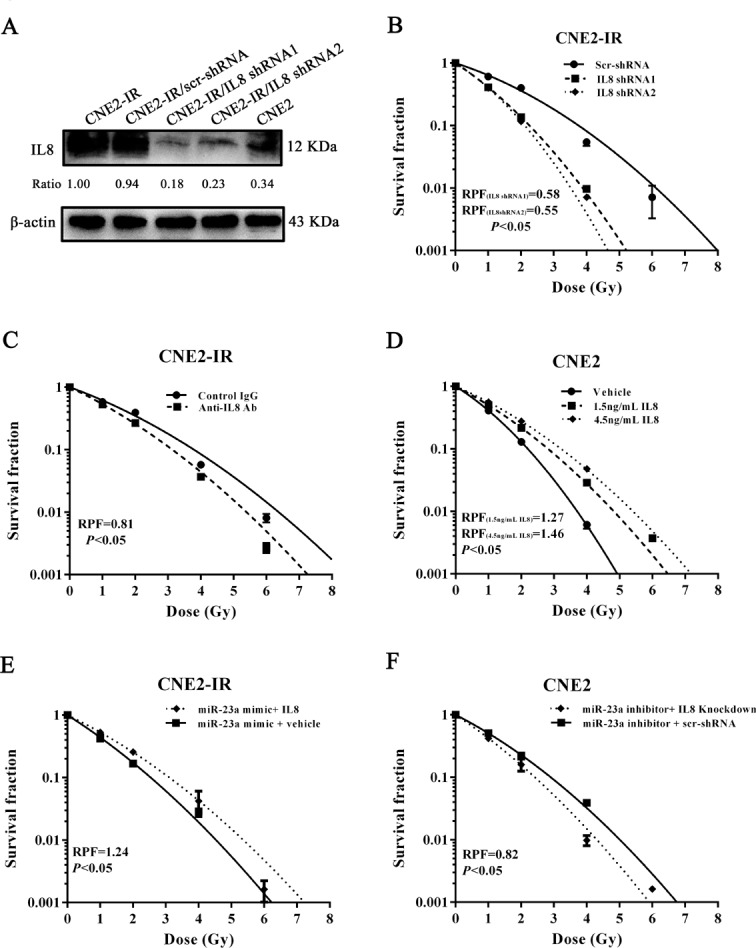
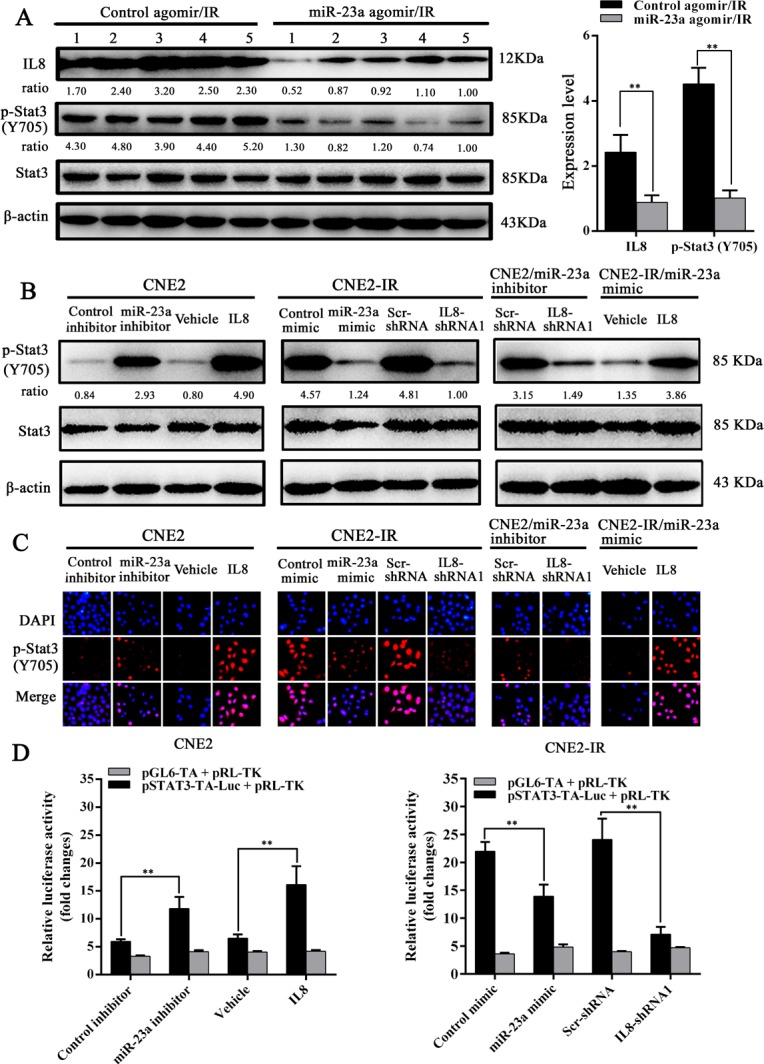
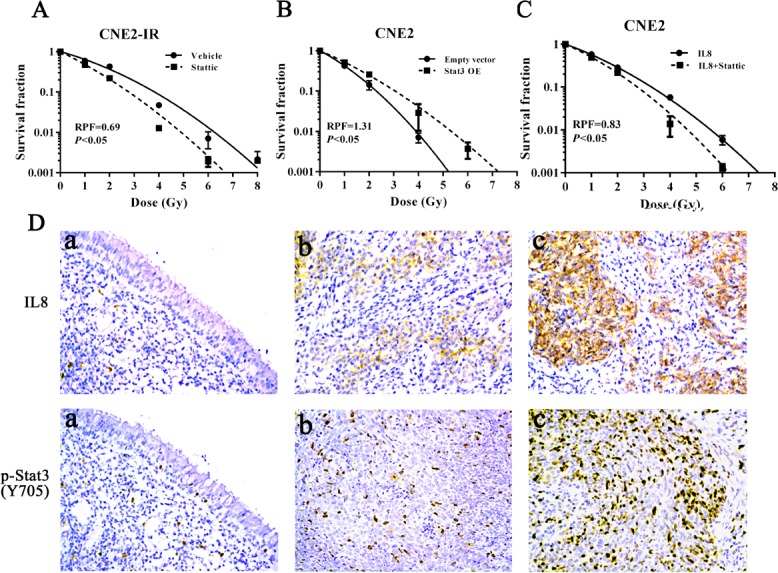
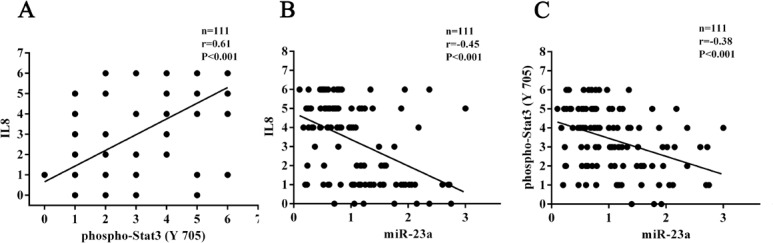
Radioresistance poses a major challenge in nasopharyngeal carcinoma (NPC) treatment, but little is known about how miRNA regulates this phenomenon. In this study, we investigated the function and mechanism of miR-23a in NPC radioresistance, one of downregulated miRNAs in the radioresistant NPC cells identified by our previous microarray analysis. We observed that miR-23a was frequently downregulated in the radioresistant NPC tissues, and its decrement correlated with NPC radioresistance and poor patient survival, and was an independent predictor for reduced patient survival. In vitro radioresponse assays showed that restoration of miR-23a expression markedly increased NPC cell radiosensitivity. In a mouse model, therapeutic administration of miR-23a agomir dramatically sensitized NPC xenografts to irradiation. Mechanistically, we found that reduced miR-23a promoted NPC cell radioresistance by activating IL-8/Stat3 signaling. Moreover, the levels of IL-8 and phospho-Stat3 were increased in the radioresistance NPC tissues, and negatively associated with miR-23a level. Our data demonstrate that miR-23a is a critical determinant of NPC radioresponse and prognostic predictor for NPC patients, and its decrement enhances NPC radioresistance through activating IL-8/Stat3 signaling, highlighting the therapeutic potential of miR-23a/IL-8/Stat3 signaling axis in NPC radiosensitization.

Keywords: IL-8; Stat3; miR-23a; nasopharyngeal carcinoma; radioresistance.


Conflict of interest statement

CONFLICTS OF INTERESTS

The authors disclose no potential conflicts of interest.

Figures

Figure 1
Figure 1. Correlation of miR-23a expression levels with NPC radioresistance and survival of the patients
A., qRT-PCR was performed to determine the expression levels of miR-23a in the radioresistant and radiosensitive NPC tissues. Three experiments were done; Means, SDs, and statistical significance are denoted; **, P < 0.01. B., receiver-operating characteristic (ROC) analysis was performed to determine the cutoff value of miR-23a that could differentiate between the NPC patients with high and low miR-23a levels (P < 0.001; area under the ROC curve, 0.91; cutoff value, 1.00). C., Kaplan-Meier survival analysis for NPC patients according to the expression levels of miR-23a. NPC patients with low miR-23a expression have a significantly worse disease-free survival (left) and overall survival (right) than those with high miR-23a expression. The log-rank test was used to calculate p value.
Figure 2
Figure 2. MiR-23a decreases NPC cell radioresistance in vitro
A., a clonogenic survival assay shows that transfection of miR-23a mimic decreased NPC cell radioresistance compared with transfection of control mimic. (left) CNE2-IR and CNE1-IR cells transiently transfected with control or miR-23a mimic were irradiated with a range of 1-8Gy radiation doses, and colonies that formed after incubation of 12d were stained with crystal violet and photographed; (middle and right) dose survival curves in the CNE2-IR (middle) and CNE1-IR cells (right) transiently transfected with control or miR-23a mimic were created by fitting surviving fractions to the linear quadratic equation. B., Hoechst 33258 staining shows that transfection of miR-23a mimic increased the apoptosis of irradiation-induced CNE2-IR cells compared with transfection of control mimic. (left) CNE2-IR and CNE2-IR cells transiently transfected with control or miR-23a mimic were exposed to 6 Gy irradiation, incubated for 72h, stained with Hoechst 33258 and photographed; (right) a histogram shows the apoptotic rate of CNE2-IR cells and its transfectants. C., a flow cytometry analysis of cell cycle shows that miR-23a mimic-transfected CNE2-IR cells were blocked at G2-M phase by ionizing radiation. (left) a representative result of cell cycle distribution of control or miR-23a mimic-transfected CNE2-IR cells at 24h after 6 Gy irradiation. (right) a histogram shows percentages of cells at each cycle phase in the control or miR-23a mimic-transfected CNE2-IR cells. Three experiments were done; Means, SDs, and statistical significance are denoted; *, P < 0.05; **, P < 0.05; ns, nonsignificant difference.
Figure 3
Figure 3. MiR-23a decreases NPC cell radioresistance in vivo
A., the growth and weight of control or miR-23a agomir-injected CNE2-IR xenograft tumors after irradiation. (left) 5 nmol control or miR-23a agomir was injected into CNE2-IR xenografts before and after 8 Gy ionizing radiation. 5 weeks after irradiation, the mice were killed, and the tumors were photographed; (middle) the growth curves of control or miR-23a agomir-injected CNE2-IR tumors (n = 5 each group) at the sacrifice with respect to the first measurements after irradiation; (right) the average weights of control or miR-23a agomir-injected CNE2-IR tumors (n = 5 each group) at the sacrifice. B., (left) a representative image of H&E staining of control or miR-23a agomir-injected CNE2-IR tumors with regions of necrosis outlined after irradiation; (right) a histogram shows percentages of necrosis areas in the tumors (n = 5 each group). C., (left) a representative image of TUNEL detection of apoptotic cells in the control or miR-23a agomir-injected CNE2-IR tumors after irradiation; (right) a histogram shows percentages of apoptotic cells in the tumors (n = 5 each group). D., (left) a representative image of immunohistochemical staining for γH2AX in the control or miR-23a agomir-injected CNE2-IR tumors after irradiation; (right) a histogram shows percentages of γ-H2AX positive cells in the tumors (n = 5 each group). Means, SDs, and statistical significance are denoted; *, P < 0.05; **, P < 0.01. Original magnification, &times;200.
Figure 4
Figure 4. MiR-23a increases NPC cell radiosensitivity through targeting IL-8
A., a representative result of Western blotting shows IL-8 expression levels in CNE2, CNE2-IR, CNE2-IR cells stably transfected with IL-8 shRNA 1, IL-8 shRNA 2 or scramble shRNA vector; B., a clonogenic survival assay shows that knockdown of IL-8 decreased CNE2-IR cell radioresistance. CNE2-IR cells stably transfected with IL-8 shRNA 1, IL-8 shRNA 2 or scramble shRNA vector were irradiated with a range of 1-8Gy radiation doses, and dose survival curves were created by fitting surviving fractions to the linear quadratic equation. C., a clonogenic survival assay shows that antibody neutralization of secretory IL-8 decreased CNE2-IR cell radioresistance. CNE2-IR cells treated with 2.5 mg/mL IL-8 antibody or control IgG were irradiated with a range of 1-8Gy radiation doses, and dose survival curves were created by fitting surviving fractions to the linear quadratic equation. D., a clonogenic survival assay shows that exogenous IL-8 stimulation increased CNE2 cell radioresistance. CNE2 cells stimulated with 1.5, 4.5 ng/mL IL-8 or vehicle were irradiated with a range of 1-8Gy radiation doses, and dose survival curves were created by fitting surviving fractions to the linear quadratic equation. E., a clonogenic survival assay shows that exogenous IL-8 stimulation significantly abolished the radiosensitizing effect of miR-23a mimic in the radioresistant CNE2-IR cells. MiR-23a mimic-transfected CNE2-IR cells treated with 4.5 ng/mL IL-8 or vehicle were irradiated with a range of 1-8Gy radiation doses, and dose survival curves were created by fitting surviving fractions to the linear quadratic equation. F., a clonogenic survival assay shows that IL-8 knockdown markedly abolished radioresistance induced by transfection of miR-23a inhibitor in the radiosensitive CNE2 cells. CNE2 cells transiently cotransfected with miR-23a inhibitor and IL-8 shRNA 1 or scramble shRNA vector were irradiated with a range of 1-8Gy radiation doses, and dose survival curves were created by fitting surviving fractions to the linear quadratic equation. Means, SDs, and statistical significance are denoted.
Figure 5
Figure 5. MiR-23a inhibits Stat3 activity by targeting IL-8 in NPC cells
A., (left) a representative result of Western blotting analysis shows the expression levels of IL-8 and phosphor-Stat3 in the control or miR-23a agomir-injected CNE2-IR xenografts; (right) a histogram shows the average levels of IL-8 and phosphor-Stat3 in the tumors (n = 5 each group). B., a representative result of Western blotting analysis shows phospho-Stat3 levels in the IL-8-stimulated, miR-23a inhibitor-transfected, or miR-23a inhibitor and IL-8 shRNA 1-cotransfected CNE2 cells, and IL-8 knockdown, miR-23a mimic-transfected or miR-23a mimic-transfected and IL-8-stimulated CNE2-IR cells as well as their corresponding controls. C., a representative result of immunofluorescent staining shows the nuclear translocation of phospho-Stat3 in the IL-8-stimulated, miR-23a inhibitor-transfected, or miR-23a inhibitor and IL-8 shRNA 1-cotransfected CNE2 cells, and IL-8 knockdown, miR-23a mimic-transfected or miR-23a mimic-transfected and IL-8-stimulated CNE2-IR cells as well as their corresponding controls. D., Stat3 luciferase reporter activity in the miR-23a inhibitor-transfected or IL-8-stimulated CNE2 cells, and miR-23a mimic-transfected or IL-8 knockdown CNE2-IR cells. Means, SDs, and statistical significance are denoted; **, P < 0.01.
Figure 6
Figure 6. Stat3 signaling mediates miR-23a/IL-8-regulated NPC cell radioresponse
A., a clonogenic survival assay shows that inhibition of Stat3 activity decreased CNE2-IR cell radioresistance. CNE2-IR cells treated with 5 &micro;mol/L Stattic or vehicle were irradiated with a range of 1-8Gy radiation doses, and dose survival curves were created by fitting surviving fractions to the linear quadratic equation. B., a clonogenic survival assay shows that Stat3 overexpression (OE) increased CNE2 cell radioresistance. CNE2-IR cells transfected with 4 μg/mL Stat3 expression or control vector were irradiated with a range of 1-8Gy radiation doses, and dose survival curves were created by fitting surviving fractions to the linear quadratic equation. C., a clonogenic survival assay shows that inhibition of Stat3 signaling significantly abolished CNE2 cell radioresistance induced by exogenous IL-8 stimulation. CNE2 cells treated with 5 &micro;mol/L Stattic and 4.5 ng/mL IL-8 were irradiated with a range of 1-8Gy radiation doses, and dose survival curves were created by fitting surviving fractions to the linear quadratic equation. D., a representative image of IL-8 and phospho-Stat3 immunohistochemical staining in the normal nasopharyngeal mucosal tissue (a), radiosensitive NPC tissue (b) and radioresistant NPC tissue (c). Original magnification, &times;200. Means, SDs, and statistical significance are denoted.
Figure 7
Figure 7. Correlation analyses based on IHC score and qRT-PCR 2-DDCt value (Spearman rank correlation test)
The correlations shown include those between IL-8 and phospho-Stat3 A., IL-8 and miR-23a B. and phospho-Stat3 and miR-23a C..

Similar articles

Cited by

References

    1. Lo KW, To KF, Huang DP. Focus on nasopharyngeal carcinoma. Cancer Cell. 2004;5:423–428. - PubMed
    1. Kristensen CA, Kjaer-Kristoffersen F, Sapru W, Berthelsen AK, Loft A, Specht L. Nasopharyngeal carcinoma. Treatment planning with IMRT and 3D conformal radiotherapy. Acta Oncologica. 2007;46:214–220. - PubMed
    1. Lee AW, Poon Y, Foo W, Law SC, Cheung FK, Chan DK, Tung SY, Thaw M, Ho JH. Retrospective analysis of 5037 patients with nasopharyngeal carcinoma treated during 1976-1985: overall survival and patterns of failure. Int J Radiat Oncol Biol Phys. 1992;23:261–270. - PubMed
    1. Garzon R, Calin GA, Croce CM. MicroRNAs in cancer. Annu Rev Med. 2009;60:167–179. - PubMed
    1. Chaudhry MA. Radiation-induced microRNA: Discovery, functional analysis, and cancer radiotherapy. J Cell Biochem. 2014;115:436–449. - PubMed

Publication types

MeSH terms