. 2015 Sep 29;6(29):28401-24.
doi: 10.18632/oncotarget.4951.

Elevated S100A9 expression in tumor stroma functions as an early recurrence marker for early-stage oral cancer patients through increased tumor cell invasion, angiogenesis, macrophage recruitment and interleukin-6 production

Affiliations

Elevated S100A9 expression in tumor stroma functions as an early recurrence marker for early-stage oral cancer patients through increased tumor cell invasion, angiogenesis, macrophage recruitment and interleukin-6 production

Wei-Yu Fang et al. Oncotarget. .

Abstract

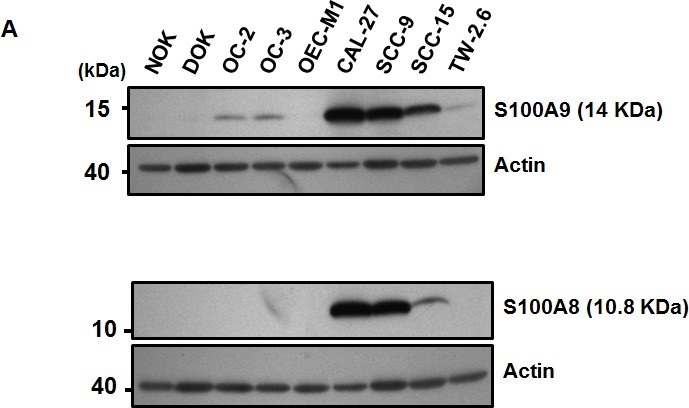
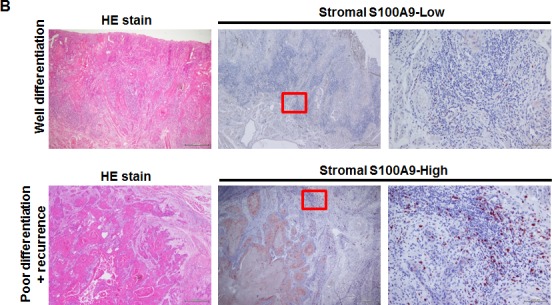
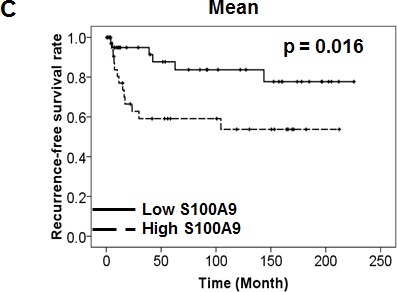
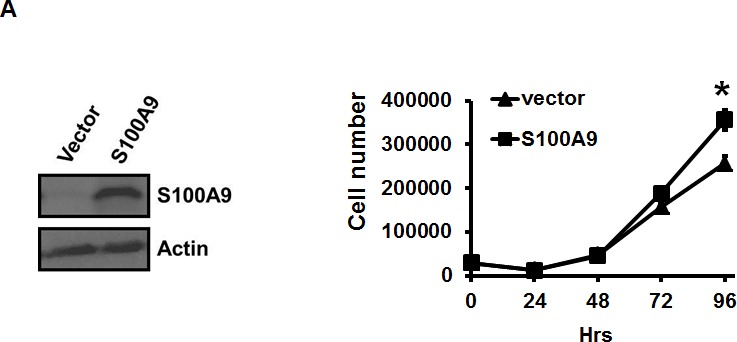
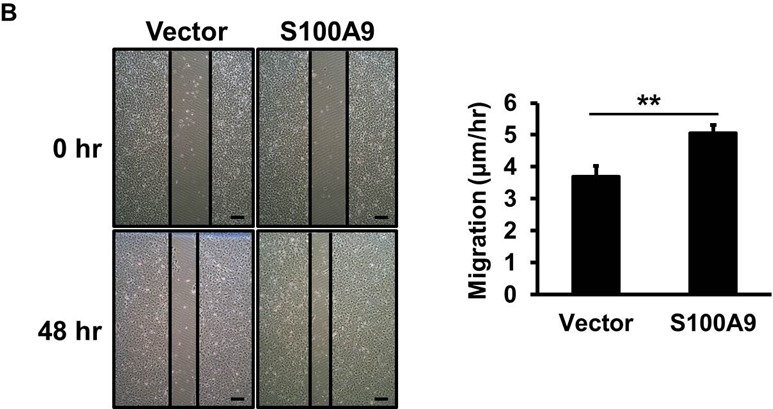
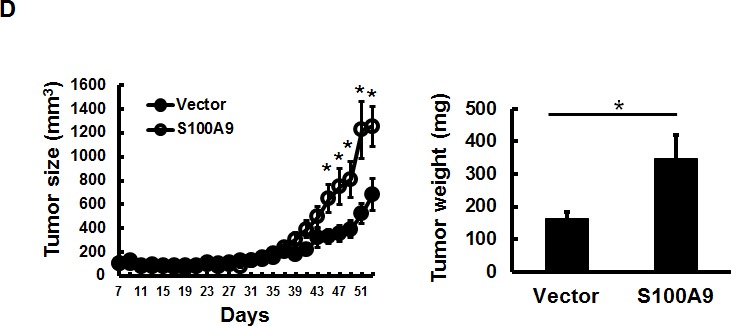
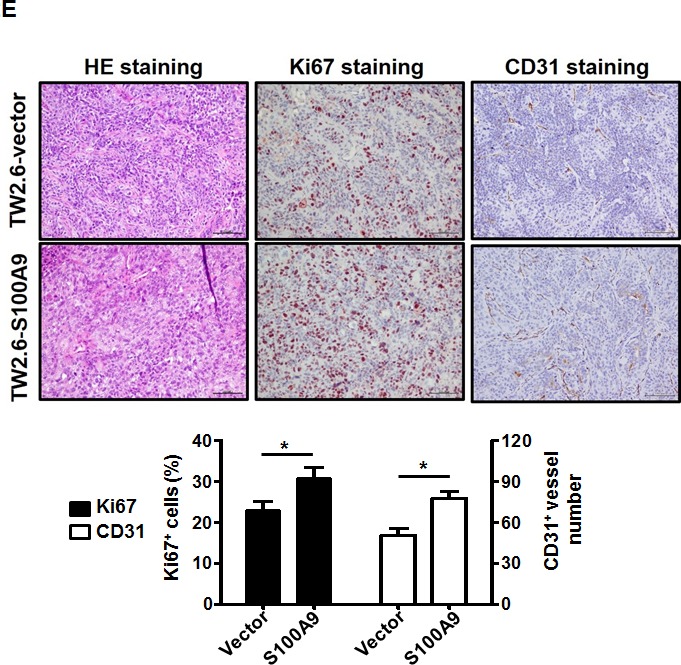
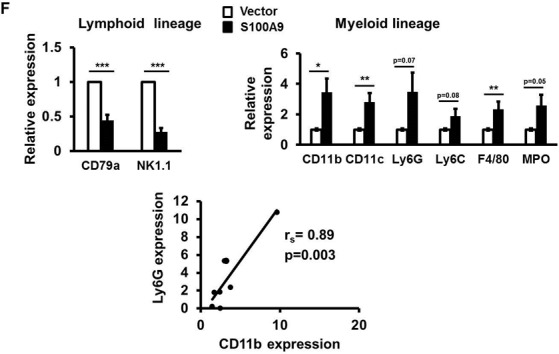
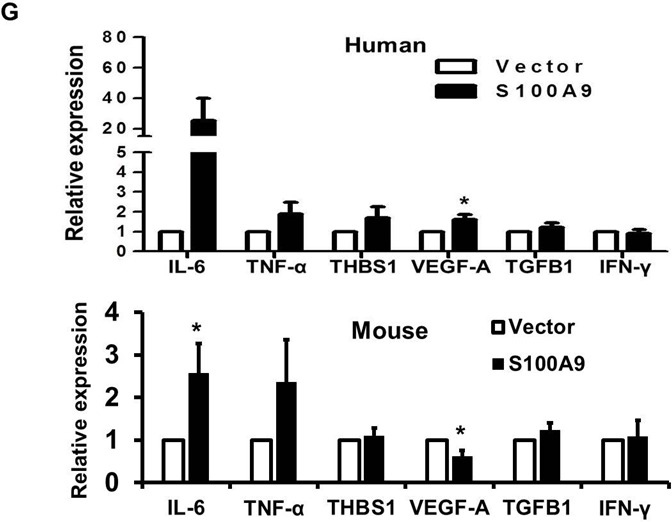
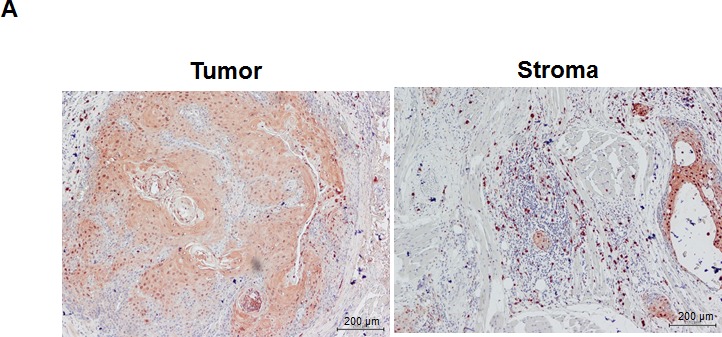
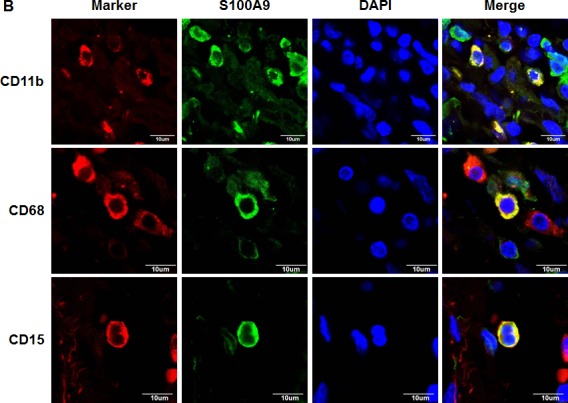
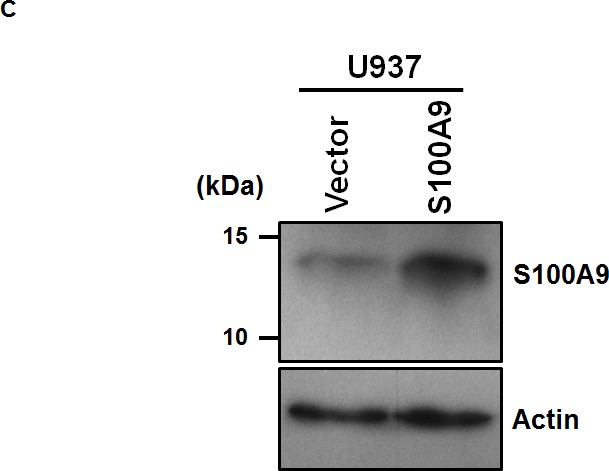
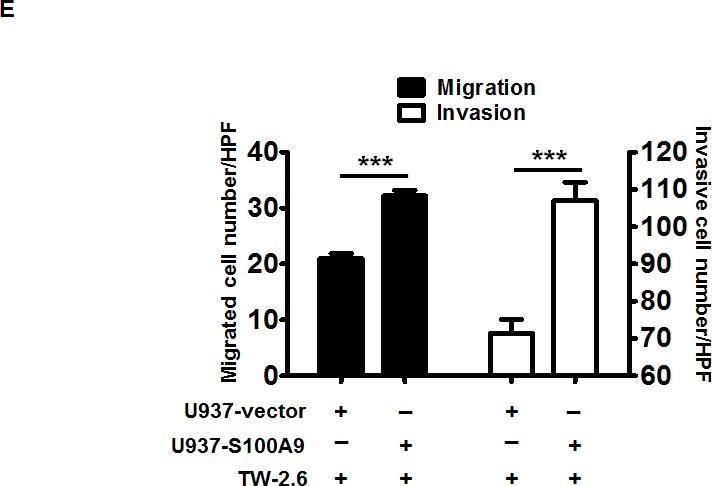
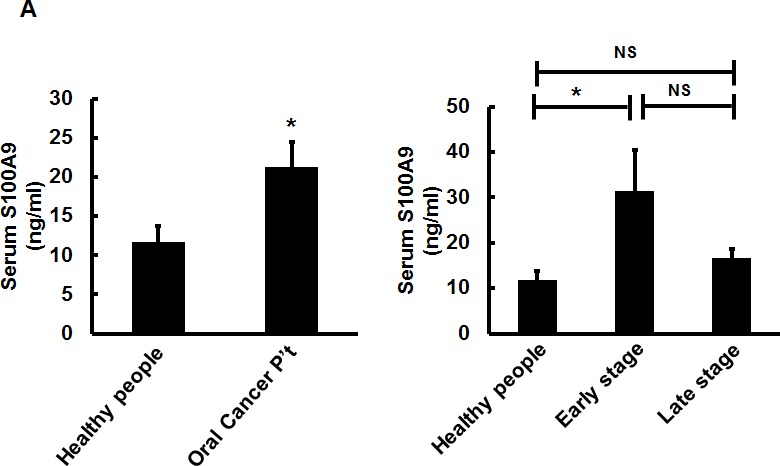
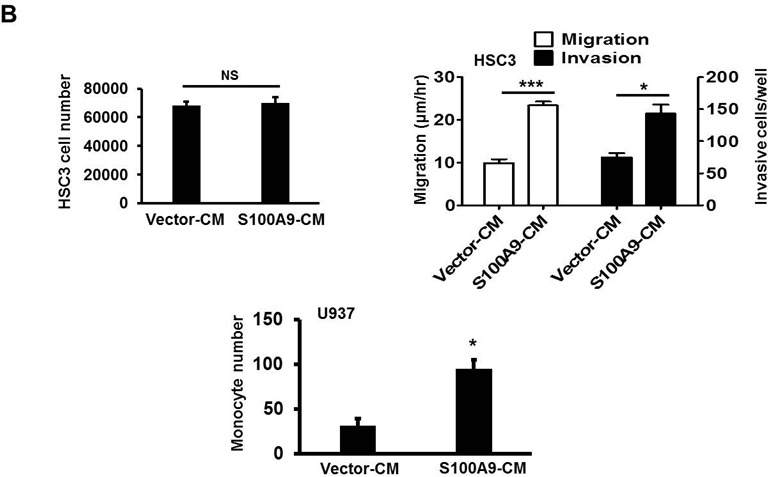
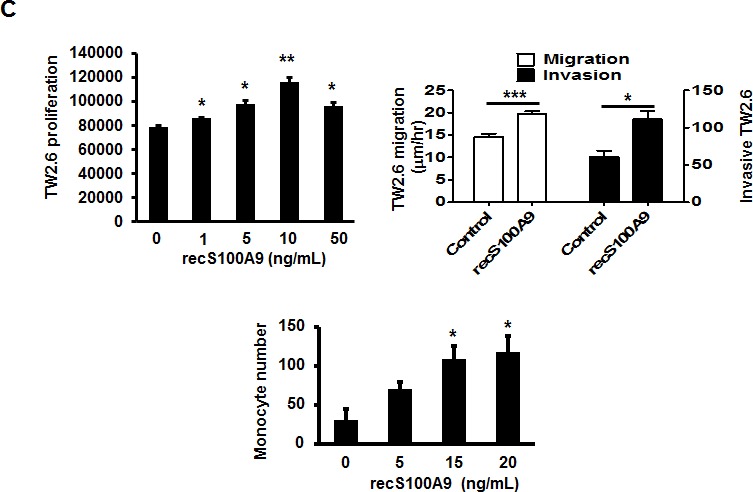
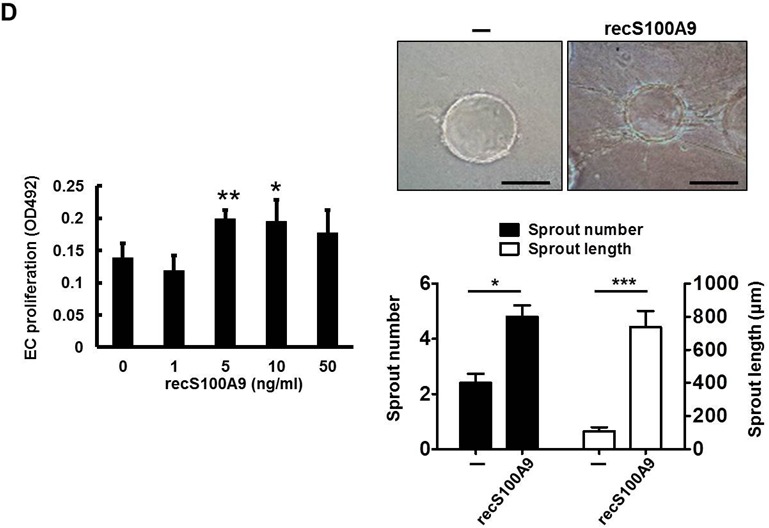
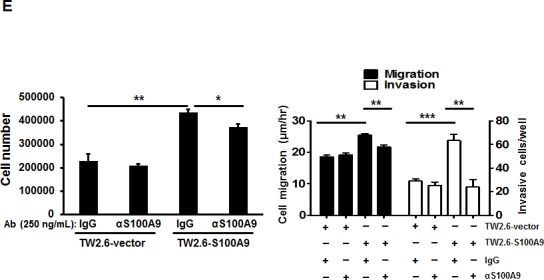
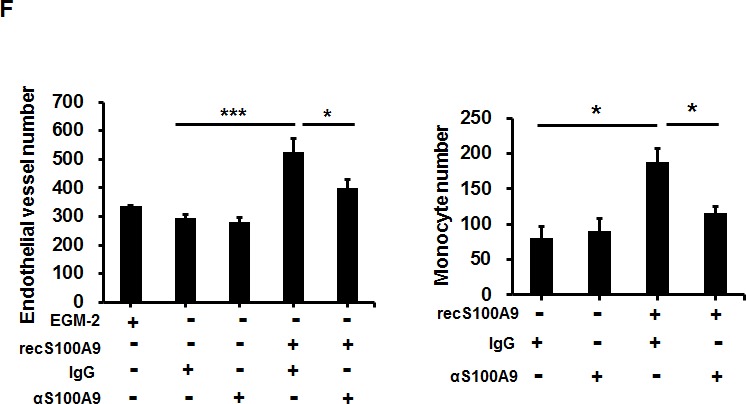
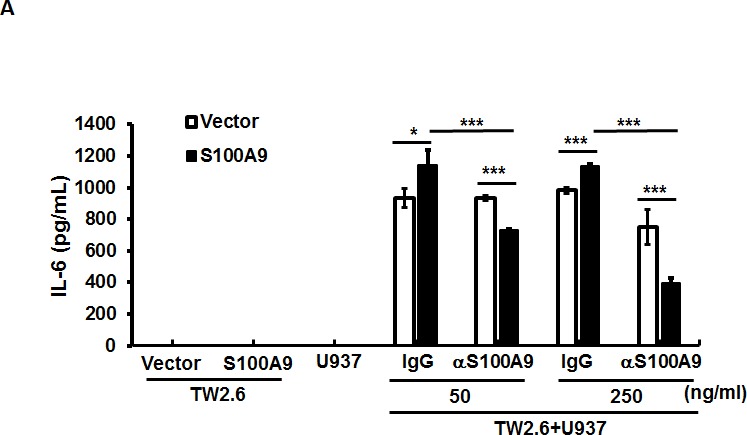
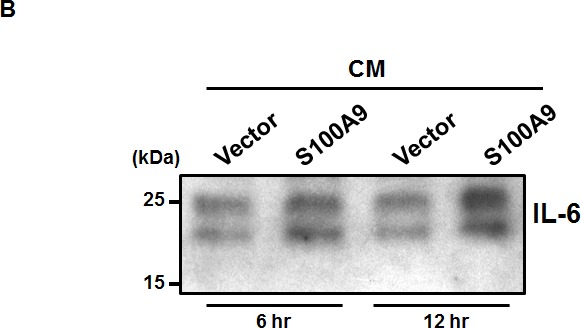
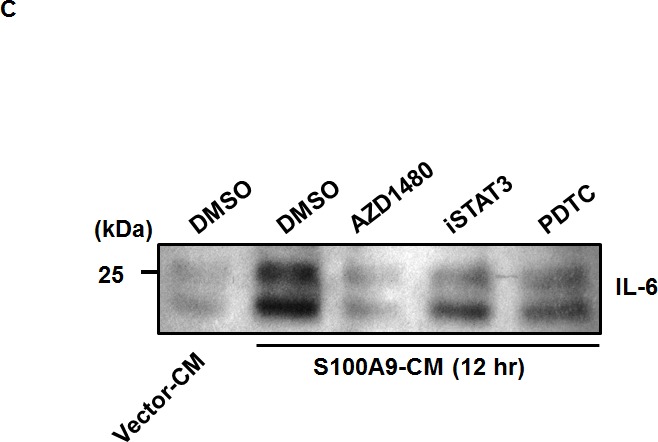
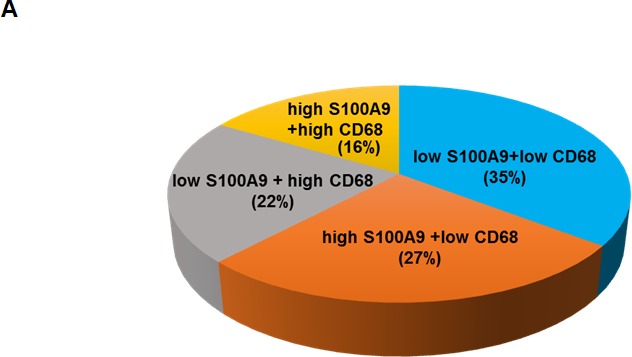
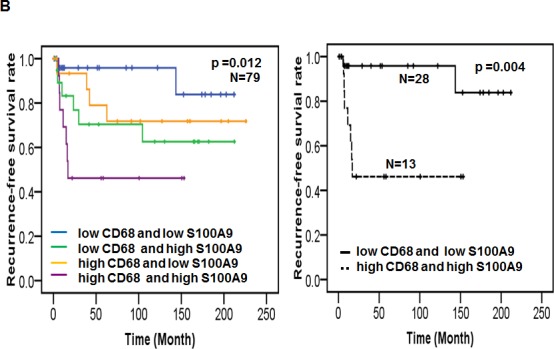
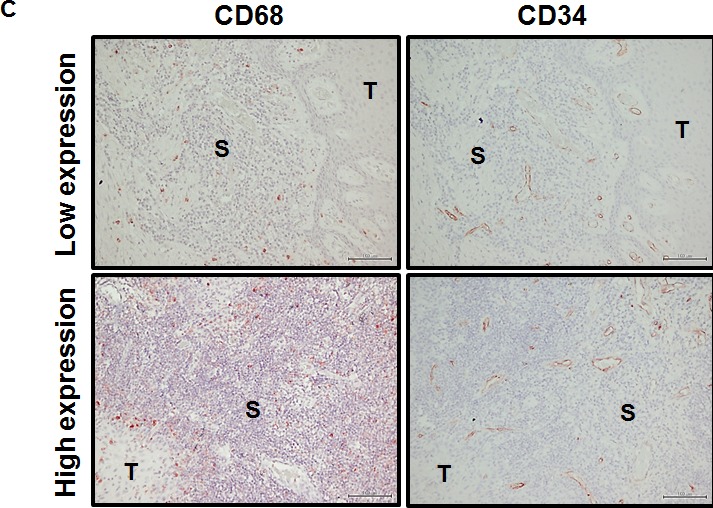
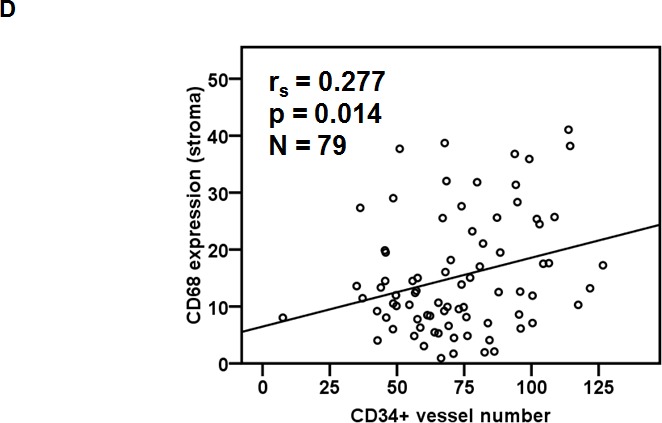
S100A9 is a calcium-binding protein with two EF-hands and frequently deregulated in several cancer types, however, with no clear role in oral cancer. In this report, the expression of S100A9 in cancer and adjacent tissues from 79 early-stage oral cancer patients was detected by immunohistochemical staining. Although S100A9 protein was present in both tumor and stromal cells, only the early-stage oral cancer patients with high stromal expression had reduced recurrence-free survival. High stromal S100A9 expression was also significantly associated with non-well differentiation and recurrence. In addition to increasing cell migration and invasion, ectopic S100A9 expression in tumor cells promoted xenograft tumorigenesis as well as the dominant expression of myeloid cell markers and pro-inflammatory IL-6. The expression of S100A9 in one stromal component, monocytes, stimulated the aggressiveness of co-cultured oral cancer cells. We also detected the elevation of serum S100A9 levels in early-stage oral cancer patients of a separate cohort of 73 oral cancer patients. The release of S100A9 protein into extracellular milieu enhanced tumor cell invasion, transendothelial monocyte migration and angiogenic activity. S100A9-mediated release of IL-6 requires the crosstalk of tumor cells with monocytes through the activation of NF-κB and STAT-3. Early-stage oral cancer patients with both high S100A9 expression and high CD68+ immune infiltrates in stroma had shortest recurrence-free survival, suggesting the use of both S100A9 and CD68 as poor prognostic markers for oral cancer. Together, both intracellular and extracellular S100A9 exerts a tumor-promoting action through the activation of oral cancer cells and their associated stroma in oral carcinogenesis.

Keywords: IL-6; S100A9; macrophages; oral cancer; recurrence.


Conflict of interest statement

CONFLICTS OF INTEREST

All the authors in this manuscript state no conflict of interest.

Figures

Figure 1
Figure 1. Frequent alteration of S100A9 protein in oral cancer and its impacts on patient clinical outcome
A. The expression of S100A9 and S100A8 protein in NOK, DOK and 7 oral cancer cell lines, respectively, detected by Western Blot analysis. Actin, a loading control. B. The staining of S100A9 protein in the tumor and stroma of two representative oral cancer specimens, respectively, with high and low stromal expression by IHC staining. Left panels, HE staining; Middle and Right panels, IHC staining of S100A9 and the enlargement of red box on the Middle panel (40X) highlighting the border between tumor and stroma in Right panel (200X). C. Kaplan-Meier analysis of recurrence-free survival for high and low stromal S100A9 groups. All the 79 patients were divided into two groups based on the mean expression of S100A9 in the tumor stroma. High, greater than mean. Low, equal to or less than mean.
Figure 2
Figure 2. Pro-tumorigenic effect of tumor-derived S100A9 in vitro and in vivo
A. TW-2.6 cells were infected with lentiviruses expressing human S100A9 or empty vector as a negative control. Left, S100A9 expression was measured by Western Blot analysis and actin was a loading control. Right, viable cell numbers were enumerated by cell proliferation assay. B., C. Cell migration and invasion abilities were, respectively, measured by wound healing and cell invasion assays. Data are the mean ± SEM. The representative images for each assay were also shown. Scale bar, 100 m. D. Left, S100A9- or vector- expressing TW-2.6 cells were subcutaneously injected into male nude mice (8 mice for each group). Tumor sizes were measured every 2 days for 53 days due to low tumorigenic potential of TW-2.6. Right, mean tumor weights of vector or S100A9 group at the end point (N = 8). E. Top, Representative HE and IHC staining of Ki67 and CD31 in TW-2.6-vector or -S100A9 tumors (200X magnification). Five random fields (200X) of the Ki67+ nuclei or CD31+ microvessels for each mouse tissue were counted and averaged. Data are Mean±SEM. F. The expression of tumor infiltrating immune cell markers in each tumor tissue was analyzed in triplicate by qRT-PCR. Lymphoid lineage markers: CD79a and NK1.1. Myeloid lineage markers: CD11b, CD11c, Ly6G, Ly6C, F4/80 and MPO. Pearson correlation analysis showing a significant association of CD11b with Ly6G expression in S100A9-bearing xenografts (Bottom). G. Differential expression of the chemokines and cytokines in each xenograft tumor was analyzed in triplicate by qRT-PCR. Top, human-specific probes. Bottom, mouse-specific probes. All qRT-PCR data are mean±SEM (8 mice per group). *p < 0.05, **p < 0.01, ***p < 0.001 versus vector control.
Figure 3
Figure 3. Stromal S100A9 expression in monocytes promotes the migration and invasion of co-cultured oral cancer cells
A. S100A9 protein was detected both in tumor and stroma of one represent oral cancer specimen by IHC staining (100X magnification). B. The presence of S100A9 protein and indicative myeloid cell markers in tumor stroma by confocal immunofluorescence staining of serial sections of the oral cancer specimen. CD15, neutrophils; CD11b, monocytes; CD68, macrophages; DAPI, nuclear stain. C. The increase of ectopic S100A9 protein in the indicated U937 cell clones detected by Western blot analysis. Actin serves as a loading control. D. TW2.6-mCherry cells were incubated with the indicated U937 cells in 2:1 ratio for 48 hours. The number of mCherry-positive cancer cells was measured by a SpectraMAX M3 microplate reader. Data are mean ± SD. E. Cell migration and invasion abilities of TW-2.6 cells co-cultured with indicated U937 cells were measured by using Transwell plates. TW-2.6 cells seeded in the inserts were incubated with the indicated U937 cells in the bottom wells for 24 hours. Data are mean ± SEM. *p < 0.05 or ***p < 0.001 versus vector.
Figure 4
Figure 4. Extracellular S100A9 protein promoted oral cancer migration and invasion, monocytic U937 transendothelial migration, and angiogenesis
A. S100A9 protein in each control or patient serum was measured three times by ELISA. The concentration of serum S100A9 in 18 age-matched healthy control or 73 oral cancer patients with 23 in early stages and 50 in late stages was expressed as mean ± SEM. *p < 0.05; NS, not significant versus healthy volunteers. B. Top, following treatment of HSC-3 with vector- or S100A9-CM from TW-2.6 cells for the indicated time, cell proliferation was measured by cell enumeration. Cell migration and invasion abilities of the indicated cells were, respectively, measured by wound healing and cell invasion assays. Data are mean ± SEM. Bottom, human monocytic U937 cells migration across an endothelial monolayer in response to CM from vector or S100A9-expressing TW-2.6. Data are mean ± SD. C. Top, following treatment with recS100A9 protein (1-50 ng/mL), TW-2.6 cell proliferation was enumerated and expressed as mean ± SD (Left). The migration and invasion abilities of TW-2.6 cells treated for the indicated time with recS100A9 protein (15 ng/mL) equivalent to the detected level in CM were measured, respectively, by wound healing and cell invasion assays and expressed as mean ± SEM (Right). Bottom, the number of U937 monocyte migration across an endothelial monolayer in response to recS100A9 protein (0-20 ng/mL) in mean ± SD. D. Following treatment of recS1009 protein (1-50 ng/mL), endothelial cell proliferation was measured by MTS kits and expressed as mean ± SD (Left). Endothelial cell spheroids were stimulated with recS100A9 protein (15 ng/mL) to induce angiogenic sprouting into the collagen matrix. The mean number of sprouts/bead and the length of sprouts were microscopically assessed (Right). Scale bar, 50 μm. E. Vector or S100A9-expressing TW-2.6 cells were subjected to cell proliferation assay by cell enumeration (Left), wound healing and invasion assays with or without anti-S100A9 antibodies (αS100A9 at 250 ng/mL, Right). Data are mean ± SEM. F. Endothelial vessel numbers were measured in the endothelial cells treated with recS100A9 (20 ng/mL) together with IgG or αS100A9 antibodies (Left). Transendothelial monocyte migration in response to recS100A9 protein was measured in the presence of IgG or αS100A9 antibodies (Right).
Figure 5
Figure 5. The participation of NF-κB and STAT3 activation in the crosstalk between oral cancer cells and monocytes for IL-6 production
A. IL-6 concentrations in the CM from mono-culture or co-culture of the indicated TW-2.6 with U937 cells with or without anti-S100A9 antibodies were measured by ELISA and expressed as mean± SD. *p < 0.05, **p < 0.01 or ***p < 0.001 versus vector or no treatment. NS, not significant. B. Serum-starved U937 cells (106) were treated for 6-12 hr with the indicated CM prior to Western blot analysis. C. Serum-deprived U937 cells were pre-incubated for 30 min with 100 μM PDTC, 100 μM iSTAT3, or 2 μM AZD1480 followed by the addition of the indicated CM for 12 hrs prior to protein isolation and Western blot analysis.
Figure 6
Figure 6. Concomitant high S100A9 with high CD68 protein expression in tumor stroma reduced recurrence-free survival among early-stage oral cancer patients
A. Seventy-nine early-stage oral cancer patients were divided into 4 groups based on the IHC staining of S100A9 and CD68 in tumor stroma. The pie chart shows the percentage of each group. B. Kaplan-Meier analysis showing the relation of recurrence-free survival with the expression of S100A9 and CD68 in stroma. High stromal S100A9 and high CD68 patients had the poorest clinical outcome compared with those with either one high or both low expression. C. High or Low expression of both CD68 staining and CD34+ microvessel density in the stroma of two clinical specimens by IHC staining. S, stroma; T, tumor. D. Pearson correlation analysis showing a positive correlation of CD34-positive microvessel number with stromal CD68 expression in tumor stroma.

References

    1. India Project Team of the International Cancer Genome C. Mutational landscape of gingivo-buccal oral squamous cell carcinoma reveals new recurrently-mutated genes and molecular subgroups. Nature communications. 2013;4:2873. - PMC - PubMed
    1. Massano J, Regateiro FS, Januario G, Ferreira A. Oral squamous cell carcinoma: review of prognostic and predictive factors. Oral surgery, oral medicine, oral pathology, oral radiology, and endodontics. 2006;102:67–76. - PubMed
    1. Ambatipudi S, Gerstung M, Gowda R, Pai P, Borges AM, Schaffer AA, Beerenwinkel N, Mahimkar MB. Genomic profiling of advanced-stage oral cancers reveals chromosome 11q alterations as markers of poor clinical outcome. PloS one. 2011;6:e17250. - PMC - PubMed
    1. Lian Ie B, Tseng YT, Su CC, Tsai KY. Progression of precancerous lesions to oral cancer: results based on the Taiwan National Health Insurance Database. Oral Oncol. 2013;49:427–430. - PubMed
    1. Foell D, Wittkowski H, Vogl T, Roth J. S100 proteins expressed in phagocytes: a novel group of damage-associated molecular pattern molecules. Journal of leukocyte biology. 2007;81:28–37. - PubMed

Publication types

MeSH terms