. 2015 Aug 28;349(6251):aab3500.
doi: 10.1126/science.aab3500.

ADVANCED IMAGING. Extended-resolution structured illumination imaging of endocytic and cytoskeletal dynamics

Affiliations

ADVANCED IMAGING. Extended-resolution structured illumination imaging of endocytic and cytoskeletal dynamics

Dong Li et al. Science. .

Abstract

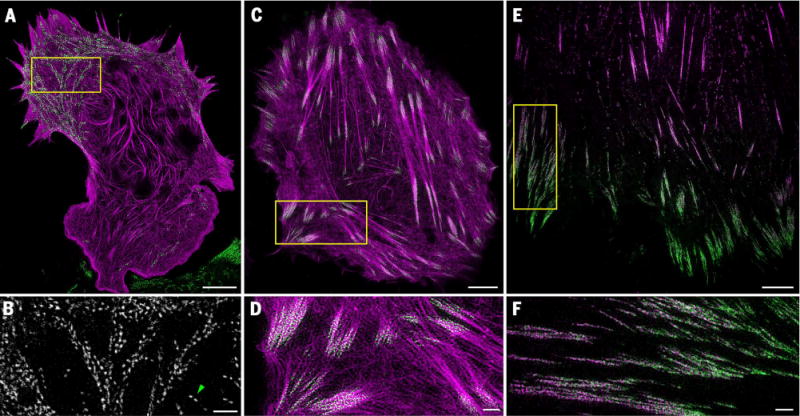
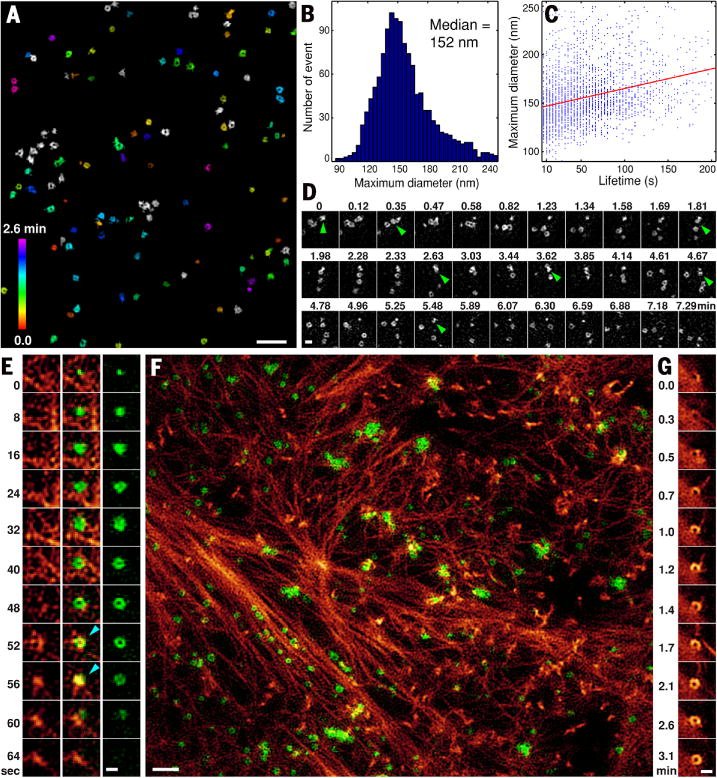
Super-resolution fluorescence microscopy is distinct among nanoscale imaging tools in its ability to image protein dynamics in living cells. Structured illumination microscopy (SIM) stands out in this regard because of its high speed and low illumination intensities, but typically offers only a twofold resolution gain. We extended the resolution of live-cell SIM through two approaches: ultrahigh numerical aperture SIM at 84-nanometer lateral resolution for more than 100 multicolor frames, and nonlinear SIM with patterned activation at 45- to 62-nanometer resolution for approximately 20 to 40 frames. We applied these approaches to image dynamics near the plasma membrane of spatially resolved assemblies of clathrin and caveolin, Rab5a in early endosomes, and α-actinin, often in relationship to cortical actin. In addition, we examined mitochondria, actin, and the Golgi apparatus dynamics in three dimensions.


Figures

Fig. 1
Fig. 1. High-speed live-cell imaging at 37°C of associations between proteins at sub-100-nm resolution
(A) Cytoskeletal proteins mApple-F-tractin (purple) and EGFP-myosin IIA (green) in a mouse embryonic fibroblast cell (Movie 1 and fig. S9). (B) Magnified view of the boxed region in (A), showing bipolar myosin IIA filaments with clearly resolved opposed head groups (for example, green arrowhead). (C) mApple-F-tractin (purple) and the focal adhesion protein mEmerald-paxillin (green) in a U2OS cell (movie S2). (D) Magnified view of the boxed region in (C), showing association of paxillin with smaller actin fibers fanning out from the ends of larger stress fiber cables. (E) Focal adhesion proteins mTagRFP-vinculin (purple) and mEmerald-paxillin (green) in a HFF-1 cell (Movie 2 and figs. S10 and S13). (F) Magnified view of the boxed region in (E), showing a gradient of increased paxillin concentration toward the cell periphery. Scale bars, 5 μm (A), (C), and (E); 1 μm (B), (D), and (F).
Fig. 2
Fig. 2. Dynamics of clathrin-mediated endocytosis and the cortical actin cytoskeleton
(A) CCPs, resolved as rings (fig. S14 and movie S4) and color-coded according to their age since initial formation, at one time point from a movie of CCP dynamics in a BSC-1 cell at 37°C stably expressing EGFP-clathrin light chain a (Movie 3). (B) Histogram of maximum diameter of each CCP over its lifetime. (C) Plot of CCP overall lifetime versus CCP maximum diameter. (D) Sequential production of multiple CCPs at a CCP-generating “hot spot,” identified with green arrowheads (Movie 4 and fig. S16). (E) Formation, growth, and dissolution of a single CCP (right) and its relationship to cortical f-actin (left) in a COS-7 cell at 37°C transfected with mEmerald-clathrin light chain b and mCherry-Lifeact. Light blue arrowheads mark time points at which f-actin associates with the CCP. (F) Individual CCPs and clathrin plaques (green) and cortical f-actin (red) at one time point during their evolution in a COS-7 cell (Movie 5, figs. S17 and S18, and movie S5). (G) Formation of a nanoscale ring of f-actin (fig. S17B). Scale bars, 1 mm (A) and (F); and 200 nm (D), (E), and (G).
Fig. 3
Fig. 3. Live-cell nonlinear structured illumination microscopy based on patterned photoactivation
(A) Single time point from a movie of the evolution of cortical f-actin in a COS-7 cell at 23°C transfected with Skylan-NS-Lifeact, seen at 62-nm resolution (Movie 6, fig. S31, and movie S8). (B) Magnified view from a different cell at 37°C, comparing diffraction-limited TIRF microscopy (top left), TIRF with deconvolution (top right), TIRF-SIM (bottom left), and nonlinear TIRF-SIM with patterned activation (PA NL-SIM, bottom right) (movies S9 and S10). (C) Caveolae in a COS-7 cell at 23°C transfected with Skylan-NS-caveolin, comparing TIRF with deconvolution (top left, 220-nm resolution), TIRF SIM (top right, 97-nm resolution), PA NL-SIM (bottom left, 62-nm resolution), and saturated PA NL-SIM (bottom right, 45-nm resolution). (Insets) A single caveolae pit eventually resolved as a ring by saturated PA NL-SIM (Movie 7, figs. S34 to S37, and movie S13. (D) Diversity of caveolae ring diameters as seen by means of PA NL-SIM. (E) Larger rings that may represent surface-docked vesicles. (F) Clusters of caveolae reminiscent of clathrin plaques. (D) to (F) are from a different cell at 37°C (fig. S33 and movie S12). Scale bars, 3 μm (A); 1 μm (B); 200 nm (C); and 100 nm (D), (E), (F), and (C), inset.
Fig. 4
Fig. 4. Combined TIRF-SIM and PA NL-SIM of protein-pair dynamics in living cells
(A) Skylan-NS-Lifeact (orange, PA NL-SIM) and mCherry-Rab5a, a marker of early endosomes (green, TIRF-SIM) in a COS-7 cell at 23°C (Movie 8, figs. S38 and S39, and movie S14). (B) Comparison of EM images of early endosomes (37) with similarly shaped Rab5a patches seen in (A). (C) Magnified view at three successive time points, showing rapid transport of a Rab5a streak parallel to the cytoskeleton. (D) Skylan-NS-Lifeact (green, PA NL-SIM) and mCherry-α-actinin (purple, TIRF-SIM) in a COS-7 cell at 23°C (Movie 9, figs. S40 and S41, and movie S15). (E) Magnified view from (D), with Lifeact (top), α-actinin (middle), and overlay (bottom) showing paired association at focal adhesions and along the sides of large stress fibers. (F) Evolution of a membrane ruffle, showing α-actinin concentrated at the leading edge. Scale bars, 5 μm (A), (D); 200 nm (B); 1 μm (C) and (E); and 500 nm (F).
Fig. 5
Fig. 5. Live-cell 3D PA NL-SIM via lattice light sheet microscopy
(A) (Top) Membrane marker Skylan-NS-TOM20 showing mitochondria in a COS-7 cell at 23°C, color-coded for distance from the substrate. (Bottom) Evolution of individual mitochondria, showing fission and fusion events, the former preceded by mitochondrial constriction (Movie 10 and fig. S44). (B) Time-lapse distribution of Golgi-resident enzyme Skylan-NS-Mann II in a U2OS cell at 23°C, showing centralized cisternae surrounded by vesicles. White arrowheads indicate a docking vesicle, and red arrowheads highlight rapid export of a long tubular vesicle (movies S17 and S18). Scale bars, 5 μm (A), top; 1 μm (A), bottom; and 3 μm (B).

Comment in

References

    1. Schermelleh L, Heintzmann R, Leonhardt H. A guide to super-resolution fluorescence microscopy. J Cell Biol. 2010;190:165–175. doi: 10.1083/jcb.201002018. - DOI - PMC - PubMed
    1. Schnell U, Dijk F, Sjollema KA, Giepmans BN. Immunolabeling artifacts and the need for live-cell imaging. Nat Methods. 2012;9:152–158. doi: 10.1038/nmeth.1855. - DOI - PubMed
    1. Nieuwenhuizen RP, et al. Measuring image resolution in optical nanoscopy. Nat Methods. 2013;10:557–562. doi: 10.1038/nmeth.2448. - DOI - PMC - PubMed
    1. Shu X, et al. A genetically encoded tag for correlated light and electron microscopy of intact cells, tissues, and organisms. PLOS Biol. 2011;9:e1001041. doi: 10.1371/journal.pbio.1001041. - DOI - PMC - PubMed
    1. Martell JD, et al. Engineered ascorbate peroxidase as a genetically encoded reporter for electron microscopy. Nat Biotechnol. 2012;30:1143–1148. doi: 10.1038/nbt.2375. - DOI - PMC - PubMed

Publication types

MeSH terms