

miR-9-5p suppresses pro-fibrogenic transformation of fibroblasts and prevents organ fibrosis by targeting NOX4 and TGFBR2
- PMID: 26315535
- PMCID: PMC4766462
- DOI: 10.15252/embr.201540750
miR-9-5p suppresses pro-fibrogenic transformation of fibroblasts and prevents organ fibrosis by targeting NOX4 and TGFBR2
Abstract
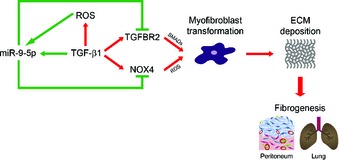
Uncontrolled extracellular matrix (ECM) production by fibroblasts in response to injury contributes to fibrotic diseases, including idiopathic pulmonary fibrosis (IPF). Reactive oxygen species (ROS) generation is involved in the pathogenesis of IPF. Transforming growth factor-β1 (TGF-β1) stimulates the production of NADPH oxidase 4 (NOX4)-dependent ROS, promoting lung fibrosis (LF). Dysregulation of microRNAs (miRNAs) has been shown to contribute to LF. To identify miRNAs involved in redox regulation relevant for IPF, we performed arrays in human lung fibroblasts exposed to ROS. miR-9-5p was selected as the best candidate and we demonstrate its inhibitory effect on TGF-β receptor type II (TGFBR2) and NOX4 expression. Increased expression of miR-9-5p abrogates TGF-β1-dependent myofibroblast phenotypic transformation. In the mouse model of bleomycin-induced LF, miR-9-5p dramatically reduces fibrogenesis and inhibition of miR-9-5p and prevents its anti-fibrotic effect both in vitro and in vivo. In lung specimens from patients with IPF, high levels of miR-9-5p are found. In omentum-derived mesothelial cells (MCs) from patients subjected to peritoneal dialysis (PD), miR-9-5p also inhibits mesothelial to myofibroblast transformation. We propose that TGF-β1 induces miR-9-5p expression as a self-limiting homeostatic response.
Keywords: TGF‐β signaling; fibrosis; miRNAs; myofibroblast; oxidative stress.
© 2015 The Authors.
Figures
- A
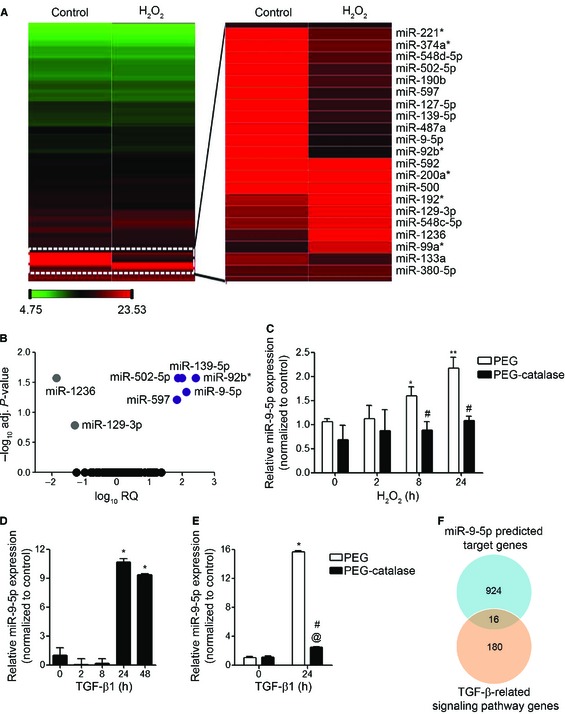
Heat map showing relative mi
RNA expression between untreated (control) and H2O2‐treatedHFL ‐1 cells. The scale bar at the bottom left ranges from green to red (low to high expression) and numbers represent ΔC t values. A blow‐up of differentially expressed miRNA s is depicted on the right side. Data are representative of results from two experiments performed independently. - B
Volcano plot analysis of H2O2‐modulated mi
RNA s. Log10 relative quantification (RQ ) and negative (−) log10 adjusted (adj.) P‐values are plotted on the x‐ and y‐axis, respectively. Each miRNA is represented by a colored dot, gray are down‐regulated, purple are up‐regulated and black are non‐regulated (adj. P‐value ≥ 0.05) miRNA s. - C–E
qRT –PCR analysis of miR‐9‐5p expression inHFL ‐1 cells pre‐incubated for 2 h either with polyethyleneglycol (PEG ) or with 100 units/mlPEG ‐catalase and treated with 100 μM H2O2 for the indicated times (n = 3) (C), in cells treated with 5 ng/mlTGF ‐β1 for the indicated times (n = 3–8) (D) and inHFL ‐1 cells pre‐incubated as described in (C) and treated with 5 ng/mlTGF ‐β1 for 24 h (n = 4) (E). Bar graphs show mean ±SEM ; two‐tailed Mann–Whitney U‐test (C, E) and Kruskal‐Wallis non‐parametricANOVA (D); *P < 0.05, **P ˂ 0.01 compared to control cells, # P < 0.05 compared to the same time point of control cells and @ P < 0.05 compared toPEG ‐catalase‐treated cells at time 0. - F
Venn diagram showing the intersection of miR‐9‐5p targets and
TGF ‐β‐related genes.
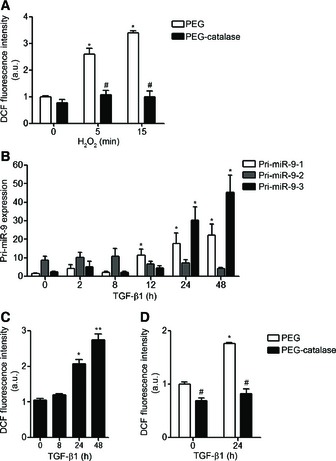
Lung fibroblasts were treated with 100 μM H2O2 for the indicated times after pre‐incubation for 2 h either with polyethylene glycol (
PEG ) or with 100 U/mlPEG ‐catalase (n = 3–5). IntracellularROS production was measured using 2′,7′‐dichlorofluorescein diacetate (DCFH ‐DA ) reagent and analyzed byFACS .qRT –PCR analysis of miR‐9‐5p primary transcripts (pri‐miR‐9) levels inHFL ‐1 cells stimulated with 5 ng/mlTGF ‐β1 for the indicated times (n = 4–7).Intracellular
ROS production inHFL ‐1 cells treated with 5 ng/mlTGF ‐β1 for the indicated times was measured as described in (A) (n = 3–5).Intracellular production of
ROS inHFL ‐1 cells pre‐treated as described above and treated with 5 ng/mlTGF ‐β1 for 24 h was measured as described in (A) (n = 3–5).
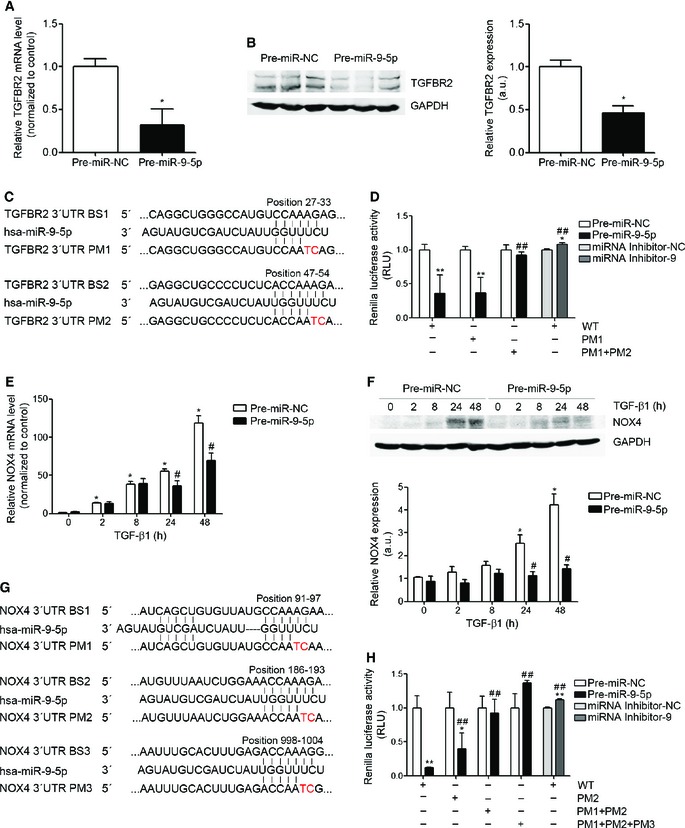
qRT –PCR analysis ofTGFBR 2 expression inHFL ‐1 cells transfected with 40 nM pre‐miR‐NC (control) or pre‐miR‐9‐5p for 48 h (n = 5).Western blot analysis (left) and quantification (n = 6) (right) of
TGFBR 2 protein levels inHFL ‐1 cells transfected as indicated in (A).Sequence of miR‐9‐5p and their base pairing (bars) with the
BS s in the 3′UTR of humanTGFBR 2mRNA .PM s are symbolized by red letters.Luciferase activity in
HFL ‐1 cells co‐transfected with psiCHECK 2 containingWT or mutated 3′UTR sequences of humanTGFBR 2 and 40 nM of pre‐miRs or miRNA inhibitors (n = 3).qRT –PCR analysis ofNOX 4 expression inHFL ‐1 cells transfected as described in (A) and treated with 5 ng/mlTGF ‐β1 for the indicated times (n = 4).Western blot analysis (above) and quantification (below) of
NOX 4 expression inHFL ‐1 cells treated as described in (E) (n = 4).Localization of the three miR‐9‐5p predicted
BS s in the 3′UTR of humanNOX 4 gene represented as described in (C).Luciferase activity as described in (D) with the
WT or mutated 3′UTR sequences of humanNOX 4 gene (n = 3).
- A
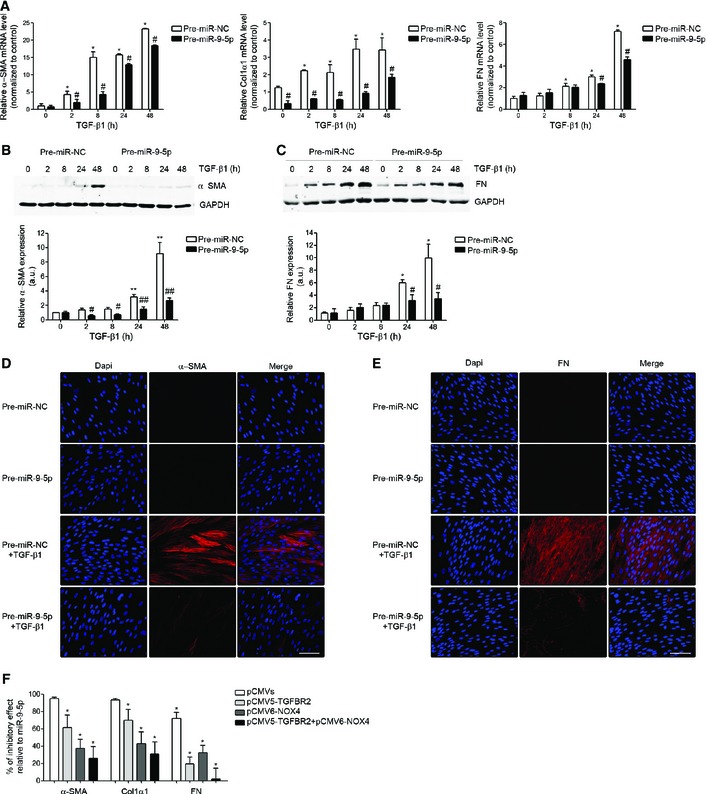
qRT –PCR analysis of α‐SMA (n = 4), Col1α (n = 3) andFN (n = 3) expression levels inHFL ‐1 cells transfected with 40 nM pre‐miR‐NC (control) or pre‐miR‐9‐5p and treated with 5 ng/mlTGF ‐β1 for the indicated times. - B, C
Protein levels (above) of α‐
SMA (n = 4) (B) andFN (n = 3) (C) inHFL ‐1 cells described in (A). Quantification of protein expression is shown below. a.u., arbitrary units. - D, E
Fluorescence microscopy images of
HFL ‐1 cells stained with specific antibodies against α‐SMA (D, middle panels) andFN (E, middle panels) after transfection as described in (A) andTGF ‐β1 treatment for 48 h (n = 3). Nuclei were stained withDAPI (blue). Scale bars: 100 μm. - F
Bar graph represents percentage (%) of inhibitory effect of miR‐9‐5p on α‐
SMA , Col1α1 andFN expression after over‐expression ofTGFBR 2,NOX 4 or both.HFL ‐1 cells were transfected with 3 μgpCMV 5‐TGFBR 2, 3 μgpCMV 6‐NOX 4 or 3 μg of each plasmid and 40 nM pre‐miR‐9‐5p and treated with 5 ng/mlTGF ‐β1 for 24 h (n = 4). Control cells were transfected with 3 μgpCMV 5 and 3 μgpCMV 6.
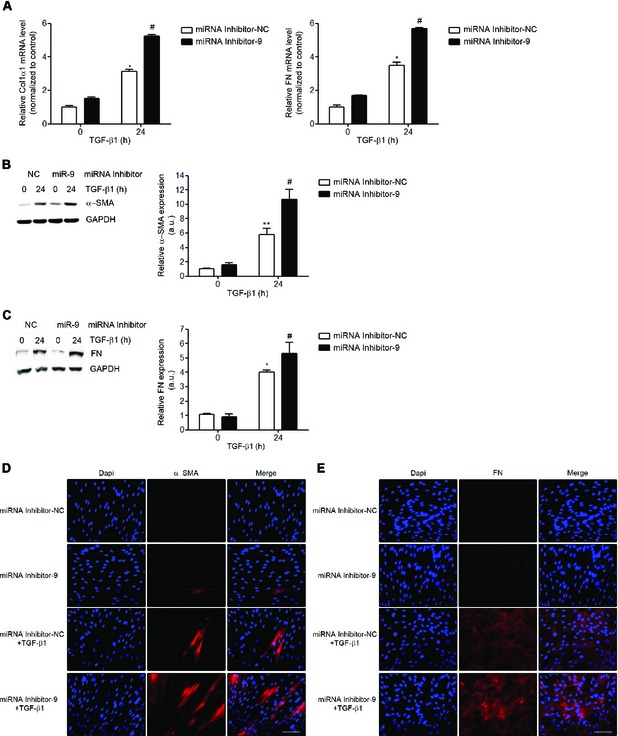
- A
qRT –PCR analysis of Col1α andFN (n = 4) expression levels inHFL ‐1 cells transfected with 40 nM miRNA inhibitorNC (control) or miRNA inhibitor‐9‐5p and treated with 5 ng/mlTGF ‐β1 for 24 h. - B, C
Protein levels (left) of α‐
SMA (n = 5) (B) andFN (n = 4) (C) inHFL ‐1 cells described in (A). Quantification of protein expression (right). a.u., arbitrary units. - D, E
Fluorescence microscopy images of
HFL ‐1 cells stained with specific antibodies against α‐SMA (D, middle panels) andFN (E, middle panels) after transfection as described in (A) andTGF ‐β1 treatment for 24 h (n = 3). Nuclei were stained withDAPI (blue). Scale bars: 100 μm.
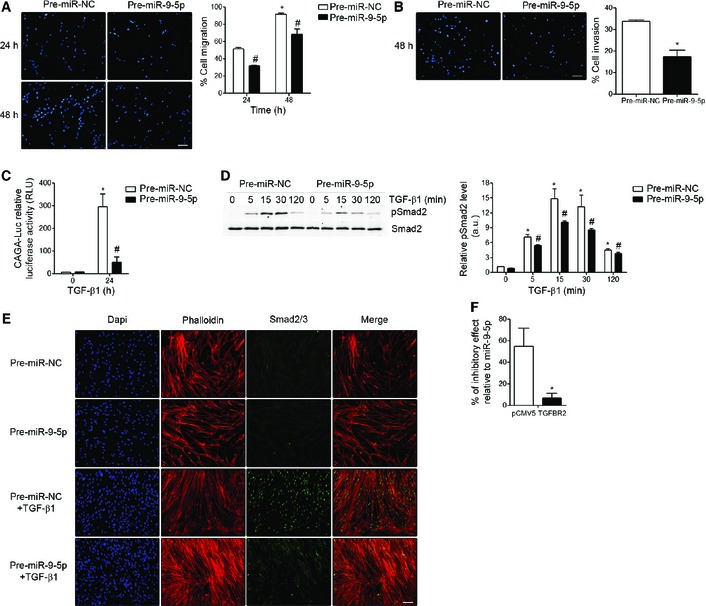
Fluorescence images (left) and quantification (n = 3) (right) of migration in
HFL ‐1 cells transfected with either 40 nM pre‐miR‐NC (control) or pre‐miR‐9‐5p in response toTGF ‐β1 for the indicated times. Nuclei were stained withDAPI (blue). Scale bar: 100 μm.Fluorescence images (left) and quantification (n = 3) (right) of collagen matrix invasion in
HFL ‐1 cells transfected with either 40 nM pre‐miR‐NC or pre‐miR‐9‐5p in response toTGF ‐β1 for 48 h. Nuclei were stained withDAPI (blue). Scale bar: 100 μm.Luciferase activity of the reporter construct in
HFL ‐1 cells co‐transfected with 40 nM pre‐miR‐NC or pre‐miR‐9‐5p and treated with 5 ng/mlTGF ‐β1 for 24 h (n = 3).Western blot analysis (left) and quantification (n = 4) (right) of
pS mad2 protein levels inHFL ‐1 cells transfected as described in (A) and treated with 5 ng/mlTGF ‐β1 for the indicated times. a.u., arbitrary units.Fluorescence microscopy images of
HFL ‐1 cells stained with specific antibodies against Smad2/3 (green) after indicated treatments (n = 3). Nuclei were stained withDAPI (blue) and F‐actin was stained with phalloidin (red). Scale bar: 100 μm.Bar graph represents percentage (%) of inhibitory effect of miR‐9‐5p on Smad2 phosphorylation after over‐expression of
TGFBR 2 inHFL ‐1 cells transfected with 3 μgpCMV 5‐TGFBR 2 (TGFBR 2) and 40 nM pre‐miR‐9‐5p and treated with 5 ng/mlTGF ‐β1 for 15 min (densitometric analysis from four separate experiments). Control cells were transfected with 3 μgpCMV 5.
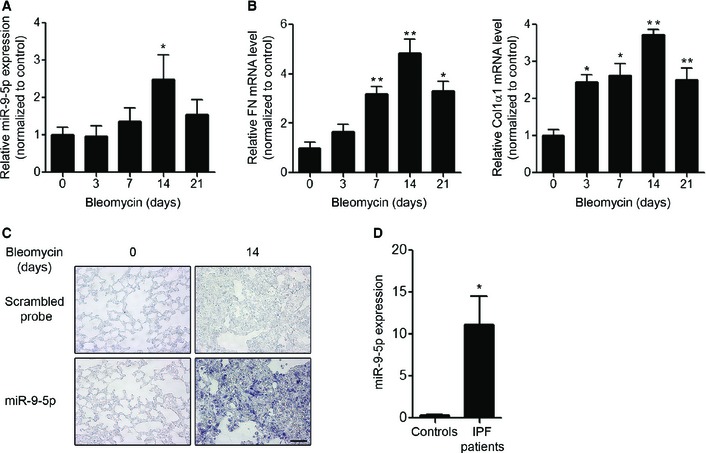
- A, B
qRT –PCR analysis of miR‐9‐5p (A),FN and Col1α1 (B) expression in lungs of mice after orotracheal bleomycin administration (1.5 U/kg body weight in 40 μl saline) for the indicated times (n = 6 mice per group). *P ˂ 0.05, **P ˂ 0.01 compared to day 0. - C
Microphotographs of
ISH showing miR‐9‐5p expression (purple, lower panels) in mouse lung samples at days 0 and 14 after bleomycin instillation (n = 3 mice per group).ISH with scrambled probes are shown in the upper images. Scale bar: 50 μm. - D
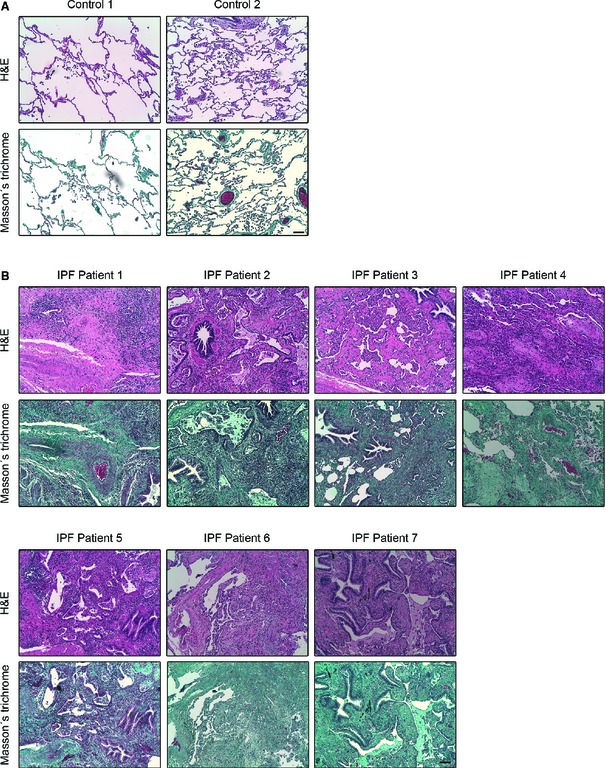
qRT –PCR analysis of miR‐9‐5p expression levels in three histologically normal lungs (controls) and in seven lungs fromIPF patients. *P ˂ 0.05 compared to control lungs.
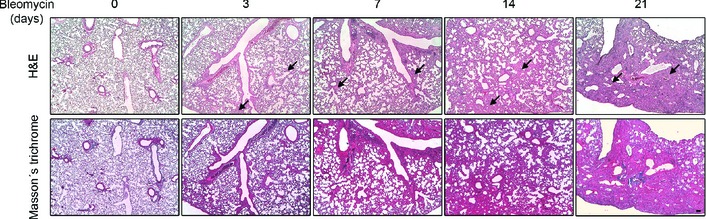
- A, B
Microphotographs of H&E (upper panel in each case) and Masson's trichrome (bottom panel in each case) staining in paraffin‐embedded lung tissue sections from two histologically normal lungs (controls) (A) and seven
IPF patients (B). As it can be observed in (A) control lung tissue is characterized by a thin pulmonary alveolar epithelium. Neither fibroblast norECM deposits are present in the interstitium. InIPF patients (B), an extensive pulmonary fibrosis was observed in all the specimens analyzed. Alveolar interstitium is fully occupied by fibroblasts, inflammatory infiltrates and markedly visibleECM deposits (blue in Masson's staining for collagen). Alveolar epithelium is barely observed due to fibrosis development. All images are shown at equal magnification. Scale bar: 100 μm.
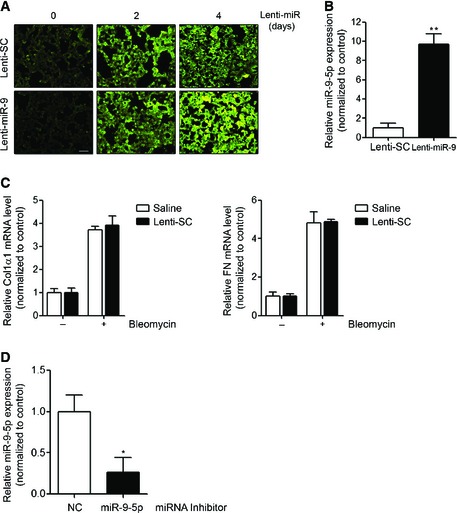
GFP ‐expressing fluorescence images of frozen lung sections from mice orotracheally instilled with lenti‐SC (control) or lenti‐miR‐9 vector (1 × 10⁶ i.f.u./mouse) for the indicated days (n = 3 mice in each group). Scale bar: 100 μm.qRT –PCR analysis of miR‐9‐5p expression in lungs from mice after 4 days of lentiviral infection (n = 6 mice per group).qRT –PCR analysis of Col1α1 andFN in lungs from mice administered saline or lenti‐SC 4 days before orotracheal bleomycin instillation (1.5 U/kg body weight in 40 μl saline serum) and sacrificed 14 days after treatment (n = 3 mice per group).qRT –PCR analysis of miR‐9‐5p expression in lungs from mice administered miRNA inhibitorNC (control) or miRNA inhibitor‐9‐5p (7 mg/kg body weight in 40 μl saline). The miRNA inhibitor was instilled at days −4 and −2 before sacrifice (n = 4 mice per group).
- A
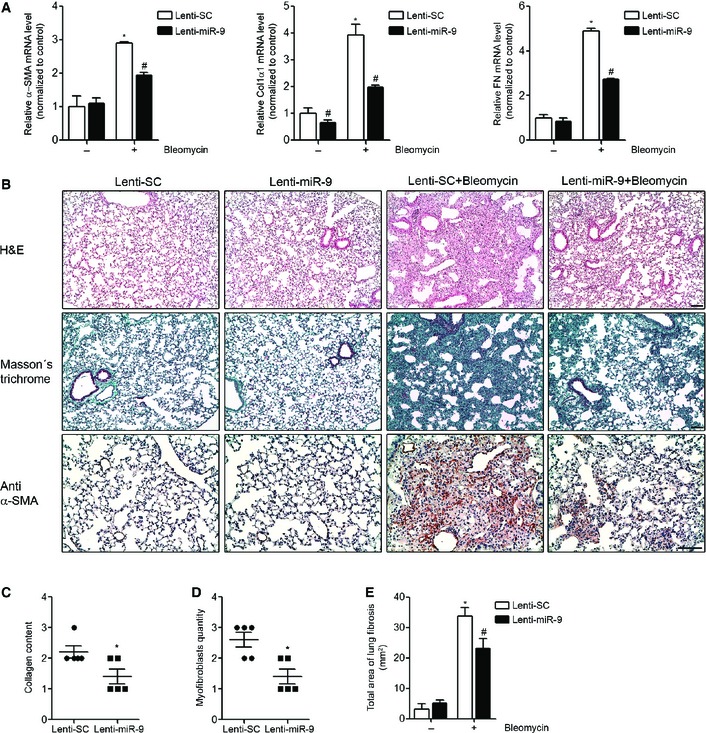
qRT –PCR analysis of α‐SMA , Col1α1 andFN expression in lungs from mice administered 1 × 10⁶ i.f.u. of lenti‐SC (control) or lenti‐miR‐9 for 4 days followed by orotracheal bleomycin administration (1.5 U/kg body weight in 40 μl saline) or saline for 14 days (n = 4 mice per group). - B
Microphotographs of H&E (upper panels) and Masson's trichrome staining (middle panels) and α‐
SMA expression (lower panels) from lung sections of mice treated as described in (A) (n = 4 mice per group). Scale bars: 100 μm. - C, D
Semiquantitative determination (grade 0 to 3) of the collagen content (C) and the quantity of myofibroblasts (D) in lung tissue samples from mice treated as described in (A) (n = 5 mice per group). Each mouse is represented by a symbol, dots represent lenti‐
SC and squares represent lenti‐miR‐9‐treated mice, respectively. - E
Total area of lung fibrosis (mm2) in lung sections from mice treated as described in (A) (n = 4 mice per group).
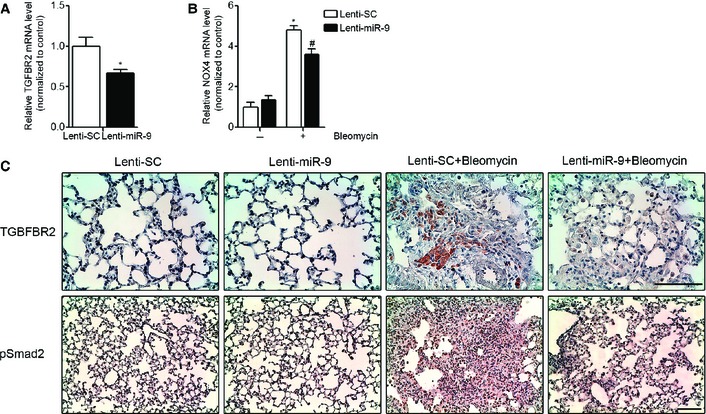
qRT –PCR analysis ofTGFBR 2 expression in lungs from mice administered lenti‐SC (control) or lenti‐miR‐9 (1 × 10⁶ i.f.u.) (n = 4 mice per group).qRT –PCR analysis ofNOX 4 expression in lungs from mice given lenti‐SC (control) or lenti‐miR‐9 (1 × 10⁶ i.f.u. per mouse) for 4 days followed by orotracheal bleomycin administration (1.5 U/kg body weight in 40 μl saline) or saline for 14 days (n = 4 mice per group).Microphotographs of
TGFBR 2 andpS mad2 expression in mouse lung samples described in (B) (n = 4 mice per group). Scale bars: 100 μm.
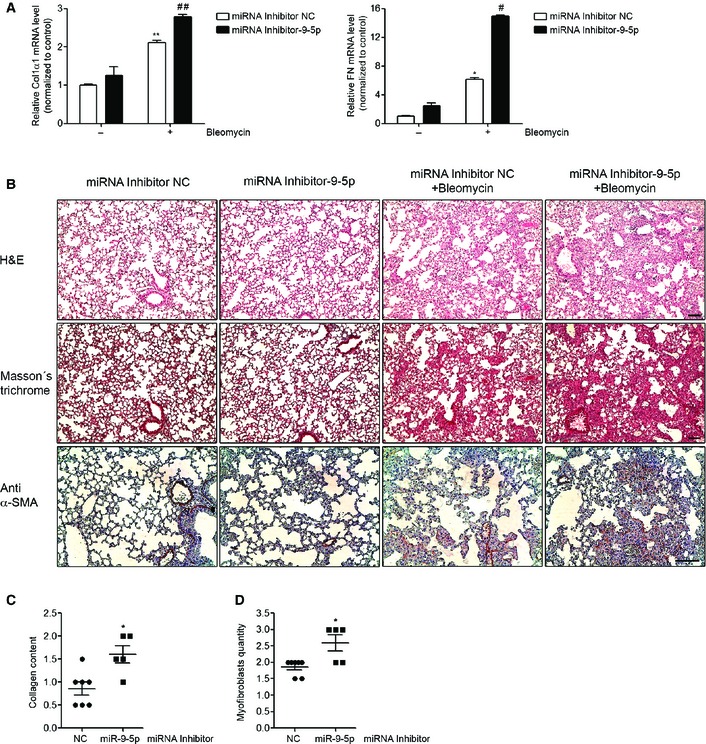
- A
qRT –PCR analysis of Col1α1 andFN expression in lungs from mice administered miRNA inhibitorNC (control) or miRNA inhibitor‐9‐5p (7 mg/kg body weight in 40 μl saline) 4 and 2 days before orotracheal instillation of bleomycin (1.5 U/kg body weight in 40 μl saline) or saline for 10 days (n = 3–6 mice per group). - B
Microphotographs of H&E (upper panels) and Masson's trichrome staining (middle panels) and α‐
SMA expression (lower panels) from lung sections of mice treated as described in (A) (n = 3–7 mice per group). Scale bars: 100 μm. - C, D
Semiquantitative determination (grade 0 to 3) of the collagen content (C) and the quantity of myofibroblasts (D) in lung tissue samples from mice treated as described in (A) (n = 5–7 mice per group). Each mouse is represented by a symbol, dots represent mi
RNA inhibitorNC and squares represent miRNA inhibitor‐9‐5p‐treated mice, respectively.
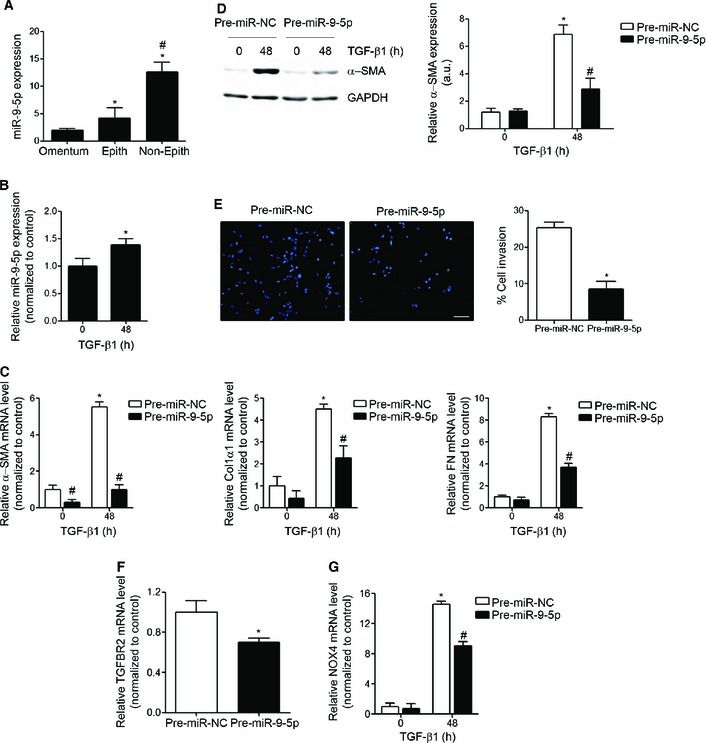
qRT –PCR analysis of miR‐9‐5p expression in omentum‐derivedMC s (n = 3) epith (n = 5) and non‐epith (n = 4) effluent‐derivedMC s. *P ˂ 0.05 compared to omentum‐derivedMC s and # P ˂ 0.05 compared to epith effluent‐derivedMC s.qRT –PCR analysis of miR‐9‐5p expression in omentum‐derivedMC s treated with 5 ng/mlTGF ‐β1 for 48 h (n = 3). *P ˂ 0.05 compared to untreated cells.qRT –PCR analysis of α‐SMA , Col1α1 andFN in omentum‐derivedMC s transfected with 40 nM pre‐miR‐NC (control) or pre‐miR‐9‐5p and treated with 5 ng/mlTGF ‐β1 for 48 h (n = 3). *P < 0.05 compared to negative control‐transfected cells and # P < 0.05 compared to the corresponding negative control time point.Western blot analysis (left) and quantification (right) of α‐
SMA protein levels in cells treated as described in (C) (n = 3). a.u., arbitrary units. *P < 0.05 compared to negative control‐transfected cells and # P < 0.05 compared to the corresponding negative control time point.Fluorescence images (left) and quantification (right) of collagen matrix invasion in omentum‐derived
MC s transfected with either 40 nM pre‐miR‐NC or pre‐miR‐9‐5p in response toTGF ‐β1 for 24 h (n = 3). Nuclei were stained withDAPI (blue). Scale bar: 100 μm.qRT –PCR analysis ofTGFBR 2 expression in omentum‐derivedMC s transfected with 40 nM of pre‐miR‐NC (control) or pre‐miR‐9‐5p for 48 h (n = 3).qRT –PCR analysis ofNOX 4 expression in omentum‐derivedMC s treated as described in (C) (n = 3).
References
-
- Noble PW (2006) Idiopathic pulmonary fibrosis: natural history and prognosis. Clin Chest Med 27: S11–S16, v - PubMed
Publication types
MeSH terms
Substances
LinkOut - more resources
Full Text Sources
Other Literature Sources
Medical
