

Genome sequencing of herb Tulsi (Ocimum tenuiflorum) unravels key genes behind its strong medicinal properties
- PMID: 26315624
- PMCID: PMC4552454
- DOI: 10.1186/s12870-015-0562-x
Genome sequencing of herb Tulsi (Ocimum tenuiflorum) unravels key genes behind its strong medicinal properties
Abstract
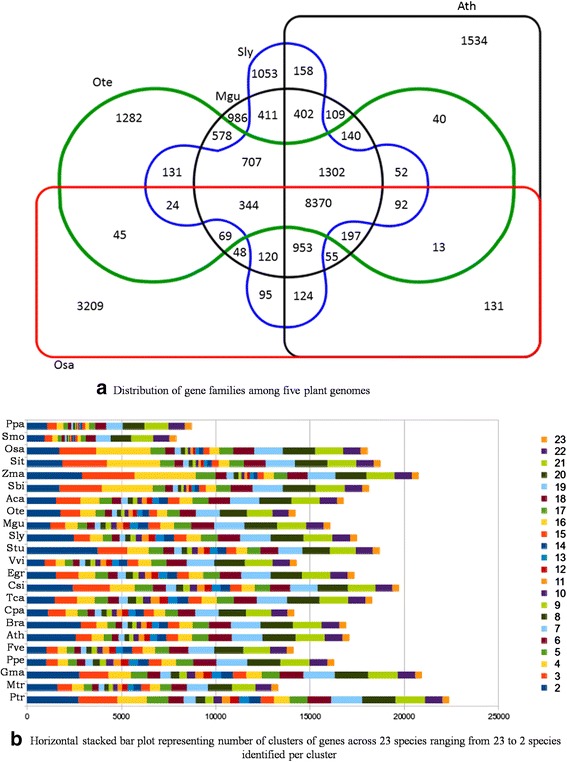
Background: Krishna Tulsi, a member of Lamiaceae family, is a herb well known for its spiritual, religious and medicinal importance in India. The common name of this plant is 'Tulsi' (or 'Tulasi' or 'Thulasi') and is considered sacred by Hindus. We present the draft genome of Ocimum tenuiflurum L (subtype Krishna Tulsi) in this report. The paired-end and mate-pair sequence libraries were generated for the whole genome sequenced with the Illumina Hiseq 1000, resulting in an assembled genome of 374 Mb, with a genome coverage of 61 % (612 Mb estimated genome size). We have also studied transcriptomes (RNA-Seq) of two subtypes of O. tenuiflorum, Krishna and Rama Tulsi and report the relative expression of genes in both the varieties.
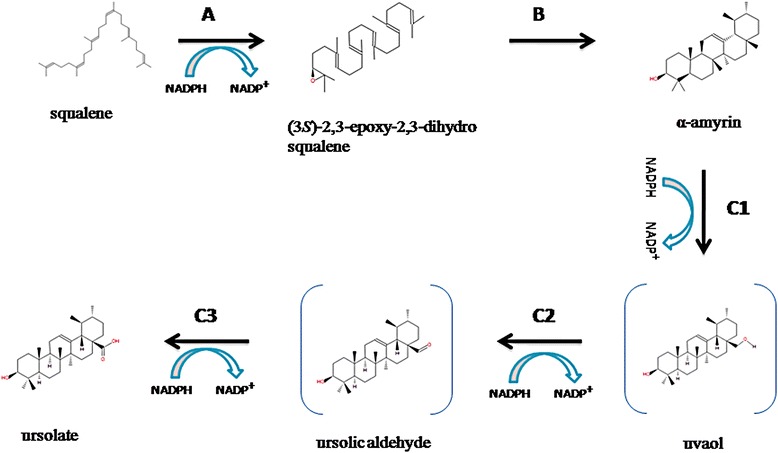
Results: The pathways leading to the production of medicinally-important specialized metabolites have been studied in detail, in relation to similar pathways in Arabidopsis thaliana and other plants. Expression levels of anthocyanin biosynthesis-related genes in leaf samples of Krishna Tulsi were observed to be relatively high, explaining the purple colouration of Krishna Tulsi leaves. The expression of six important genes identified from genome data were validated by performing q-RT-PCR in different tissues of five different species, which shows the high extent of urosolic acid-producing genes in young leaves of the Rama subtype. In addition, the presence of eugenol and ursolic acid, implied as potential drugs in the cure of many diseases including cancer was confirmed using mass spectrometry.
Conclusions: The availability of the whole genome of O.tenuiflorum and our sequence analysis suggests that small amino acid changes at the functional sites of genes involved in metabolite synthesis pathways confer special medicinal properties to this herb.
Figures


 = < 2 genes,
  =2 genes,
  = > 2 genes,
  = Metabolite related genes. Height of orange columns in outermost circle represents amount of repeats in corresponding scaffolds
 in outer circle represents amount of repeats present in respective scaffold. The inner circle represents chromosomes from Tomato genome. Inner circle of rectangles represents scaffolds, each scaffold is organized in the middle circle and is represented in chronological order as per position on chromosomes. Color of each scaffold indicates following information:
  =2 genes,
  = > 2 genes,
  = Metabolite related genes. Connecting line between scaffolds and chromosome represents postion of the scaffold in genome. Red color of connecting line represents presence of metabolite related genes. Scaffold Numbers are mentioned in Additional file 24: Text A


 , anticancer-antioxidant
  , antifungal
  , antiseptic
  , anti-infective
  , antioxidant
  , and anti-inflammatory
  . The enzymes have been labelled with 5–7 letters for convenience. The numbers after the’_’ in the enzyme label represent the number of putative hits found for the given enzyme in the genomic assembly of O. tenuiflorum. The metabolites involved in the disease relevance and the enzymes involved in the synthesis of these metabolites are as follows: APIGENIN (Flavone-synthaseI-FSYN1, Naringenin-NADPH-oxygen-oxidoreductase-NNOOX), LUTEOLIN (Flavone-synthaseI-FSYN1, Naringenin-NADPH-oxygen-oxidoreductase-NNOOX, Flavone-3-monooxygenase-F3MON), TAXOL (Taxadiene-synthase-TSYN, Taxadiene-5-alpha-hydroxylase-T5AHYD, Taxadien-5-alpha-ol-O-acetyltransferase-T5AOOA, Taxane-10-beta-hydroxylase-T10BHYD, Taxoid-14-beta-hydroxylase-T14BHYD, 2-alpha-hydroxytaxane-2-O-benzoyltransferase-2AH2OB, 10-deacetylbaccatin-III-10-O-acetyltransferase-10D10OA, 3-N-debenzoyl-2-deoxytaxol-N-benzoyltransferase-3ND2DNB, URSOLIC ACID (ursolic-aldehyde-28-monooxygenase-UA28M, Alpha-amyrin-synthase-AASYN), OLEANOLIC ACID (Beta-amyrin-synthase-BASYN, oleanolic-aldehyde-28-monooxygenase-OA28M), SITOSTEROL (24C-methyltransferase-24CMET), ROSMARINIC ACID I (4-coumaroyl-4-hydroxyphenyllactate-3-hydroxylase-4C4H3H, Tyrosine-transaminase-TTRAN), ROMARINIC ACID II (Hydroxyphenylpyruvate-reductase-HPPRE, Tyrosine-3-monooxygenase-TTRAN), METHYL CAHVICOL (Eugenol-o-methyltransferase-EOMET), EUGENOL (Alcohol-o-acetyltransferase-AOACE, Eugenol-synthase-ESYN, Isoeugenol-synthase-ISYN), LINALOOL (Farnesyl-pyrophosphate-synthase-FPSYN, R-linool-synthase-RLSYN, S-linool-synthase-SLSYN), CARYOPHYLENE (Alpha-humulene-synthase-AHSYN, Beta-caryophyllene-synthase-BCSYN), SELINENE (Alpha-selinene-synthase-ASSYN, Beta-selinene-synthase-BSSYN), CITRAL (Geraniol-synthase-GSYN, Geraniol-dehdrogenase-GDHYD)

References
-
- Paton A, Harley RM, and Harley MM. Ocimum-an overview of relationships and classification. Ocimum Aromatic Plants-Industrial Profiles. Amsterdam: Harwood Academic (1999)
-
- Willis JC. A dictionary of the flowering plants and ferns, by J. C. Willis. Cambridge: The University Press; 1919.
-
- Prakash P, Gupta N. Therapeutic uses of Ocimum sanctum Linn (Tulsi) with a note on eugenol and its pharmacological actions: a short review. Indian J Physiol Pharmacol. 2005;49:125–31. - PubMed
-
- Khare CP. Indian medicinal plants: an illustrated dictionary. Springer Science & Business Media; 2007.
Publication types
MeSH terms
Associated data
LinkOut - more resources
Full Text Sources
Other Literature Sources
Molecular Biology Databases
Miscellaneous
