Are rates of vision loss in patients in English glaucoma clinics slowing down over time? Trends from a decade of data
- PMID: 26315701
- PMCID: PMC5129813
- DOI: 10.1038/eye.2015.161
Are rates of vision loss in patients in English glaucoma clinics slowing down over time? Trends from a decade of data
Erratum in
-
Are rates of vision loss in patients in English glaucoma clinics slowing down over time? Trends from a decade of data.Eye (Lond). 2015 Dec;29(12):1639. doi: 10.1038/eye.2015.186. Eye (Lond). 2015. PMID: 26656249 Free PMC article. No abstract available.
Abstract
Purpose: To examine changes in rates of visual field (VF) progression in patients attending a sample of glaucoma clinics in England between 1999 and 2012.
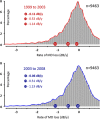
Methods: An archive of 473 252 Humphrey VFs recorded across the UK was retrospectively examined. Distribution of rates recorded in the first half of the decade was compared with the second. The relationship between age and severity of MD loss at baseline with rates of loss and frequency of testing was examined.
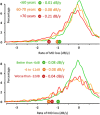
Results: VF series from 18 926 eyes were analysed. Median rate of MD loss for the period before and after 2003 was -0.11 and -0.06 dB/year, respectively, but the proportion of eyes with medium or fast rates of MD loss remained constant. Median rate of MD loss in older (>70 years) eyes was faster than that observed in younger (<60 years) eyes (-0.21 compared with -0.01 dB/year). Median rate of loss did not vary with severity of MD loss at baseline. Frequency of testing, typically carried out annually, did not vary by age, rate of loss or disease severity.
Conclusions: VFs of eyes treated in the first half of the decade deteriorated more rapidly than those in the second half. Several factors might explain these differences but average effects were small and there was no reduction in the proportion of rapidly progressing eyes over the decade. Older age and, to a lesser extent, worse VF damage at diagnosis are indicators for faster VF loss in clinics, but frequency of VF testing was similar for all patients.
Figures


References
-
- Chauhan BC. Group CGS. Canadian Glaucoma Study: 1. Study design, baseline characteristics, and preliminary analyses. Can J Ophthalmol 2006; 41(5): 566–575. - PubMed
-
- De Moraes CGV, Juthani VJ, Liebmann JM, Teng CC, Tello C, Susanna R et al. Risk factors for visual field progression in treated glaucoma. Arch Ophthalmol 2011; 129(5): 562–568. - PubMed
-
- Chauhan BC, Malik R, Shuba LM, Rafuse PE, Nicolela MT, Artes PH. Rates of glaucomatous visual field change in a large clinical population. Invest Ophthalmol Vis Sci 2014; 55(7): 4135–4143. - PubMed
-
- Keenan T, Johnston R, Donachie P, Sparrow J, Stratton I, Scanlon P. United Kingdom National Ophthalmology Database Study: Diabetic Retinopathy; Report 1: prevalence of centre-involving diabetic macular oedema and other grades of maculopathy and retinopathy in hospital eye services. Eye 2013; 27(12): 1397–1404. - PMC - PubMed
MeSH terms
LinkOut - more resources
Full Text Sources
Other Literature Sources
Medical
Miscellaneous

