

Fast and accurate approximate inference of transcript expression from RNA-seq data
- PMID: 26315907
- PMCID: PMC4673974
- DOI: 10.1093/bioinformatics/btv483
Fast and accurate approximate inference of transcript expression from RNA-seq data
Abstract
Motivation: Assigning RNA-seq reads to their transcript of origin is a fundamental task in transcript expression estimation. Where ambiguities in assignments exist due to transcripts sharing sequence, e.g. alternative isoforms or alleles, the problem can be solved through probabilistic inference. Bayesian methods have been shown to provide accurate transcript abundance estimates compared with competing methods. However, exact Bayesian inference is intractable and approximate methods such as Markov chain Monte Carlo and Variational Bayes (VB) are typically used. While providing a high degree of accuracy and modelling flexibility, standard implementations can be prohibitively slow for large datasets and complex transcriptome annotations.
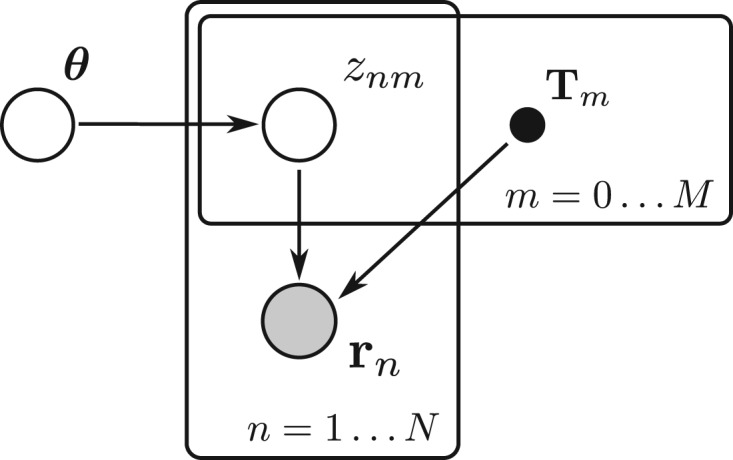
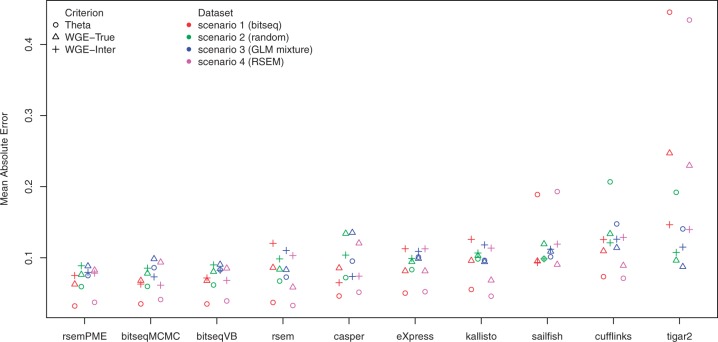
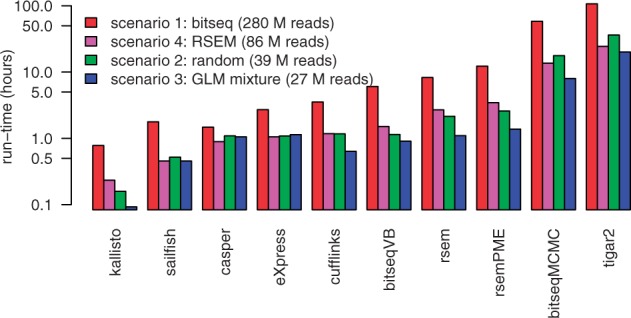
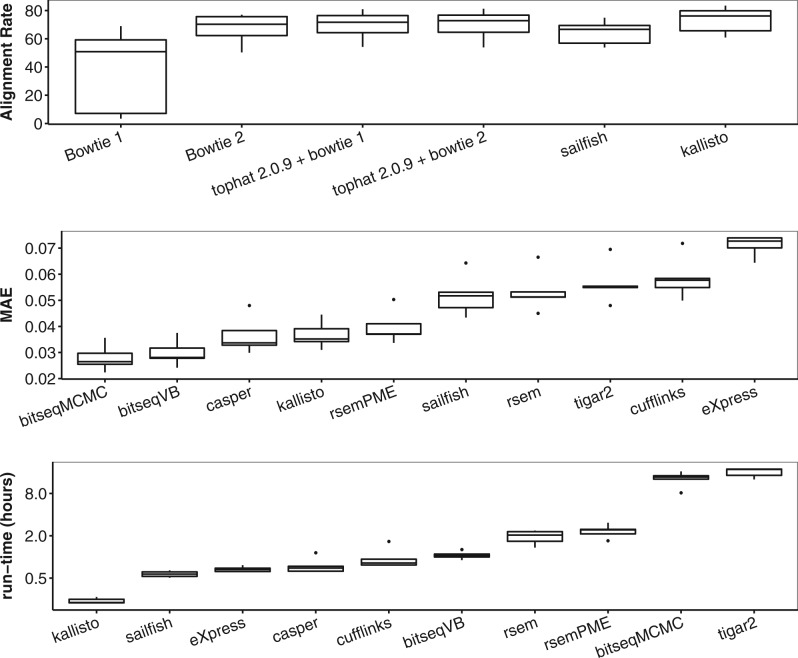
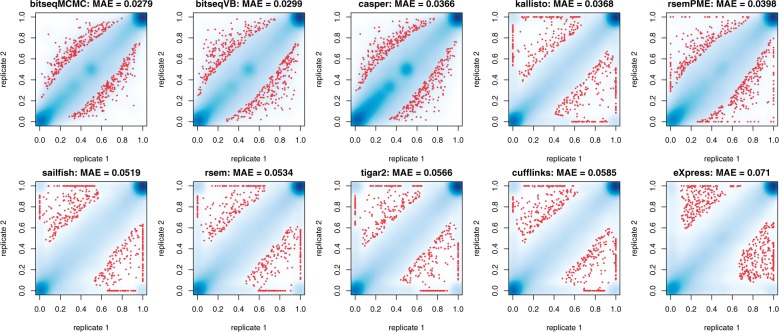
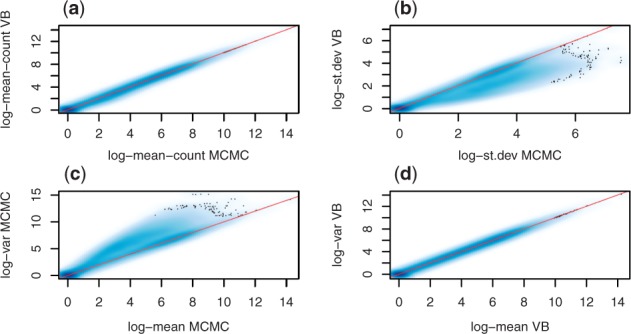
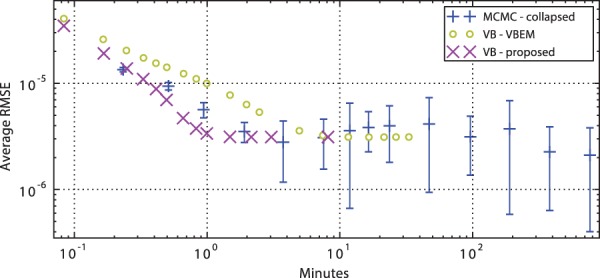
Results: We propose a novel approximate inference scheme based on VB and apply it to an existing model of transcript expression inference from RNA-seq data. Recent advances in VB algorithmics are used to improve the convergence of the algorithm beyond the standard Variational Bayes Expectation Maximization algorithm. We apply our algorithm to simulated and biological datasets, demonstrating a significant increase in speed with only very small loss in accuracy of expression level estimation. We carry out a comparative study against seven popular alternative methods and demonstrate that our new algorithm provides excellent accuracy and inter-replicate consistency while remaining competitive in computation time.
Availability and implementation: The methods were implemented in R and C++, and are available as part of the BitSeq project at github.com/BitSeq. The method is also available through the BitSeq Bioconductor package. The source code to reproduce all simulation results can be accessed via github.com/BitSeq/BitSeqVB_benchmarking.
© The Author 2015. Published by Oxford University Press.
Figures
References
-
- Amari S. (1998) Natural gradient works efficiently in learning. Neural Comput., 10, 251–276.
-
- Bishop C. (2006) Pattern Recognition and Machine Learning. Springer, New York, NY.
-
- Bray N., et al. (2015) Near-optimal RNA-Seq quantification. arXiv (q-bio.QM), arXiv:1505.02710v2.
-
- Gelman A., et al. (2003) Bayesian Data Analysis. 2nd edn Chapman & Hall, CRC Press LLC, Florida, US, Texts in Statistical Science.
Publication types
MeSH terms
Grants and funding
LinkOut - more resources
Full Text Sources
Other Literature Sources
