. 2015 Aug 27;4(9):e002183.
doi: 10.1161/JAHA.115.002183.

Intracellular Na+ Concentration ([Na+]i) Is Elevated in Diabetic Hearts Due to Enhanced Na+-Glucose Cotransport

Affiliations

Intracellular Na+ Concentration ([Na+]i) Is Elevated in Diabetic Hearts Due to Enhanced Na+-Glucose Cotransport

Rebekah Lambert et al. J Am Heart Assoc. .

Abstract

Background: Intracellular Na(+) concentration ([Na(+)]i) regulates Ca(2+) cycling, contractility, metabolism, and electrical stability of the heart. [Na(+)]i is elevated in heart failure, leading to arrhythmias and oxidative stress. We hypothesized that myocyte [Na(+)]i is also increased in type 2 diabetes (T2D) due to enhanced activity of the Na(+)-glucose cotransporter.

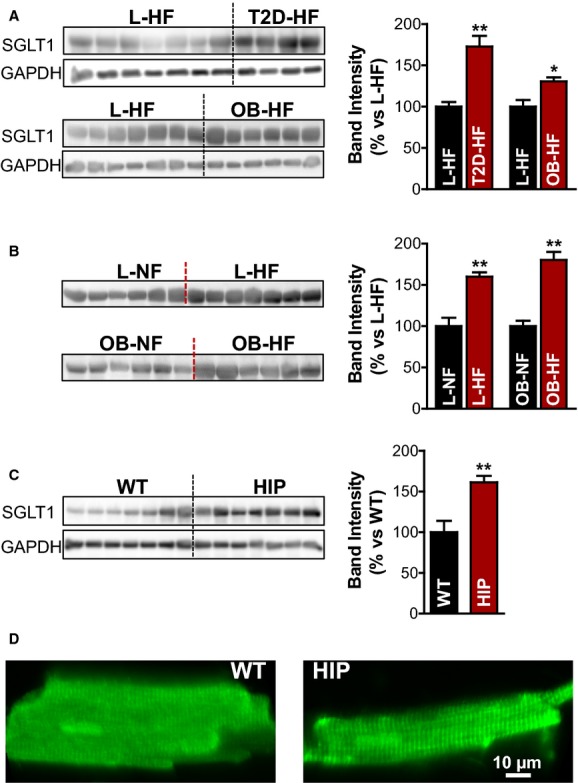
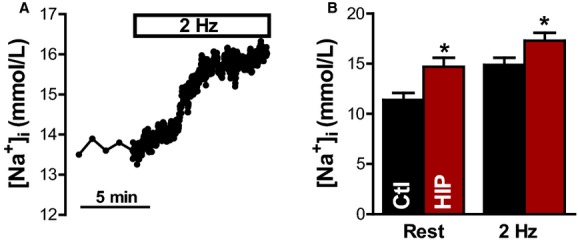
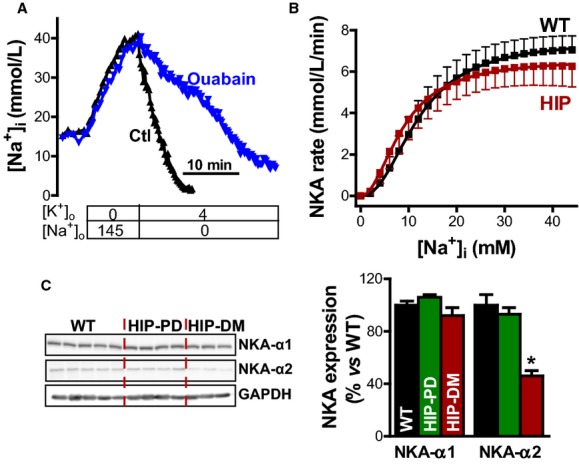
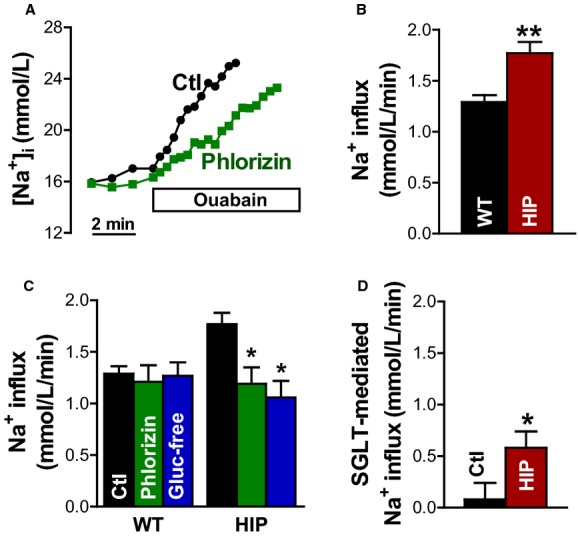
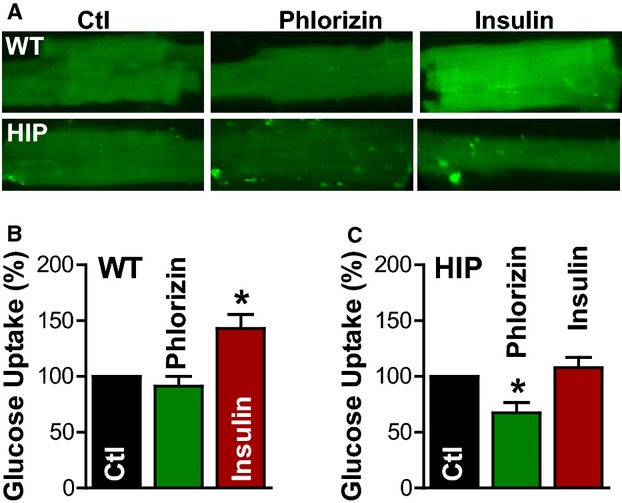
Methods and results: To test this hypothesis, we used myocardial tissue from humans with T2D and a rat model of late-onset T2D (HIP rat). Western blot analysis showed increased Na(+)-glucose cotransporter expression in failing hearts from T2D patients compared with nondiabetic persons (by 73±13%) and in HIP rat hearts versus wild-type (WT) littermates (by 61±8%). [Na(+)]i was elevated in HIP rat myocytes both at rest (14.7±0.9 versus 11.4±0.7 mmol/L in WT) and during electrical stimulation (17.3±0.8 versus 15.0±0.7 mmol/L); however, the Na(+)/K(+)-pump function was similar in HIP and WT cells, suggesting that higher [Na(+)]i is due to enhanced Na(+) entry in diabetic hearts. Indeed, Na(+) influx was significantly larger in myocytes from HIP versus WT rats (1.77±0.11 versus 1.29±0.06 mmol/L per minute). Na(+)-glucose cotransporter inhibition with phlorizin or glucose-free solution greatly reduced Na(+) influx in HIP myocytes (to 1.20±0.16 mmol/L per minute), whereas it had no effect in WT cells. Phlorizin also significantly decreased glucose uptake in HIP myocytes (by 33±9%) but not in WT, indicating an increased reliance on the Na(+)-glucose cotransporter for glucose uptake in T2D hearts.

Conclusions: Myocyte Na(+)-glucose cotransport is enhanced in T2D, which increases Na(+) influx and causes Na(+) overload. Higher [Na(+)]i may contribute to arrhythmogenesis and oxidative stress in diabetic hearts.

Keywords: Na+–glucose cotransporter; heart; intracellular Na+ concentration; type 2 diabetes.


Figures

Figure 1
Figure 1
Increased SGLT1 protein expression in hearts from humans and rats with T2D. A, Western blots with an anti-SGLT1 antibody in homogenates of failing hearts from patients with T2D (T2D-HF group; 4 hearts) or obese (OB-HF group; 6 hearts) vs lean participants (L-HF group; 7 hearts). GAPDH was used as loading control, and experiments were repeated 4 times. Bar graph in the right panel shows the relative band intensity. B, SGLT1 expression in homogenates from failing vs nonfailing human hearts from lean (top) and obese (bottom) participants. C, Western blots with an anti-SGLT1 antibody in diabetic HIP vs WT heart homogenates. D, Representative immunofluorescence images of rat (WT and HIP) myocytes labeled with an anti-SGLT1 antibody. In both cases, SGLT1 is localized at the T-tubules. HF indicates heart failure; HIP, model of late-onset T2D; L, lean; NF, nonfailing heart; OB, obese; SGLT, Na+-glucose cotransporter; T2D, type 2 diabetes; WT, wild-type. *P<0.05, **P<0.01.
Figure 2
Figure 2
[Na+]i is elevated in myocytes from diabetic HIP rats vs WT. A, Representative example of [Na+]i measurements in a HIP rat myocyte. [Na+]i was first measured at rest, then cells were electrically stimulated at 2 Hz. B, Mean steady-state [Na+]i at rest and during electrical stimulation in myocytes from HIP (9 cells from 5 rats) and WT rats (7 myocytes from 5 animals). Ctl indicates control; HIP, model of late-onset T2D; [Na+]i, intracellular Na+ concentration; WT, wild-type. *P<0.05
Figure 3
Figure 3
Unchanged NKA function in myocytes from diabetic rats. A, Representative example of Na+ extrusion measurements in 2 myocytes from HIP rats. Intact myocytes were Na+ loaded by blocking NKA in K+ free solution, and then external K+ was reintroduced, and [Na+]i decline was measured in the absence (Ctl) or presence (ouabain) of 10 mmol/L ouabain. [Na+]i decline was then numerically differentiated to calculate the rate of Na+ extrusion. B, Rate of NKA-mediated Na+ extrusion as a function of [Na+]i in intact myocytes from HIP and WT rats (9 cells from 5 HIP rats and 6 cells from 5 WT rats). C, Protein expression of the α1 and α2 isoforms of the NKA in hearts from WT rats and HIP rats in the prediabetic (HIP-PD; nonfasting blood glucose in the 150 to 200 mg/dL range) and fully diabetic (HIP-DM; blood glucose >400 mg/dL for >8 consecutive weeks) groups. NKA indicates Na+/K+ pump; HIP, model of late-onset T2D; [Na+]i, intracellular Na+ concentration; WT, wild-type. *P<0.05
Figure 4
Figure 4
Na+ influx in myocytes from control and diabetic rats. A, Representative example of Na+ influx measurements in resting HIP rat myocytes in the absence (Ctl) and presence of the SGLT inhibitor phlorizin (250 μmol/L). B, Na+ influx calculated as the slope of the initial increase in [Na+]i on blocking the Na+/K+ pump with 10 mmol/L ouabain in myocytes from HIP and WT rats. C, Effect of SGLT inhibition with phlorizin and glucose-free external solution on the rate of Na+ entry in myocytes from WT and diabetic HIP rats. D, SGLT-mediated Na+ influx derived by subtracting the rate of Na+ entry with SGLT blocked from the total Na+ influx. Mean of >7 cells from at least 5 rats in each group. HIP indicates model of late-onset T2D; [Na+]i, intracellular Na+ concentration; SGLT, Na+–glucose cotransporter; WT, wild-type. *P<0.05, **P<0.01
Figure 5
Figure 5
Increased SGLT-mediated glucose uptake in myocytes from diabetic rats. Glucose uptake was measured using the fluorescent glucose analog 2-NBDG. A, Representative fluorescent images of myocytes incubated with 1 mmol/L 2-NBDG for 30 minutes under control conditions (Ctl), with SGLT blocked by 250 μmol/L phlorizin and in the presence of 50 nmol/L insulin. B and C, Mean fluorescence intensity (relative to the control condition) in myocytes from WT rats (B) and diabetic HIP rats (C); n=6 rats, ≥20 cells/rat for both WT and HIP. HIP indicates model of late-onset T2D; SGLT, Na+–glucose cotransporter; WT, wild-type. *P<0.05

References

    1. Devereux RB, Roman MJ, Paranicas M, O’Grady MJ, Lee ET, Welty TK, Fabsitz RR, Robbins D, Rhoades ER, Howard BV. Impact of diabetes on cardiac structure and function: the Strong Heart Study. Circulation. 2000;101:2271–2276. - PubMed
    1. Taegtmeyer H, McNulty P, Young ME. Adaptation and maladaptation of the heart in diabetes: part I: general concepts. Circulation. 2002;105:1727–1733. - PubMed
    1. Guha A, Harmancey R, Taegtmeyer H. Nonischemic heart failure in diabetes mellitus. Curr Opin Cardiol. 2008;23:241–248. - PMC - PubMed
    1. Young LH, Wackers FJ, Chyun DA, Davey JA, Barrett EJ, Taillefer R, Heller GV, Iskandrian AE, Wittlin SD, Filipchuk N, Ratner RE, Inzucchi SE DIAD Investigators. Cardiac outcomes after screening for asymptomatic coronary artery disease in patients with type 2 diabetes: the DIAD study: a randomized controlled trial. JAMA. 2009;301:1547–1555. - PMC - PubMed
    1. Boudina S, Abel ED. Diabetic cardiomyopathy, causes and effects. Rev Endocr Metab Disord. 2010;11:31–39. - PMC - PubMed

Publication types

MeSH terms