. 2015 Nov;88(5):894-910.
doi: 10.1124/mol.115.099960. Epub 2015 Aug 27.

Selectivity in the Use of Gi/o Proteins Is Determined by the DRF Motif in CXCR6 and Is Cell-Type Specific

Affiliations

Selectivity in the Use of Gi/o Proteins Is Determined by the DRF Motif in CXCR6 and Is Cell-Type Specific

Satya P Singh et al. Mol Pharmacol. 2015 Nov.

Abstract

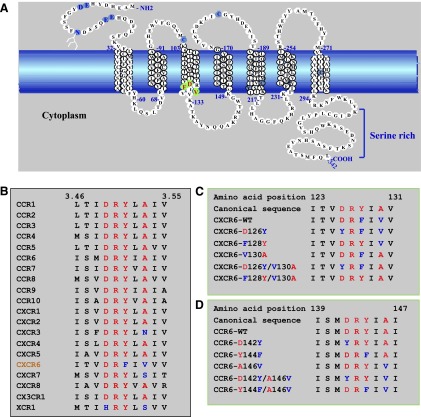
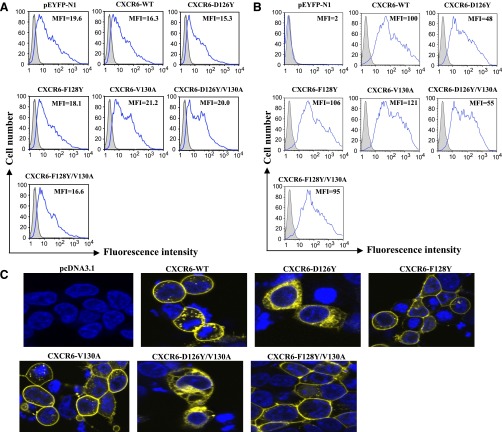
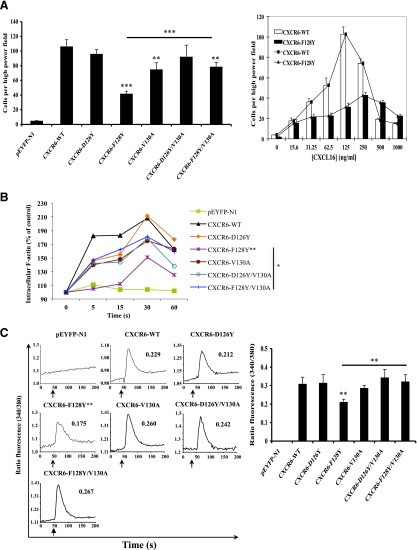
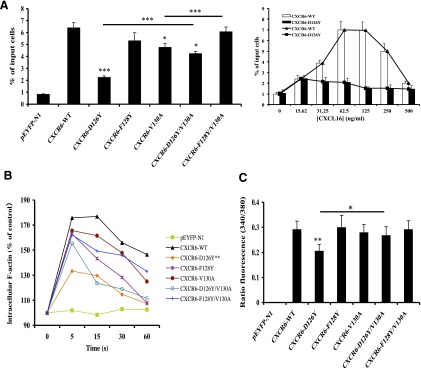
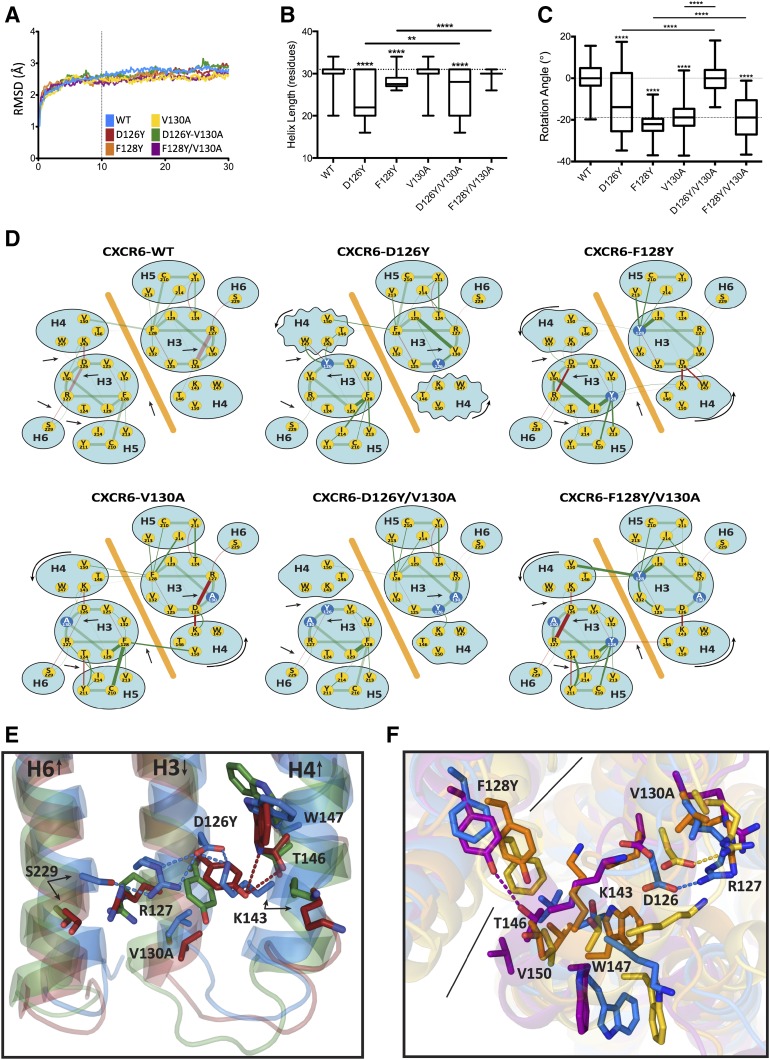
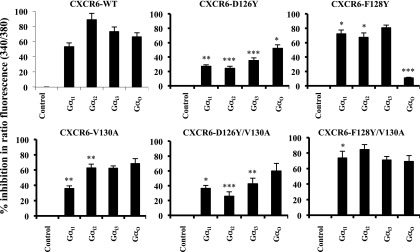
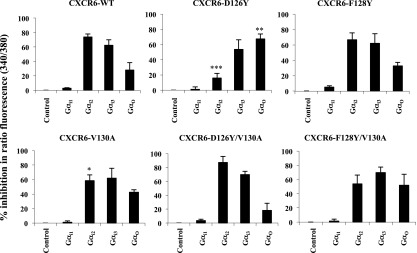
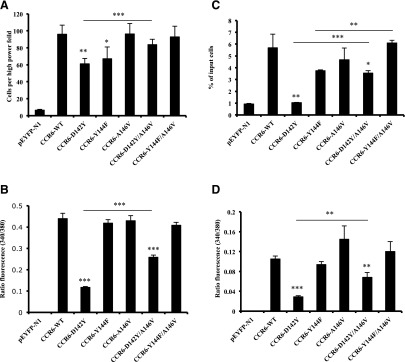
CXCR6, the receptor for CXCL16, is expressed on multiple cell types and can be a coreceptor for human immunodeficiency virus 1. Except for CXCR6, all human chemokine receptors contain the D(3.49)R(3.50)Y(3.51) sequence, and all but two contain A(3.53) at the cytoplasmic terminus of the third transmembrane helix (H3C), a region within class A G protein-coupled receptors that contacts G proteins. In CXCR6, H3C contains D(3.49)R(3.50)F(3.51)I(3.52)V(3.53) at positions 126-130. We investigated the importance and interdependence of the canonical D126 and the noncanonical F128 and V130 in CXCR6 by mutating D126 to Y, F128 to Y, and V130 to A singly and in combination. For comparison, we mutated the analogous positions D142, Y144, and A146 to Y, F, and V, respectively, in CCR6, a related receptor containing the canonical sequences. Mutants were analyzed in both human embryonic kidney 293T and Jurkat E6-1 cells. Our data show that for CXCR6 and/or CCR6, mutations in H3C can affect both receptor signaling and chemokine binding; noncanonical H3C sequences are functionally linked, with dual changes mitigating the effects of single mutations; mutations in H3C that compromise receptor activity show selective defects in the use of individual Gi/o proteins; and the effects of mutations in H3C on receptor function and selectivity in Gi/o protein use can be cell-type specific. Our findings indicate that the ability of CXCR6 to make promiscuous use of the available Gi/o proteins is exquisitely dependent on sequences within the H3C and suggest that the native sequence allows for preservation of this function across different cellular environments.


Figures

Fig. 1.
Fig. 1.
The sequence of CXCR6 has atypical features. (A) Schematic representation of the wild-type CXCR6 receptor. The cell membrane is represented by the blue band. Amino acids in transmembrane α helices are shown in stacked triplets. CXCR6 contains residues, shown in light blue, that are conserved in GPCRs, such as N-linked glycosylation site(s) in the amino-terminal domain (N16 with branched structure), cysteines in extracellular loops one and two (C102 and C180), as well as sequences that are characteristic of chemokine receptors, such as paired acidic residues in the amino-terminal domain (E8 and D9 and E21 and E22), a paired cysteine and tyrosine (C210 and Y211), and a cysteine in helix seven (C282). Residues that we changed by site-directed mutagenesis are indicated in green with red letters. (B) Amino acid sequence alignment of H3C in CXCR6 and other chemokine receptors. Residue numbers 3.46 and 3.55 are according to the convention of Ballesteros and Weinstein (1995) (see text). (C) Sequences of CXCR6 wild type and mutants that we produced and studied. Numbers designate CXCR6 I123 and V131. Canonical residues are red, and noncanonical residues are blue. (D) Sequences of CCR6 wild type and mutants that we produced and studied. Numbers designate CCR6 I139 and I147. Canonical residues are red, and noncanonical residues are blue.
Fig. 2.
Fig. 2.
Replacing D126 with Y leads to redistribution of CXCR6 in HEK-293T cells. Cells were transfected with equal amounts of pcDNA3.1, pEYFP-N1, and DNAs encoding CXCR6-YFP wild-type and mutant receptors. Cells transfected with pcDNA3.1 were incubated with a phycoerythrin-conjugated isotype control antibody, and other cells were incubated with anti-human CXCR6-phycoerythrin. (A) Histograms showing YFP expression for pcDNA3.1 transfected cells (shaded) and cells transfected with pEYFP-N1 or CXCR6 DNAs (nonshaded and outlined in blue). Mean fluorescent intensities (MFIs) of YFP-expressing cells are shown. Data are from one of more than five experiments. (B) Histograms showing CXCR6 surface staining in duplicate panels for the same cells as in (A). Data are from one of more than five experiments. (C) Confocal microscopy of cells transfected with pcDNA3.1 or DNAs encoding CXCR6-YFP wild-type and mutant receptors. The nuclei were stained with Hoechst 33342, shown in blue, and emission from the YFP fusion proteins is shown in yellow. Data are from one of more than five experiments.
Fig. 3.
Fig. 3.
CXCR6-F128Y has impaired activity when expressed in HEK-293T cells. (A) Cells were transfected with equal amounts of DNA encoding wild-type and mutant CXCR6-YFP proteins. Migration was measured using a microchemotaxis chamber with polycarbonate membranes and containing CXCL16 in the lower wells, as described in Materials and Methods. The left panel shows mean ± S.E.M. of data from four experiments. The asterisks indicate a significant difference from HEK-293T cells expressing wild-type receptor and, as indicated by the bar, between CXCR6-F128Y and CXCR6-F128Y/V130A mutants. The right panel shows mean ± S.E.M. for chemotaxis using various concentrations of CXCL16 from three experiments using cells expressing wild-type or CXCR6-F128Y receptors. (B) Cells transfected as in (A) were fixed and stained with Alexa Fluor 488 phalloidin-paraformaldehyde at the indicated time points after stimulation with 2.5 μg/ml CXCL16, as described in Materials and Methods. All results are plotted relative to the mean fluorescence intensity of the sample without the addition of CXCL16, which was set at 100% and plotted at 0 seconds. The data shown are from one of three experiments. Mean responses at each time point were calculated from the three experiments, and the asterisks indicate significant differences between the curves for F128Y versus wild-type receptors and, as indicated by the bar, for the mutants F128Y versus F128Y/V130A. (C) Cells were transfected with variable amounts of DNAs encoding wild-type and mutant CXCR6-YFP proteins to produce equal surface expression. In the experiment shown in the left panel, cells were loaded with Fura-2/AM and assayed for intracellular calcium mobilization on a spectrofluorometer in response to 1 μg/ml CXCL16 added at the times indicated by the arrows, as described in Materials and Methods. The numbers in each panel show peak changes in the fluorescence ratios. This experiment is representative of four. Mean peak responses were calculated from the four experiments, and the asterisks indicate significant differences between F128Y versus wild-type receptors and, as indicated by the bar, the mutants F128Y versus F128Y/V130A (right panel). *P < 0.05; **P < 0.01; ***P < 0.001.
Fig. 4.
Fig. 4.
CXCR6-D126Y has impaired activity when expressed in Jurkat E6-1 cells. (A) Cells were transfected with variable amounts of DNAs encoding wild-type and mutant CXCR6-YFP receptors to produce equal surface expression. In each experiment, the means were obtained for the percentage of input cells migrating to duplicate wells of a Transwell plate, as described in Materials and Methods. The left panel shows mean ± S.E.M. of data from three experiments. The asterisks indicate a significant difference from Jurkat E6-1 cells expressing the wild-type receptor or between the cells connected by the horizontal bars. The right panel shows mean ± S.E.M. of data from three experiments using cells transfected with wild-type CXCR6 DNA or CXCR6-D126Y DNA and lower wells containing various concentrations of CXCL16. (B) Cells transfected with equal amounts of DNA encoding wild-type and mutant CXCR6-YFP proteins were fixed and stained with Alexa Fluor 488 phalloidin-paraformaldehyde at the indicated times after stimulation with 2.5 μg/ml CXCL16, as described in Materials and Methods. All results are plotted relative to the mean fluorescence intensity of the cells without the addition of CXCL16, which was set at 100% and plotted at 0 seconds. The mean responses at each time point were calculated from the three experiments, and the asterisks indicate significant differences between the curves for D126Y versus wild-type receptors. (C) Cells transfected as in (A) were loaded with Fura-2/AM and assayed for intracellular calcium mobilization on a spectrofluorometer in response to 1 μg/ml CXCL16, as described in Materials and Methods. Mean peak responses ± S.E.M. were calculated from five experiments, and the asterisks indicate significant differences between D126Y versus wild-type receptors and, as indicated by the bar, mutants D126Y versus D126Y/V130A. *P < 0.05; **P < 0.01; ***P < 0.001.
Fig. 5.
Fig. 5.
Molecular models of CXCR6. (A) C-α root-mean-square deviations (RMSDs) are shown versus simulation time. (B) The median length of helix four is shown for wild-type (WT) and mutant receptors. Boxes depict upper and lower inner quartiles. Whiskers indicate maximum and minimum values. (C) Median rotation of helix four is shown for WT and mutant receptors. Boxes depict upper and lower inner quartiles. Whiskers indicate maximum and minimum values. (D) Abstract networks diagram of molecular interactions are shown for CXCR6 wild-type and mutant receptors. An orange diagonal line separates the protomers. Hydrogen bonds are red, and neighboring interactions are green. The width of the line connecting the nodes is proportional to the frequency with which the interaction is observed in the molecular dynamic simulation (analogous to the strength of the interaction). Dark red and green lines indicate significant (P < 0.001) deviation in frequency from the wild type, either increased or decreased as reflected in the lines’ widths. Mutant residues are shown as blue nodes. Arrows indicate patterns of variation. Jagged ellipses indicate fraying of helix four from (B). Curved arrows show the rotation of helix four from (C). (E) The illustration of helix four shortening is shown for CXCR6 wild-type and mutant receptors using averaged structures. The ribbon figures overlay “averaged” structures from each simulation. Lipid and solvent molecules are not shown for clarity. Some helices are omitted, and a single protomer is shown for clarity. Wild-type CXCR6 is blue, the CXCR6-D126Y mutant is red, and the CXCR6-D126Y/V130A mutant is green. Dotted lines indicate hydrogen bonds. (F) An illustration of helix four rotation is shown for CXCR6 wild-type and mutant receptors using averaged structures. The ribbon figures overlay “averaged” structures from each simulation. Some helices are omitted, and no lipid or solvent molecules are shown for clarity. Wild-type CXCR6 is blue, the CXCR6-V130A mutant is yellow, the CXCR6-F128Y mutant is orange, and the CXCR6-F128Y/V130A mutant is purple. Dotted lines indicate hydrogen bonds. Solid black lines separate protomers. The asterisks in (B) and (C) indicate a significant difference from wild type or between the groups connected by the horizontal bars. **P < 0.01; ****P < 0.0001.
Fig. 6.
Fig. 6.
Selective use of Gi/o proteins by CXCR6 mutants in HEK-293T cells. (A) Cells cotransfected with equal amounts of CXCR6-WT or mutant plasmids and indicated siRNAs were harvested 72 hours later, loaded with Fura-2/AM, and assayed for intracellular calcium mobilization on a spectrofluorometer in response to 1 μg/ml CXCL16, as described in Materials and Methods. Using cells expressing each receptor, the percentage inhibition of peak ratio fluorescence by siRNAs knocking down individual Gα proteins as compared with cells transfected with control siRNAs was calculated. The mean ± S.E.M. from three independent experiments is shown. The asterisks indicate a significant difference from cells expressing the wild-type receptor. *P < 0.05; **P < 0.01; ***P < 0.001.
Fig. 7.
Fig. 7.
Selective use of Gi/o proteins by CXCR6 mutants in Jurkat E6-1 cells. Cells cotransfected with equal amounts of CXCR6-WT or mutant plasmids and the indicated siRNAs were harvested 72 hours later, loaded with Fura-2/AM, and assayed for intracellular calcium mobilization on a spectrofluorometer in response to 1 μg/ml CXCL16, as described in Materials and Methods. Using cells expressing each receptor, the percentage inhibition of peak ratio fluorescence by siRNAs knocking down individual Gα proteins as compared with cells transfected with control siRNAs were calculated. The mean ± S.E.M. from three independent experiments is shown. The asterisks indicate a significant difference from cells expressing the wild-type receptor. *P < 0.05; **P < 0.01; ***P < 0.001.
Fig. 8.
Fig. 8.
Changing canonical to noncanonical amino acids diminishes CCR6 activity in HEK-293T and Jurkat E6-1 cells. (A) HEK-293T cells were transfected with variable amounts of DNAs encoding wild-type and mutant CCR6-YFP receptors to produce equal surface expression. Migration was measured using a microchemotaxis chamber containing CCL20 in the lower wells, as described in Materials and Methods. The data shown are the mean ± S.E.M. from four experiments. The asterisks indicate a significant difference from HEK-293T cells expressing the wild-type receptor and, as indicated by the bar, between cells expressing CCR6-D142Y and CCR6-D142Y/A146V. (B) Cells transfected as in (A) were loaded with Fura-2/AM and assayed for intracellular calcium mobilization on a spectrofluorometer in response to 1 μg/ml CCL20, as described in Materials and Methods. The data shown are the mean ± S.E.M. of three experiments. The asterisks indicate a significant difference from cells expressing the wild-type receptor and, as indicated by the bar, between cells expressing CCR6-D142Y and CCR6-D142Y/A146V. (C) Jurkat E6-1 cells were transfected with variable amounts of DNAs encoding wild-type and mutant CCR6-YFP receptors to produce equal surface expression. In each experiment, the means were obtained for the percentage of input cells migrating to duplicate lower wells of a Transwell plate, as described in Materials and Methods. The data shown are the mean ± S.E.M. from three experiments. The asterisks indicate a significant difference from Jurkat E6-1 cells expressing the wild-type receptor or between the cells connected by the horizontal bars. (D) Cells transfected as in (C) were loaded with Fura-2/AM and assayed for intracellular calcium mobilization on a spectrofluorometer in response to 1 μg/ml CCL20, as described in Materials and Methods. The data shown are the mean ± S.E.M. of three experiments. The asterisks indicate a significant difference from cells expressing the wild-type receptor or, as indicated by the bar, between cells expressing CCR6-D142Y and CCR6-D142Y/A146V. *P < 0.05; **P < 0.01; ***P < 0.001.

Similar articles

Cited by

References

    1. Acharya S, Saad Y, Karnik SS. (1997) Transducin-alpha C-terminal peptide binding site consists of C-D and E-F loops of rhodopsin. J Biol Chem 272:6519–6524. - PubMed
    1. Alkhatib G, Liao F, Berger EA, Farber JM, Peden KW. (1997) A new SIV co-receptor, STRL33. Nature 388:238. - PubMed
    1. Arai H, Charo IF. (1996) Differential regulation of G-protein-mediated signaling by chemokine receptors. J Biol Chem 271:21814–21819. - PubMed
    1. Auger GA, Pease JE, Shen X, Xanthou G, Barker MD. (2002) Alanine scanning mutagenesis of CCR3 reveals that the three intracellular loops are essential for functional receptor expression. Eur J Immunol 32:1052–1058. - PubMed
    1. Bachelerie F, Ben-Baruch A, Burkhardt AM, Combadiere C, Farber JM, Graham GJ, Horuk R, Sparre-Ulrich AH, Locati M, Luster AD, et al. (2013) International Union of Pharmacology. LXXXIX. Update on the extended family of chemokine receptors and introducing a new nomenclature for atypical chemokine receptors. Pharmacol Rev 66:1–79. - PMC - PubMed

Publication types

LinkOut - more resources