. 2015 Aug 28;11(8):e1004426.
doi: 10.1371/journal.pcbi.1004426. eCollection 2015 Aug.

Discovery of Drug Synergies in Gastric Cancer Cells Predicted by Logical Modeling

Affiliations

Discovery of Drug Synergies in Gastric Cancer Cells Predicted by Logical Modeling

Åsmund Flobak et al. PLoS Comput Biol. .

Abstract

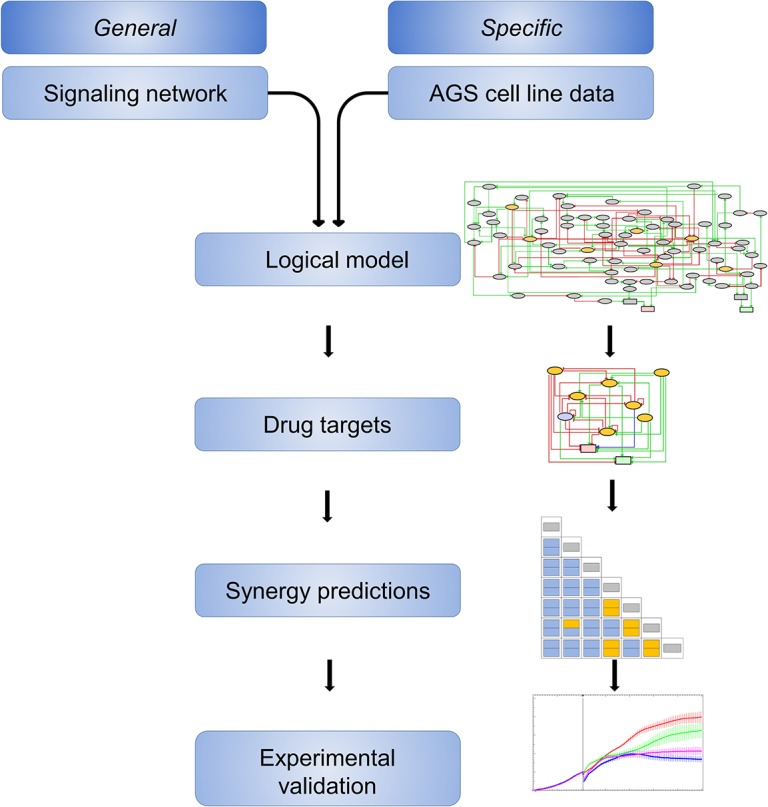
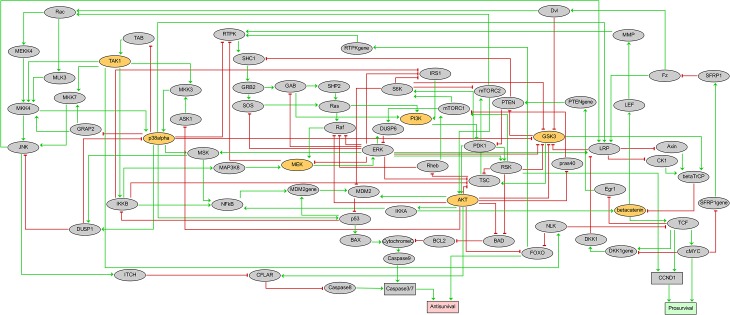
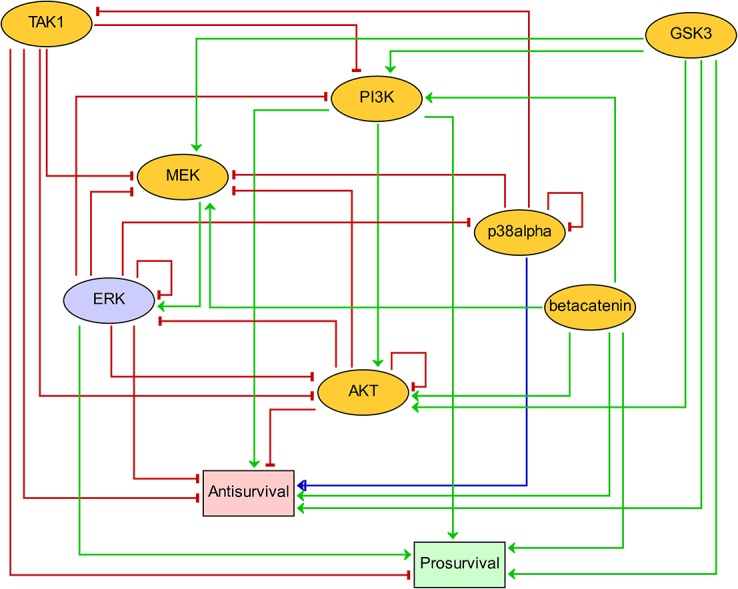
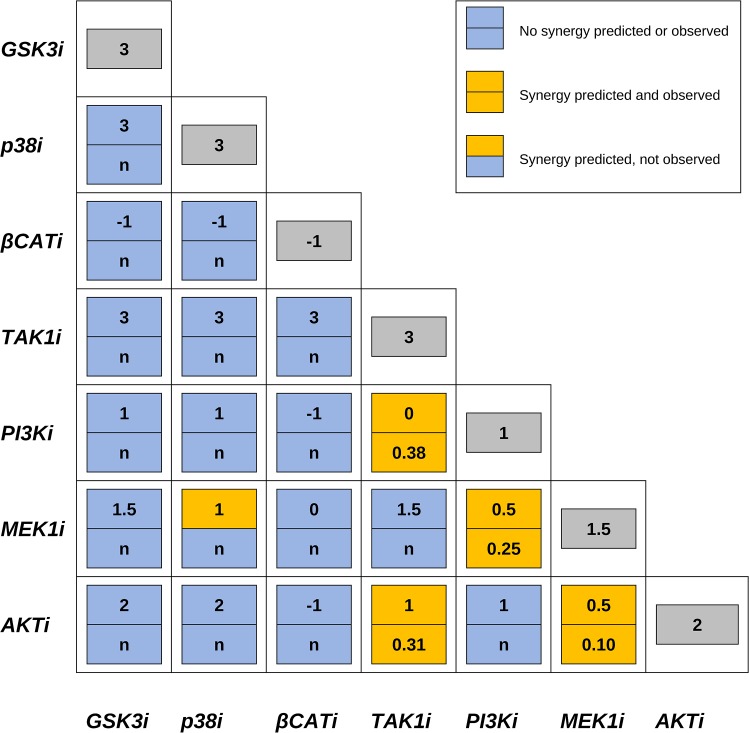
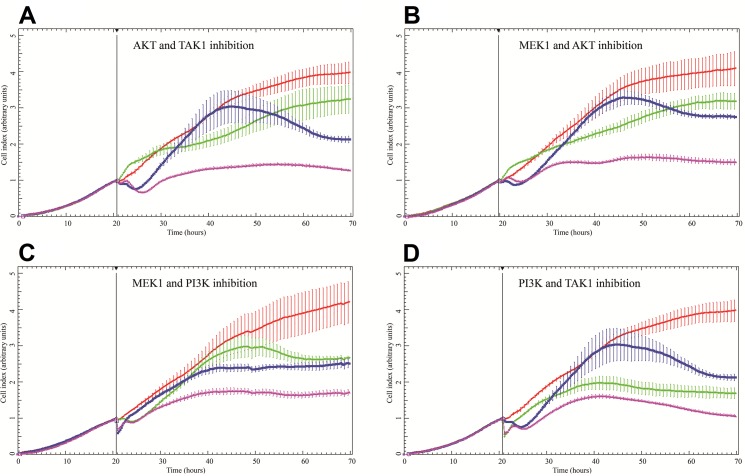
Discovery of efficient anti-cancer drug combinations is a major challenge, since experimental testing of all possible combinations is clearly impossible. Recent efforts to computationally predict drug combination responses retain this experimental search space, as model definitions typically rely on extensive drug perturbation data. We developed a dynamical model representing a cell fate decision network in the AGS gastric cancer cell line, relying on background knowledge extracted from literature and databases. We defined a set of logical equations recapitulating AGS data observed in cells in their baseline proliferative state. Using the modeling software GINsim, model reduction and simulation compression techniques were applied to cope with the vast state space of large logical models and enable simulations of pairwise applications of specific signaling inhibitory chemical substances. Our simulations predicted synergistic growth inhibitory action of five combinations from a total of 21 possible pairs. Four of the predicted synergies were confirmed in AGS cell growth real-time assays, including known effects of combined MEK-AKT or MEK-PI3K inhibitions, along with novel synergistic effects of combined TAK1-AKT or TAK1-PI3K inhibitions. Our strategy reduces the dependence on a priori drug perturbation experimentation for well-characterized signaling networks, by demonstrating that a model predictive of combinatorial drug effects can be inferred from background knowledge on unperturbed and proliferating cancer cells. Our modeling approach can thus contribute to preclinical discovery of efficient anticancer drug combinations, and thereby to development of strategies to tailor treatment to individual cancer patients.


Conflict of interest statement

The authors have declared that no competing interests exist.

Figures

Fig 1
Fig 1. Workflow of model construction and synergy prediction followed by experimental validation.
We started with a signaling network built from general database and literature knowledge (upper left), which was refined with published experimental data on protein activities in AGS cells (upper right) to generate the logical model. Next, we generated a formally reduced version of the logical model, focusing on the drug target nodes and valid for systematic simulations of combinatorial inhibitions. Predicted synergies were challenged with observations from AGS cell growth experiments. Cartoons on the right refer to each of the Figs 2–5 further down.
Fig 2
Fig 2. Prior knowledge network representing the cell fate decision network governing growth of AGS gastric adenocarcinoma cells.
The network receives no external input but encompasses two outputs Antisurvival and Prosurvival (phenotypic readouts, colored in red for Antisurvival and green for Prosurvival). Activating regulations are denoted by green arrows, while red T arrows denote inhibition. Signaling component nodes (proteins, protein complexes or genes) associated with Boolean variables (taking the values 0, 1) are represented by ellipses, while rectangles depict nodes encoded with multilevel variables. Yellow nodes represent drug targets and are subjected to inhibitory perturbations during simulations.
Fig 3
Fig 3. Reduced logical model obtained by semi-automated reduction of the comprehensive logical model shown in Fig 2.
The reduced model encompasses all seven drug targets (yellow) and the two phenotypic outputs (red for Antisurvival and green for Prosurvival). In addition the ERK node (blue) had to be preserved to maintain dynamical consistency with the large model. Activating regulations are denoted by green arrows, while red T arrows denote inhibition. The blue arc with both arrow and T head (p38alpha to Antisurvival) indicates a dual regulation, i.e. activating and inhibiting, depending on context. In some contexts p38alpha inhibition will increase Antisurvival, while in others p38alpha inhibition will decrease Antisurvival (see S1 Text, S7 and S8 Tables). Note that after model reduction two members of the Wnt/β-catenin pathway, β-catenin and GSK3, became non-regulated and fixed at either the on-state (β-catenin) or off-state (GSK3).
Fig 4
Fig 4. Effects of combined inhibitors on cell growth.
Synergistic (yellow) and non-synergistic (blue) combinations are shown both as predicted by model simulations (upper panel of boxes, value of model parameter “growth”) and as verified by cell growth experiments (lower panel of boxes; combinatorial indexes (synergy indicated by CI < 1) or “n” when non-synergy was observed).Synergy was proposed whenever the predicted growth for a combination of inhibitors was lower than the modeled effect of single drug perturbations, shown in the outer diagonal (grey, value of model parameter “growth”).
Fig 5
Fig 5. Experimentally confirmed synergies, where the effect of combining two inhibitors at half GI50 concentrations (violet) outperforms each of the single inhibitor at the full GI50 concentration.
A) AKT inhibitor (green) and TAK1 inhibitor (blue). B) MEK inhibitor (blue) and AKT inhibitor (green). C) MEK inhibitor (green) and PI3K inhibitor (blue). D) PI3K inhibitor (green) and TAK1 inhibitor (blue). Cells growing in the absence of inhibitors are shown in red. One standard deviation is indicated by error bars. Inhibitors (and concentrations) used: MEK inhibitor PD0325901 (35 nM), TAK1 inhibitor (5Z)-7-oxozeaenol (0.5 μM), PI3K inhibitor PI103 (0.7 μM) and AKT inhibitor AKTi-1,2 (10 μM). See Materials and Methods and S1 Text for all growth curves of combinations of inhibitors, and dose-response curves of individual inhibitors.

References

    1. Hanahan D, Weinberg R a. Hallmarks of cancer: the next generation. Cell. Elsevier Inc.; 2011;144: 646–74. 10.1016/j.cell.2011.02.013 - DOI - PubMed
    1. Al-Lazikani B, Banerji U, Workman P. Combinatorial drug therapy for cancer in the post-genomic era. Nat Biotechnol. Nature Publishing Group; 2012;30: 679–92. 10.1038/nbt.2284 - DOI - PubMed
    1. Creixell P, Schoof EM, Erler JT, Linding R. Navigating cancer network attractors for tumor-specific therapy. Nat Biotechnol. 2012;30: 842–8. 10.1038/nbt.2345 - DOI - PubMed
    1. Crystal AS, Shaw AT, Sequist L V, Friboulet L, Niederst MJ, Lockerman EL, et al. Patient-derived models of acquired resistance can identify effective drug combinations for cancer. Science. 2014; 1–12. 10.1126/science.1254721 - DOI - PMC - PubMed
    1. Borisy A a, Elliott PJ, Hurst NW, Lee MS, Lehar J, Price ER, et al. Systematic discovery of multicomponent therapeutics. Proc Natl Acad Sci U S A. 2003;100: 7977–82. 10.1073/pnas.1337088100 - DOI - PMC - PubMed

Publication types

Substances