. 2015 Aug 28;11(8):e1005436.
doi: 10.1371/journal.pgen.1005436. eCollection 2015 Aug.

Dominance of Deleterious Alleles Controls the Response to a Population Bottleneck

Affiliations

Dominance of Deleterious Alleles Controls the Response to a Population Bottleneck

Daniel J Balick et al. PLoS Genet. .

Abstract

Population bottlenecks followed by re-expansions have been common throughout history of many populations. The response of alleles under selection to such demographic perturbations has been a subject of great interest in population genetics. On the basis of theoretical analysis and computer simulations, we suggest that this response qualitatively depends on dominance. The number of dominant or additive deleterious alleles per haploid genome is expected to be slightly increased following the bottleneck and re-expansion. In contrast, the number of completely or partially recessive alleles should be sharply reduced. Changes of population size expose differences between recessive and additive selection, potentially providing insight into the prevalence of dominance in natural populations. Specifically, we use a simple statistic, [Formula: see text], where xi represents the derived allele frequency, to compare the number of mutations in different populations, and detail its functional dependence on the strength of selection and the intensity of the population bottleneck. We also provide empirical evidence showing that gene sets associated with autosomal recessive disease in humans may have a BR indicative of recessive selection. Together, these theoretical predictions and empirical observations show that complex demographic history may facilitate rather than impede inference of parameters of natural selection.


Conflict of interest statement

The authors have declared that no competing interests exist.

Figures
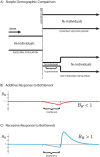
Fig 1
Fig 1. Response of the B R statistic for additive and recessive variation.
A schematic representation of two populations is presented above (A). Initially a single population prior to the bottleneck event, the populations split and have distinct demographic profiles. The equilibrium population maintains a constant size for easy comparison to the founded population. The latter drastically reduces its population size to N B for a short time T B during the founder’s event. Our statistical comparison between populations BR=xeqxfounded is represented here for cases of purely additive (B) and purely recessive (C) variation. The statistic B R > 1 for recessive variation (dominance coefficient h = 0) and B R < 1 for additive variation (h = 1/2), providing a simple indicator for the primary mode of selection of polymorphic alleles in the populations.
Fig 2
Fig 2. Time dependence of the B R statistic after re-expansion.
The time dependence of B R(t) after a population bottleneck is shown for for alleles under recessive selection (h = 0) for various selection strengths. Peak B R values vary in both magnitude and time as a function of s. The founded population was simulated with 2N 0 = 20000, 2N B = 2000, and T B = 200 and plotted for 5000 generations after re-expansion.
Fig 3
Fig 3. The B R statistic at the time of observation.
ABOVE: At the time of observation t obs, the value of B R(t obs) is plotted as a function of the average strength of selection s and dominance coefficient h. Dominance coefficients appear as solid lines with fully recessive selection (h = 0) at the top and purely additive selection (h=12) at the bottom. For strong selection B R → 1 due to the rapid transient response. For weak selection B R → 1 due to the nearly neutral insensitivity to the bottleneck. For some intermediate dominance coefficient h c, a critical value occurs (h c ∼ 0.25 in the example shown, but explored more generally in S1 Text) where additive and recessive effects cancel, yielding B R(h c) ∼ 1. A low intensity bottleneck (I B = 0.05) is shown, with parameters 2N 0 = 20000, 2N B = 2000, T B = 100, and t obs = 1000. BELOW: The same range of parameters is plotted for a realistic demographic model of the Out of Africa event comparing Africans and Europeans [48], where B R = 〈xAfrican/〈xEuropean. The European bottleneck has estimated intensity I B ∼ 𝒪(0.5), an order of magnitude stronger than the simple bottleneck above, allowing for potentially observable deviations from B R ∼ 1 if a large fraction of analyzed variants act recessively with h < h c ∼ 0.25.
Fig 4
Fig 4. Comparisons of analytic and simulation results.
Maximum response values of the burden ratio B R(t min) are plotted for recessive selection as a function of bottleneck intensity. A wide range of parameter sets is plotted with all combinations of 2N B = {2000,1000,400,200,100}, s = {0.1,0.02,0.01,0.001}, T B = {200,100,50,20,10}, each simulated for 108 nucleotide sites. For relatively low intensity bottlenecks we note excellent agreement over the parameter ranges plotted. Intensities with I B = T B/2N B > 0.1 are excluded, as the single-generation bottleneck scaling breaks down in favor of a long bottleneck scaling. The approximation necessarily weakens for simulations that represent longer bottlenecks, and only for strong selective coefficients, as expected. This quantifies the limitations of the single-generation bottleneck approximation, as we observe substantial deviation only around I B = 0.1 and with selection strength s = 0.1.

References

    1. Eyre-Walker A and Keightley PD (2007) The distribution of fitness effects of new mutations. Nat. Rev. Genet. 8:610–618. 10.1038/nrg2146 - DOI - PubMed
    1. Sella G, et al. (2009) Pervasive Natural Selection in the Drosophila Genome? PLoS Genet 5: e1000495 10.1371/journal.pgen.1000495 - DOI - PMC - PubMed
    1. Cutter AD and Payseur BA (2013) Genomic signatures of selection at linked sites: unifying the disparity among species. Nat. Rev. Genet. 14:262–74. 10.1038/nrg3425 - DOI - PMC - PubMed
    1. Mukai T (1972) Mutation rate and dominance of genes affecting viability in Drosophila Melanogaster. Genetics 72:335–355. - PMC - PubMed
    1. Garcia-Dorado A and Caballero A (2000) On the average coefficient of dominance of deleterious spontaneous mutations. Genetics 155:1991–2001. - PMC - PubMed

Publication types

LinkOut - more resources