. 2015 Aug 28;11(8):e1004433.
doi: 10.1371/journal.pcbi.1004433. eCollection 2015 Aug.

Analysis of Single Locus Trajectories for Extracting In Vivo Chromatin Tethering Interactions

Affiliations

Analysis of Single Locus Trajectories for Extracting In Vivo Chromatin Tethering Interactions

Assaf Amitai et al. PLoS Comput Biol. .

Abstract

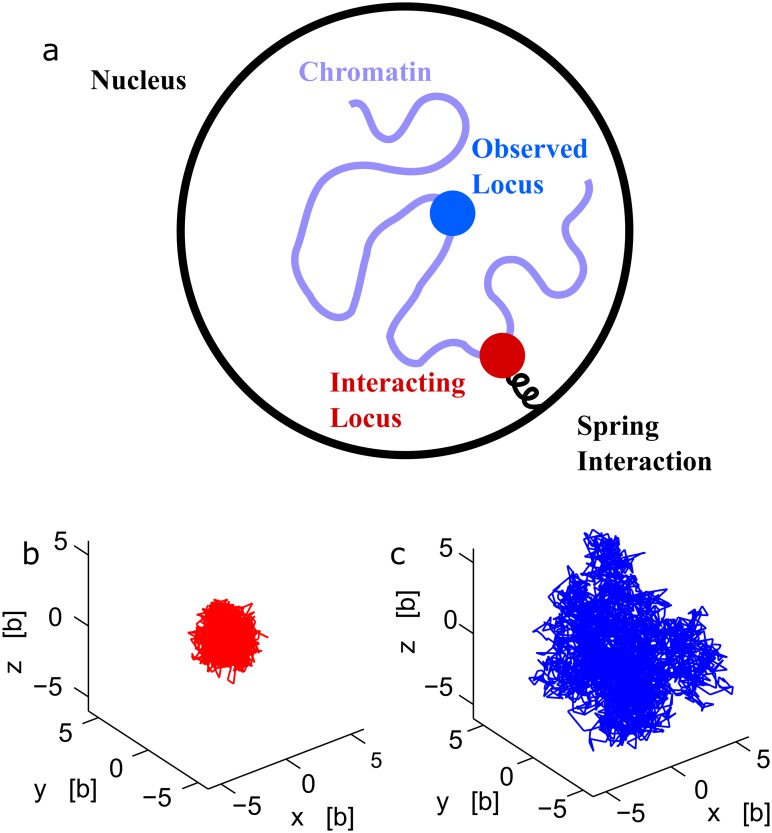
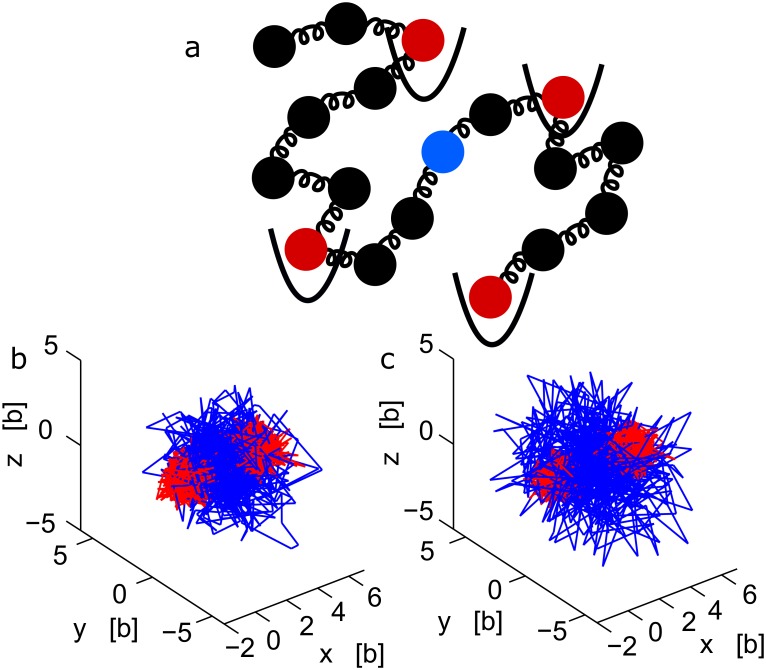
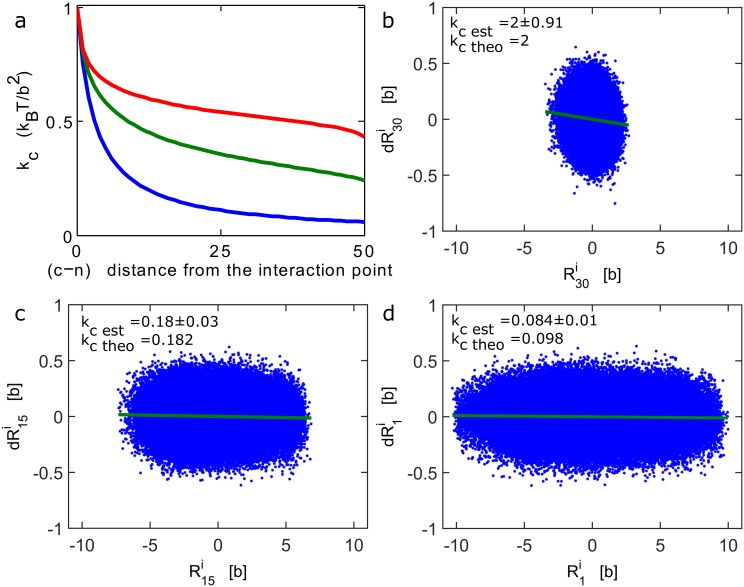
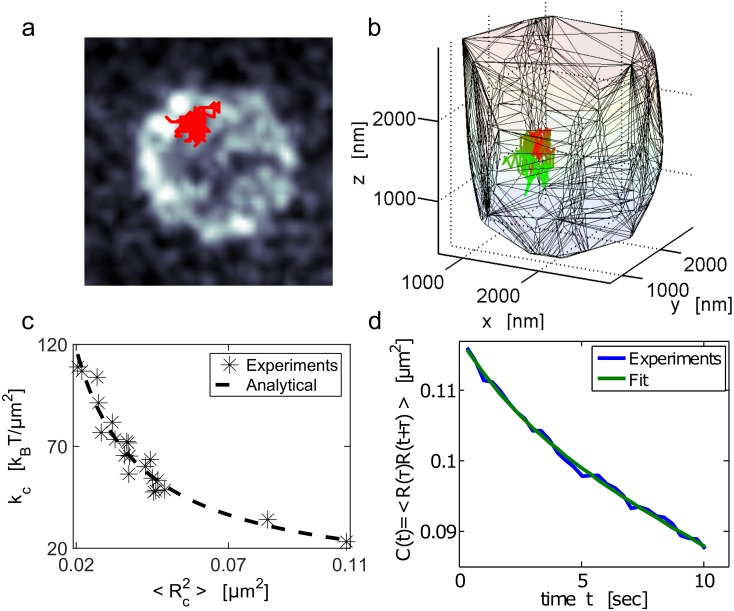
Is it possible to extract tethering forces applied on chromatin from the statistics of a single locus trajectories imaged in vivo? Chromatin fragments interact with many partners such as the nuclear membrane, other chromosomes or nuclear bodies, but the resulting forces cannot be directly measured in vivo. However, they impact chromatin dynamics and should be reflected in particular in the motion of a single locus. We present here a method based on polymer models and statistics of single trajectories to extract the force characteristics and in particular when they are generated by the gradient of a quadratic potential well. Using numerical simulations of a Rouse polymer and live cell imaging of the MAT-locus located on the yeast Saccharomyces cerevisiae chromosome III, we recover the amplitude and the distance between the observed and the interacting monomer. To conclude, the confined trajectories we observed in vivo reflect local interaction on chromatin.


Conflict of interest statement

The authors have declared that no competing interests exist.

Figures

Fig 1
Fig 1. A polymer interacting with multiple potential wells.
(a) Schematic representation of a polymer, where some monomers (red) interact with fixed harmonic potential wells, while monomer c (blue) is observed. (b-c) Stochastic trajectories of three monomers, part of a polymer, where the two extremities interact with two potential wells fixed at the origin and at position μ = (5b, 0, 0) respectively. The middle monomer trajectory (blue) is more extended than the two others, as shown for a polymer of length N = 21 (b) and N = 41 (c).
Fig 2
Fig 2. Dynamics of interacting versus observed locus.
(a) Schematic representation of the nucleus, where one locus is observed and followed with a florescent label while another (non-visible) chromatin locus is interacting with another nuclear element. (b-c) Stochastic trajectories of monomers, part of a polymer (N = 30) where one extremity interacts with a harmonic potential well of strength κ = 2K B T/b 2. When the observed monomer is the interacting monomer (red), the trajectory is well localized (b). When the middle monomer of the polymer is tracked, the trajectory (blue) is more extended (c).
Fig 3
Fig 3. Recovering an external force of an interacting polymer.
(a)Apparent force acting on a tagged monomer. The apparent spring constant k c is computed from formula 11 and 20, for a polymer of length N = 100, where monomer n = 50 interacts with an harmonic potential Eq (6) with k = 2k B T/b 2, while κ = 3k B T/b 2. The constant k c is computed for increasing distances |cn|, between the observed and the interacting monomers for β = 2 (Rouse polymer) (blue), β = 1.5 (green) and β = 1.2 (red). (b-d) Brownian simulations of a Rouse polymer (N = 30), where the first monomer interacts with a harmonic well at the origin (k = 2k B T/b 2). A scatter plot (blue asterisk) of the steps distribution (dRi) against the position for the first monomer (b), middle monomer (c) and end monomer (d). The data clouds are fitted with a linear regression procedure (green line). The apparent spring constant k c Sim is empirically estimated from simulations using Eq (24) and compared with the theoretical value Eq 11 (kcn = /(κ+|c-n|k)). We found k c sim = 2±91, 0.18±0.03, 0.084±0.01 and k cn = 2; 0.182; 0.098 respectively, for b, c, d. In the simulations, Δt = 0.01b 2/D.
Fig 4
Fig 4. Single locus dynamics and mean applied force on the Yeast chromatin.
(a) Trajectory of the chromatin MAT-locus located on chromosome III in the yeast SS. The locus trajectory (red) inside the nucleus is projected on the XY plane. The nuclear membrane (gray scale) was stained with the nup49-mCherry fusion protein. The time resolution is Δt = 0.33 seconds during an acquisition time of approximately 100 seconds. (b) Three-dimensional trajectories: the color codes for time propagation. Initially (t = 0) the trajectory is red and gradually becomes green (t = 100sec). The convex hull is the nuclear envelope reconstruction. (c) Scatter plot of the effective spring coefficient k c and the variance (Rc2) of the locus trajectory estimated in two-dimensions, extracted for 21 cells. The constant k c is estimated using formula Eq (24), fitted to a power law, kc=aRc2b, with a = 3.03 ± 1.05 k B T and b = 0.94 ± 0.1. (d) Auto-correlation function computed using formula Eq (28) for the trajectory shown in a. The fit uses the sum of two exponentials: C(t)=a1et/τ1+a2et/τ2, with τ 1 = 45.7 ± 0.005s and τ 2 = 2.4 ± 0.35 s, a 1 = 109 ± 5 × 10⁻³ μm 2, a 2 = 8.38 ± 4.94 × 10⁻³ μm 2.

References

    1. Kepten E., Bronshtein I. and Garini Y., Phys. Rev. E 83, 041919 (2011). - PubMed
    1. Wong H., Marie-Nelly H., Herbert S., Carrivain P., Blanc H., Koszul R., Fabre E. and Zimmer C., Curr. Biol. 22, 1881–1890 (2012). 10.1016/j.cub.2012.06.055 - DOI - PubMed
    1. Tokuda N., Terada T. P. and Sasai M., Biophys J 102, 296–304 (2012). 10.1016/j.bpj.2011.12.005 - DOI - PMC - PubMed
    1. Doi M. and Edwards S. F., The Theory of Polymer Dynamics (Clarendon Press, Oxford, 1986).
    1. Sokolov I. M., Phys. Rev. Lett. 90, 080601 (2003). 10.1103/PhysRevLett.90.080601 - DOI - PubMed

MeSH terms

LinkOut - more resources