. 2015 Aug 28;10(8):e0136702.
doi: 10.1371/journal.pone.0136702. eCollection 2015.

14-3-3 Proteins Buffer Intracellular Calcium Sensing Receptors to Constrain Signaling

Affiliations

14-3-3 Proteins Buffer Intracellular Calcium Sensing Receptors to Constrain Signaling

Michael P Grant et al. PLoS One. .

Abstract

Calcium sensing receptors (CaSR) interact with 14-3-3 binding proteins at a carboxyl terminal arginine-rich motif. Mutations identified in patients with familial hypocalciuric hypercalcemia, autosomal dominant hypocalcemia, pancreatitis or idiopathic epilepsy support the functional importance of this motif. We combined total internal reflection fluorescence microscopy and biochemical approaches to determine the mechanism of 14-3-3 protein regulation of CaSR signaling. Loss of 14-3-3 binding caused increased basal CaSR signaling and plasma membrane levels, and a significantly larger signaling-evoked increase in plasma membrane receptors. Block of core glycosylation with tunicamycin demonstrated that changes in plasma membrane CaSR levels were due to differences in exocytic rate. Western blotting to quantify time-dependent changes in maturation of expressed wt CaSR and a 14-3-3 protein binding-defective mutant demonstrated that signaling increases synthesis to maintain constant levels of the immaturely and maturely glycosylated forms. CaSR thus operates by a feed-forward mechanism, whereby signaling not only induces anterograde trafficking of nascent receptors but also increases biosynthesis to maintain steady state levels of net cellular CaSR. Overall, these studies suggest that 14-3-3 binding at the carboxyl terminus provides an important buffering mechanism to increase the intracellular pool of CaSR available for signaling-evoked trafficking, but attenuates trafficking to control the dynamic range of responses to extracellular calcium.


Conflict of interest statement

Competing Interests: The authors have declared that no competing interests exist.

Figures

Fig 1
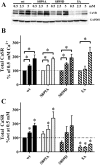
Fig 1. Effect of extracellular Ca2+ on net cellular CaSR protein.
A. HEK293 cells expressing FLAG-wt or 14-3-3 binding mutants as indicated were cultured for 24 hrs (during the period from 48–72 hrs after transfection) in DMEM containing 0.5, 2.5 or 5 mM extracellular Ca2+ plus 0.1% BSA. Western blots were probed with anti-CaSR and GAPDH antibodies. B.–C. Quantitation of data as in A. for n = 4 independent experiments, analyzed by one-way ANOVA followed by Dunnett’s multiple comparisons test, with significance at p < 0.05. Data in B. were normalized to expression of each CaSR variant in 0.5 mM Ca2+, indicated by dotted line. In C. the same data were normalized to total expression of wt CaSR at 0.5 mM Ca2+, indicated by dot-dashed line.
Fig 2
Fig 2. Impact of 14-3-3 protein binding on CaSR-mediated Ca2+ signaling responses.
A.–D. Intracellular Ca2+ was assessed by wide-field imaging of Fura Red fluorescence in HEK293 cells expressing BS-wt (A.), BS-S899A (B.), BS-S899D (C.) or BS-5A (D.). Each cell is plotted separately with gray scale lines (n = 4 cells). Representative of 3 independent experiments.
Fig 3
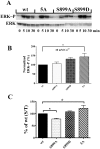
Fig 3. Impact of 14-3-3 protein binding on MAPK signaling of CaSR.
A. HEK293 cells expressing FLAG-wt, S899A, S899D, or 5A mutants treated with 0.5 (0 time) or 10 mM Ca2+ for 5, 10 and 30 min at 37°C. Western blot of lysates were probed with anti-phospho-ERK1/2, then stripped and probed with total ERK antibodies. B. Quantitation of ERK1/2 phosphorylation for experiments as in A., for cells treated with 10 mM Ca2+ for 10 min. Data were corrected for responses in 0.5 mM, then normalized to responses of wt CaSR (n = 7–10 independent experiments; average ± S.E.M.; analyzed by one-way ANOVA followed by Dunnett’s multiple comparisons test, with significance at *p< 0.05 relative to wt-CaSR). C. Net and plasma membrane CaSR were measured by ELISA assay in HEK293 cells expressing BS-wt or 14-3-3 protein binding mutants, as described in Methods. Data are plotted as the percent of surface/total for wt CaSR (% of wt (S/T)) (average ± S.D., n = 4–6 independent experiments; analyzed by one-way ANOVA followed by Dunnett’s multiple comparisons test, with significance at *p< 0.05 relative to wt-CaSR).
Fig 4
Fig 4. TIRFM responses to prolonged stimulation with 10 mM Ca2+.
A. HEK293 cells expressing BS-wt were stimulated with 10 mM Ca2+ in the absence (closed circles) or presence of tunicamycin (open circles) for 30 min, followed by return to 0.5 mM Ca2+. Plasma membrane SEP fluorescence was monitored throughout the time course by TIRFM as described in Methods. Data are average ± S.D. of 4 cells. B. Experiment as in A for cells expressing BS-5A mutant. Data are average ± S.D. of 4 cells. C. Cells expressing BS-wt were stimulated with 0.5 or 10 mM Ca2+ for 60 min, 37°C, followed by fixation, permeabilization, and staining with anti-GFP antibody (secondary antibody tagged with Alexa-568). Confocal images of SEP and anti-GFP fluorescence are shown along with the merged image. D. Experiment as in C for cells expressing BS-5A mutant.
Fig 5
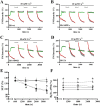
Fig 5. Repeated measures of BgTx-A594 labeling during prolonged stimulation with 10 mM Ca2+.
Cells expressing BS-wt (A.), BS-S899A (B.), BS-S899D (C.), or BS-5A (D.) were labeled with BgTx-A594 prior to imaging, and then imaging was begun in 0.5 mM Ca2+. Stimulation with 10 mM Ca2+ (indicated by bar) was initiated. Imaging was halted periodically (indicated by brackets) for labeling with BgTx-A594, then resumed. Plotted are the averages ± S.D. of SEP (green) and BgTx-A594 (red) fluorescence for n = 4 cells, representative of 3 independent experiments. E. Averaged SEP fluorescence just prior to each BgTx-A594 labeling period for cells illustrated in A–D is plotted. BS-wt (closed circles), BS-S899A (open circles) are drawn with solid lines, while mutants which do not bind 14-3-3 proteins are drawn with dotted lines (BS-S899D (open squares), BS-5A (open triangles)). F. Peak BgTx-A594 after each labeling period in 10 mM Ca2+, with symbols and statistical analysis as in E. For E. and F., data were analyzed using one-way ANOVA followed by Dunnett’s multiple comparisons test, with significance at *p < 0.05 relative to BS-wt CaSR at the same time point.
Fig 6
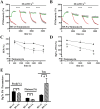
Fig 6. Tunicamycin reduces SEP and BgTx-A594 responses of BS-wt and BS-5A.
A.–B. Cells expressing BS-wt (A.) or BS-5A (B.) were labeled with BgTx-A594 in 0.5 mM Ca2+, then recording of SEP and BgTx-A594 fluorescence at the plasma membrane was begun using TIRFM. Imaging was interrupted periodically (indicated by brackets) for relabeling with BgTx-A594 during stimulation with 10 mM Ca2+ (indicated by bar). Cells were exposed to 5 μg/ml tunicamycin for 60 min prior to imaging and throughout the experiment. Plotted are the averages ± S.D. of SEP (green) and BgTx-A594 (red) fluorescence of n = 4 cells, representative of 3 independent experiments. C. Averaged SEP fluorescence just prior to each BgTx-A594 labeling period for cells illustrated in A.–B. are plotted. BS-wt (closed circles), and BS-5A (open triangles), for n = 4 cells, plotted as average ± S.D. D. Peak BgTx-A594 after each labeling period in 10 mM Ca2+. Symbols as described in C. For C. and D., data were analyzed using one-way ANOVA followed by Dunnett’s multiple comparisons test, with significance at *p < 0.05 relative to BS-wt CaSR at the same time point. E. Individual BgTx-A594 responses at 10 mM Ca2+ within each experiment of A–B. were fitted with single exponential decays, and peak, plateau and decay time constants calculated and normalized to the first response for each experiment. Normalized fit parameters for BgTx-A594 responses in 10 mM Ca2+ for BS-wt (black bars) and BS-5A (hatched bars) are plotted. BS-5A responses were significantly different from BS-wt (analyzed by paired t-test, significance at *p< 0.05 relative to BS-wt).
Fig 7
Fig 7. Net cellular CaSR levels show correlates of the ADIS response.
A. Western blot of HEK293 cells expressing FLAG-CaSR or FLAG-CaSR-5A, treated for indicated times with DMSO (vehicle)/0.5 mM Ca2+, 5 μg/ml tunicamycin/0.5 mM Ca2+ (long thin bar) or tunicamycin/5 mM Ca2+ (short, bracketed thick bars). Cells were lysed at the indicated times and processed for western blotting as indicated in Methods. B. Quantitation of the 120, 140 and 160 kDa bands over the experimental time course for 5–7 experiments as in A. for wt CaSR. DMSO (black circles, solid line), tunicamycin (black squares, dotted line), and tunicamycin plus Ca2+ (black triangles, dashed line) are plotted. C. Quantitation of the 120, 140 and 160 kDa bands over the experimental time course for 5–7 experiments as in A for the 5A mutant. Control (black circles, solid line), tunicamycin (black squares, dotted line), and tunicamycin plus Ca2+ (black triangles, dashed line) are plotted. For B. and C., * indicates significant difference from DMSO (p<0.05); # indicates a significant difference between tunicamycin/0.5 mM Ca2+ and tunicamycin/5 mM Ca2+ (p<0.05).

Similar articles

Cited by

References

    1. Tfelt-Hansen J, Brown E M. The calcium-sensing receptor in normal physiology and pathophysiology: a review. Crit. Rev. Clin. Lab. Sci. 2005; 42: 35–70. - PubMed
    1. Brown EM. Role of the calcium-sensing receptor in extracellular calcium homeostasis. Best Pract. Res. Clin. Endocrinol. Metab. 2013; 27: 333–343. 10.1016/j.beem.2013.02.006 - DOI - PubMed
    1. Chakravarti B, Chattopadhyay N, Brown EM. Signaling through the extracellular calcium-sensing receptor (CaSR). Adv. Exp. Med. Biol. 2012; 740: 103–142. 10.1007/978-94-007-2888-2_5 - DOI - PubMed
    1. Conigrave AD,Ward DT. Calcium-sensing receptor (CaSR): pharmacological properties and signaling pathways. Best Pract. Res. Clin. Endocrinol. Metab. 2013; 27; 315–331. 10.1016/j.beem.2013.05.010 - DOI - PubMed
    1. Magno AL, Ward BK, Ratajczak T. The calcium-sensing receptor: a molecular perspective. Endocr. Rev. 2011; 32: 3–30. 10.1210/er.2009-0043 - DOI - PubMed

Publication types

LinkOut - more resources