. 2015 Aug 27;162(5):1016-28.
doi: 10.1016/j.cell.2015.07.059.

The Nuclear Pore-Associated TREX-2 Complex Employs Mediator to Regulate Gene Expression

Affiliations

The Nuclear Pore-Associated TREX-2 Complex Employs Mediator to Regulate Gene Expression

Maren Schneider et al. Cell. .

Abstract

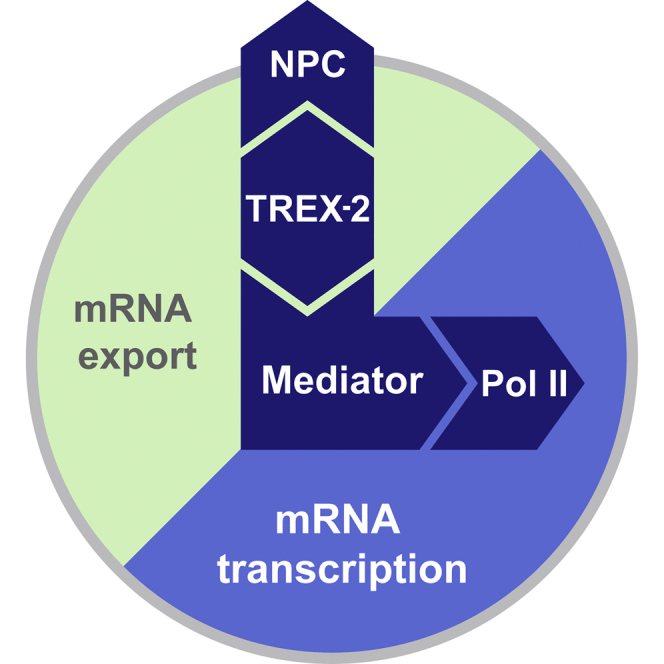
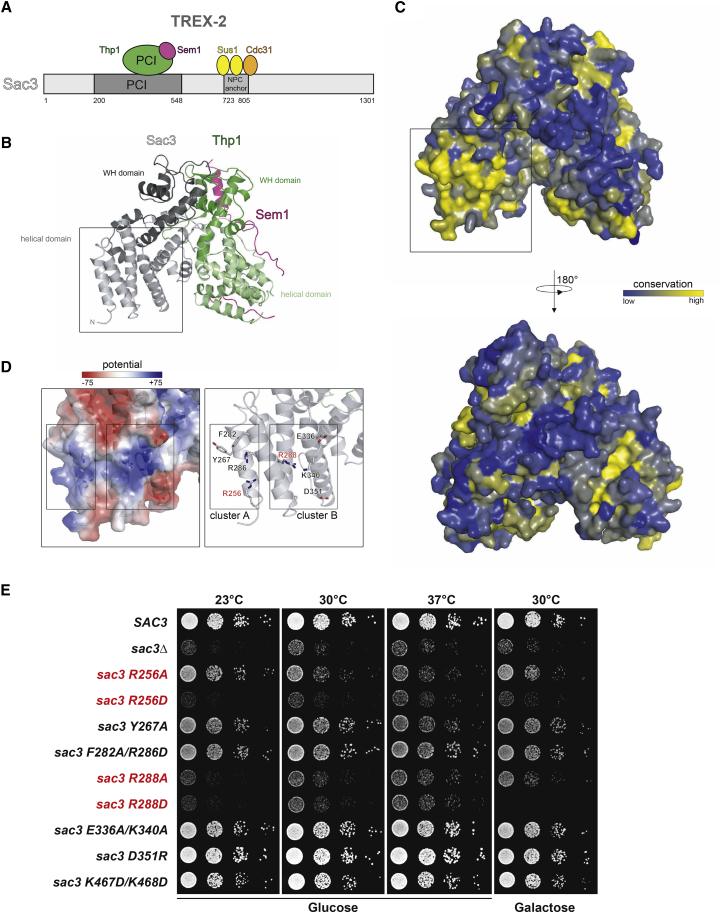
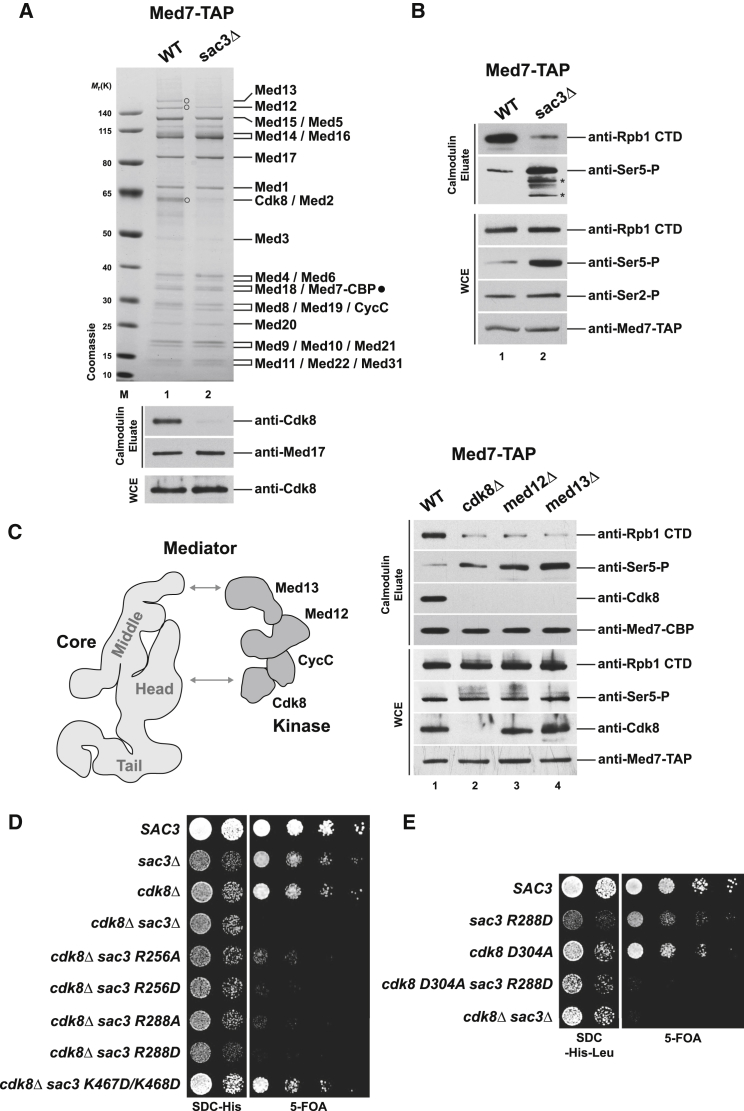
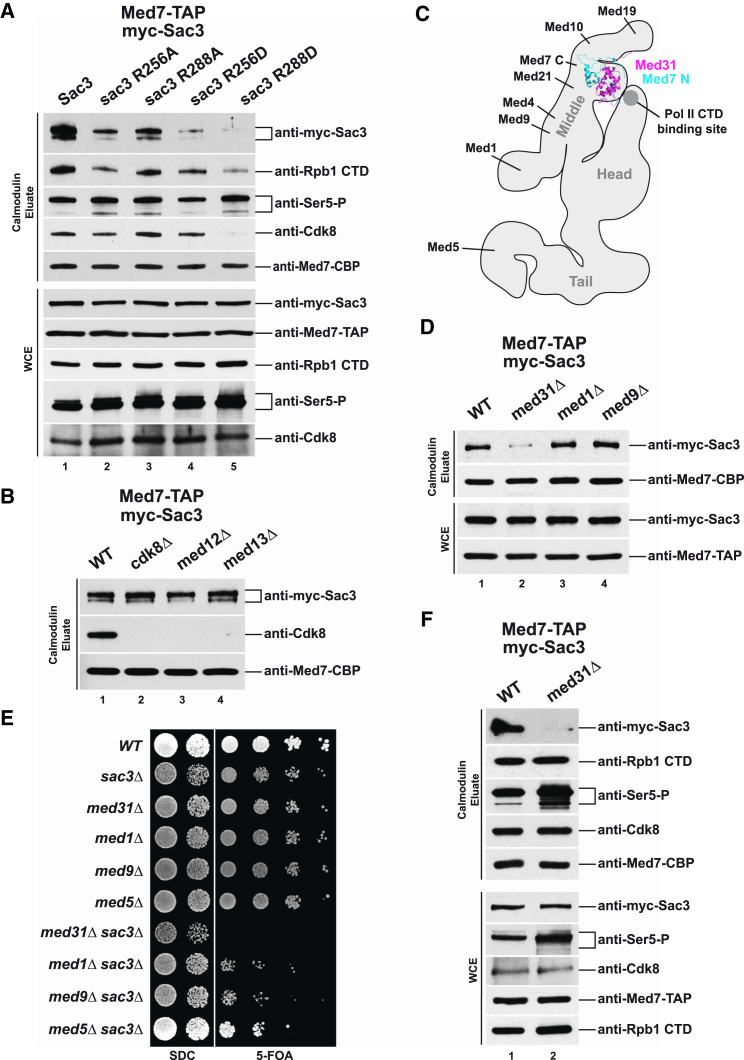
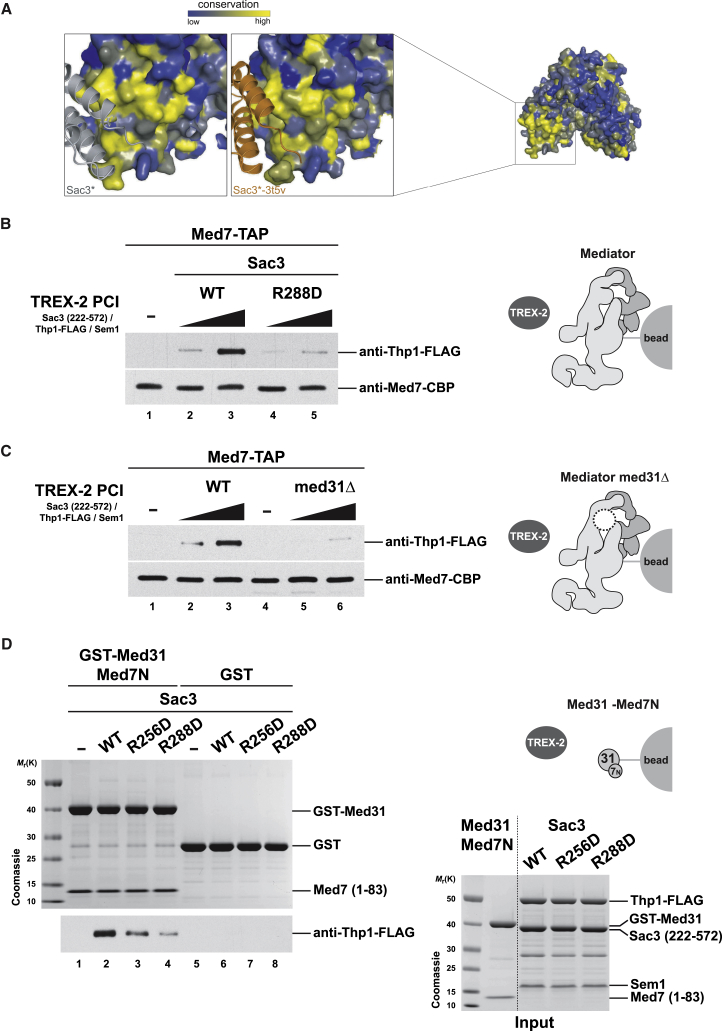
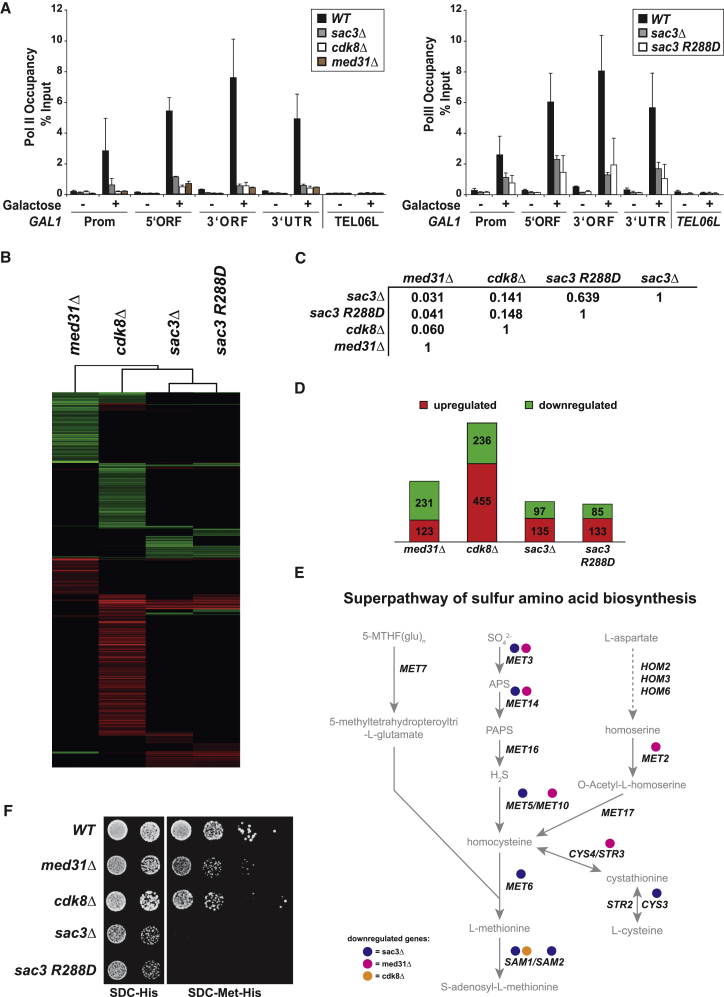
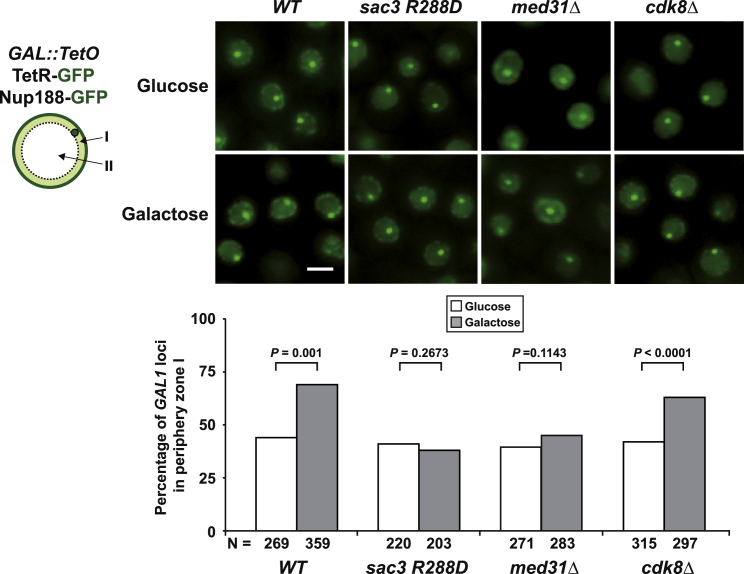
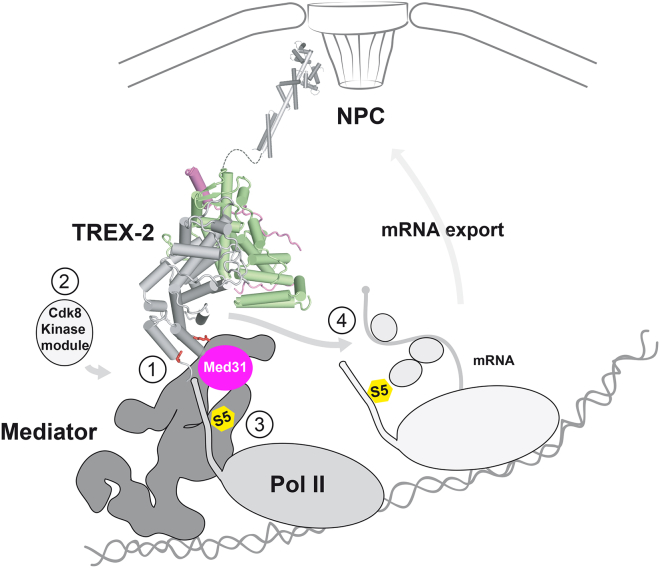
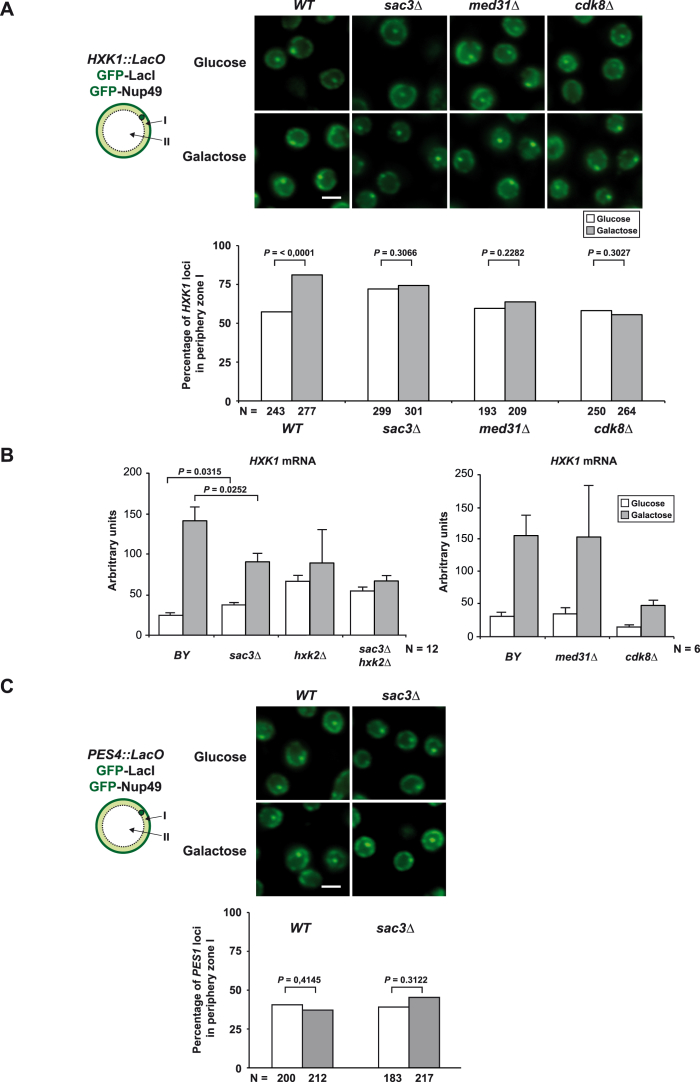
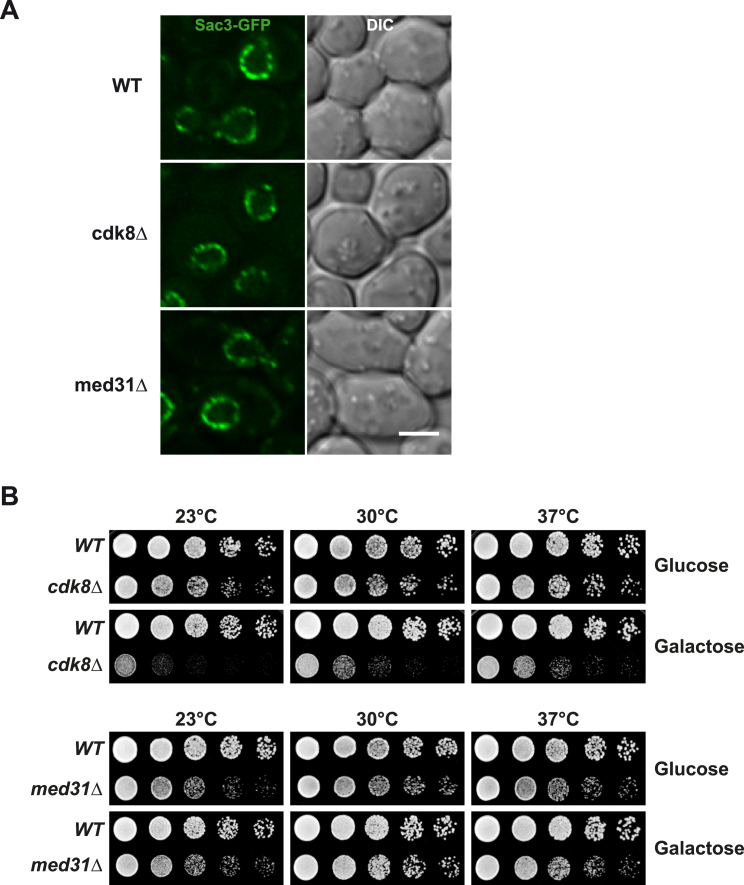
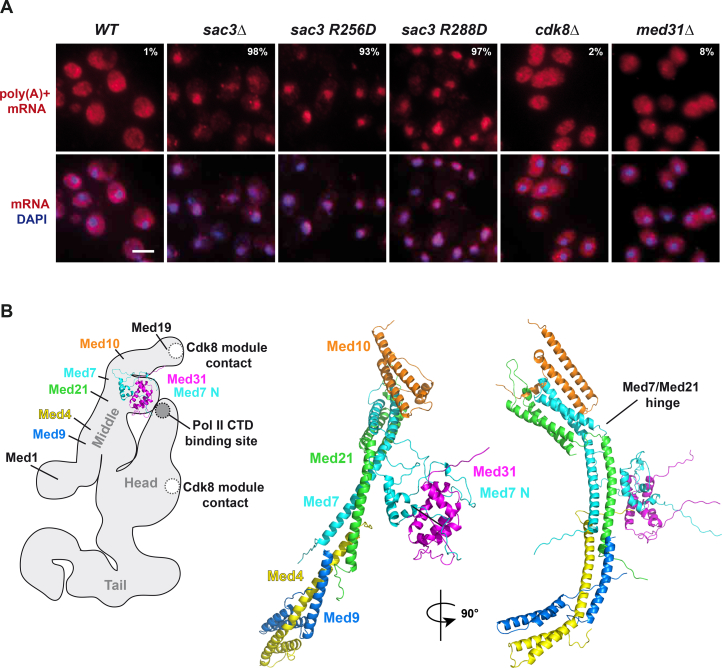
Nuclear pore complexes (NPCs) influence gene expression besides their established function in nuclear transport. The TREX-2 complex localizes to the NPC basket and affects gene-NPC interactions, transcription, and mRNA export. How TREX-2 regulates the gene expression machinery is unknown. Here, we show that TREX-2 interacts with the Mediator complex, an essential regulator of RNA Polymerase (Pol) II. Structural and biochemical studies identify a conserved region on TREX-2, which directly binds the Mediator Med31/Med7N submodule. TREX-2 regulates assembly of Mediator with the Cdk8 kinase and is required for recruitment and site-specific phosphorylation of Pol II. Transcriptome and phenotypic profiling confirm that TREX-2 and Med31 are functionally interdependent at specific genes. TREX-2 additionally uses its Mediator-interacting surface to regulate mRNA export suggesting a mechanism for coupling transcription initiation and early steps of mRNA processing. Our data provide mechanistic insight into how an NPC-associated adaptor complex accesses the core transcription machinery.


Figures

None
Graphical abstract
Figure 1
Figure 1
A Functionally Conserved Region on the TREX-2 PCI Domain (A) Cartoon of the yeast TREX-2 domain organization. Sac3 domain boundaries are drawn to scale. (B) Ribbon representation of the TREX-2 PCI domain complex with Sac3, Thp1 and Sem1 shown in gray, green, and magenta, respectively. The PCI domains of Thp1 and Sac3 consist of stacks of helical repeats each capped by a C-terminal winged-helix (WH) domain. Sem1 adopts an extended conformation, which grasps around and stabilizes the loosely packed protein scaffold of Thp1. Boxed region marks the N-terminal pole of the “atypical” Sac3 PCI domain. (C) Front and back view of the complex showing its surface conservation. Conservation scores of the individual residues are represented by color gradients from blue (no conservation) to yellow (100% conservation). Scores were calculated based on multiple sequence alignments (see also Figure S1A). Boxed region corresponds to (B). (D) The insets show helices α1–α4 of the Sac3 PCI domain and correspond to the boxed regions in (B) and (C). Electrostatic surface potential and ribbon representation highlight two clusters (A and B) of positively charged residues. R256 and R288 (labeled in red) are located in the center of cluster A and B, respectively. Residues analyzed in mutational studies are shown in stick mode. (E) Growth analysis of wild-type SAC3 and mutant strains on medium prepared with glucose or galactose. The sac3Δ strain was transformed with wild-type SAC3, empty vector or the indicated mutant sac3 alleles under the endogenous SAC3 promoter. The sac3 R256 and R288 mutants (see D) are labeled in red. Cell density was normalized, and cells were spotted onto plates in 10-fold serial dilutions. Plates were incubated for 2–3 days at the indicated temperatures. See also Figure S2 and Table S1.
Figure 2
Figure 2
TREX-2 Affects Cdk8 Module Assembly with Mediator Core (A) The yeast Mediator complex was affinity-purified via TAP-tagged Med7 from wild-type and sac3Δ cells. Calmodulin eluates were analyzed by SDS-PAGE and Coomassie staining (upper panel) and immunoblotting (lower panel). Assigned subunits were determined by mass spectrometry (bands were excised from gel). Note that the Cdk8 module proteins are present in substoichiometric amounts in wild-type Mediator preparations (labeled with open circles, except CycC, which co-migrates with other proteins). Immunodetection of Med17 was used for normalization. WCE, whole cell extract; Mr(K), molecular weight standard. (B) The same purification as in (A) was further probed with the indicated antibodies. Asterisks indicate degradation products of Rpb1. (C) Med7-TAP-purifications of Mediator from wild-type and mutant cells. Calmodulin eluates and whole cell extracts were immunoblotted with the indicated antibodies. See Figure S2E for corresponding Coomassie gel. Cartoon depicts the contours of the Mediator core (head, middle, tail) and Cdk8 module structures (both drawn to scale) based on cryo-EM data (Tsai et al., 2014). Arrows indicate contact points between the complexes (Tsai et al., 2014). (D) Genetic interaction analysis. A sac3Δ/cdk8Δ shuffle strain containing a SAC3 cover plasmid (URA3) was transformed with wild-type SAC3, empty vector, or the indicated sac3 mutant alleles (HIS plasmids). Growth was followed on SDC-His (loading control) and on SDC+5-fluoroorotic acid (5-FOA) plates to shuffle out the URA cover plasmid. (E) Same set-up as in (D) except that cells were co-transformed with wild-type CDK8 or a cdk8 catalytic point mutant. See also Table S6.
Figure 3
Figure 3
TREX-2 Interaction with Mediator Requires the Sac3 PCI Domain and Med31 (A) TAP-tagged Med7 was purified from sac3Δ cells, which were transformed with plasmids carrying N-terminally myc-tagged wild-type or mutant alleles of SAC3. Calmodulin eluates and whole cell extracts were immunoblotted with the indicated antibodies. The faster migrating band of myc-Sac3 is a commonly observed degradation product. Med7 immunoblotting was used for normalization. Note that the mutant Sac3 proteins were expressed at similar levels as the wild-type protein. (B) Med7-TAP purifications from the indicated cells were analyzed by immunoblotting. For Cdk8 WCE levels see Figure 2C. (C) Mediator cartoon with the crystal structure of Med31/Med7N docked into the prominent protrusion on the “middle” module. Approximate position of the Pol II CTD binding site is marked and additional middle subunits are indicated. All data based on Tsai et al. (2014). (D) Med7-TAP was purified from the indicated strains, which were transformed with a myc-Sac3 plasmid and analyzed by immunoblotting. (E) Genetic interaction analysis. Single mutant strains were transformed with an empty vector and the double mutants with a SAC3 wild-type cover plasmid (URA3). Growth was followed on SDC and on SDC+5-FOA plates to shuffle out the cover plasmid. (F) Immunoblot analysis of the indicated Med7-TAP strains containing a myc-Sac3 plasmid. See also Figure S7B.
Figure 4
Figure 4
TREX-2 Interacts with the Med31/Med7N Submodule In Vitro (A) Crystal contact observed in the crystal lattice of two different TREX-2 PCI domain complexes. Helices α1, α2, and α4 of Sac3 compose a highly conserved surface region that is key to interact with molecular neighbors () in the present crystal form (gray) and in the previously reported crystal structure (PDB: 3t5v, orange). See also Figure S2B. (B) In vitro reconstitution of the interaction between Mediator and the TREX-2 PCI domain. Mediator was purified by IgG-Protein A affinity-purification from yeast and incubated on beads with recombinant wild-type or mutant sac3 R288D TREX-2 PCI domain complexes containing Flag-tagged Thp1 (see D for input) in an ∼1:5 and 1:10 molar ratio of Mediator:TREX-2. Following washing and TEV protease elution, samples were analyzed by immunoblotting. Med7 was used for normalization. (C) Same set-up as in (B) except that wild-type Mediator was compared to Mediator purified from med31Δ cells. (D) In vitro binding assay using the recombinant GST-Med31/Med7N heterodimer or GST as negative control. Proteins were immobilized on GSH beads and incubated with the recombinant wild-type or mutant TREX-2 PCI domain complexes. Following elution, Thp1-FLAG was detected by immunoblotting. Inputs are shown on the right. See also Figure S7B.
Figure 5
Figure 5
The Sac3 PCI Domain Is Required for Transcription of Specific Genes In Vivo (A) Pol II occupancy at the GAL1 promoter (Prom), 5′ORF, 3′ORF, and 3′UTR region was analyzed by ChIP in WT and mutant cells. Cells were either grown in raffinose or induced with 2% galactose for 120 min. Pol II occupancy at telomere 06L is shown as a negative control. Error bars represent SD of three independent experiments. qPCR primers are listed in Table S2. (B) Cluster diagram of genes with significantly altered mRNA levels (>2.0-fold) in Mediator or TREX-2 mutant cells. Changes in mRNA levels compared to the wild-type strain are depicted in red (up), green (down), or black (no change). (C) Pearson’s correlation matrix for expression profiles of TREX-2 and Mediator mutant strains as indicated (FC > 2.0 and FDR < 0.05). (D) Number of significantly altered genes of all investigated strains. See also Figure S3C. (E) Schematic view of sulfur amino acid biosynthesis superpathway. Genes with reduced expression in sac3Δ, med31Δ, or cdk8Δ cells are indicated. (F) Growth analysis of WT, cdk8Δ, med31Δ, and sac3 mutant strains on medium with and without methionine. All BY4741 strains were transformed with a pRS411 (MET) plasmid to allow growth on methionine-deficient media. See also Figures S4 and S7A and Table S5.
Figure 6
Figure 6
The Sac3 PCI Domain and Med31 Are Required for Gene-NPC Targeting GAL1-NPC targeting assay. The GAL1 locus is tagged with TetO repeats, which are labeled with TetR-GFP, the nuclear envelope is labeled with Nup188-GFP. sac3Δ cells were transformed with plasmids carrying either SAC3 wild-type, or the sac3 R288D allele, cdk8Δ cells contained an empty plasmid. For each strain, examples are shown both in glucose and galactose (scale bar, 2 μm). After z stack acquisition, the position of the labeled GAL1 locus was determined in those cells where the brightest GAL1 signal and the largest nuclear diameter were in the same z section. The bar graph shows the proportion of GAL loci found in the peripheral volume (zone I). Comparisons of GAL1 distributions for each strain and growth condition were performed using the one-tailed Fisher’s exact test. The p value is indicated for each test and N, the total number of cells analyzed, is shown at the bottom of the bars. Results were reproduced in an independent experiment: wild-type: n = 201 (glucose) and 230 (galactose), p < 0.0001; sac3 R288D: n = 190 (glucose) and 198 (galactose), p = 0,3112; cdk8Δ: n = 252 (glucose) and 214 (galactose), p < 0,0001. For analysis of a control gene not affected by TREX-2 see Figure S5C. See also Figure S6.
Figure 7
Figure 7
The Sac3 PCI Domain Promotes Transcription and mRNA Export Mechanism for a relay between TREX-2, Mediator, and Pol II. Model depicts the putative overall topology of TREX-2 and its interaction with Mediator. (1) Docking to Mediator involves the conserved pair of Sac3 R256/R288 residues (red sticks) and the Med31 submodule (magenta). (2) TREX-2 regulates Cdk8 kinase module association. (3) TREX-2, Cdk8, and Med31 impact on RNA Pol II CTD Ser5 phosphorylation (S5; yellow). (4) TREX-2 also influences mRNA export via the PCI surface centered around the Sac3 R256/R288 residues. Other mRNA adaptor/export proteins are depicted as circles. Transition between Pol II initiation and early elongation is shown. TREX-2 attaches to the NPC basket through an NPC anchor domain comprising a 12.5 nm long Sac3 helix, two Sus1 molecules and Cdc31 (all in gray, PDB: 3fwc).
Figure S1
Figure S1
Sac3 Sequence Analysis and Characterization of Sac3 Mutants, Related to Figure 1 (A) Sequence alignment of Sac3 proteins from S. cerevisiae, S. pombe, C. elegans, D. melanogaster, G. gallus, D. rerio, M. musculus, and H. sapiens. Conserved residues are highlighted in boxes. Strictly conserved residues have a red background. Filled triangles mark strictly conserved residues located within clusters A and B of the Sac3 helical domain. Open triangles label residues Lys467 and Lys468, which are also shown in Figure S2A. Solid gray bar indicates sequence that defines the Sac3 PCI domain as ‘atypical’ compared to conventional PCI domain variants (Pick et al., 2009). (B) SDS-PAGE analysis of 6His-Sac3 wild-type and mutant PCI domain complexes after polycistronic expression in E. coli, Ni-NTA affinity purification and size-exclusion chromatography on a Superdex 200 column. (C) TREX-2 purification from yeast cells. Thp1-TAP sac3Δ strains were transformed with the indicated N-terminally myc-tagged SAC3 plasmids (endogenous promoter) and subject to tandem-affinity purification. The full-length Sac3 protein typically shows variable signs of degradation. Sus1 and Cdc31 bind to the C-terminal domain of TREX-2 (see Figure 1A) and their stoichiometry with respect to Thp1 is a good proxy of overall complex integrity. (D) Localization of N-terminally GFP-tagged Sac3 versions expressed from their endogenous promoter in sac3Δ cells. Sac3 localizes mainly to the nuclear periphery, where it exhibits a punctate staining pattern that is typical for NPCs and their associated proteins. Scale bar 3μm.
Figure S2
Figure S2
Structural, Biochemical, and Genetic Characterization of TREX-2, Mediator, and Pol II, Related to Figures 1 and 2 (A) Top view of the yeast Sac3(222-572)/Thp1(170-455)/Sem1 complex in ribbon representation, showing the electrostatic surface potential and the surface conservation of the trimeric complex (left to right). The winged-helix domains of Sac3 and Thp1 are encircled (black line). Positively charged Sac3 residues Lys467 and Lys468 that have been analyzed in mutational studies are indicated. (B) Structural alignment of Sac3 from this study (gray) and Sac3 (PDB: 3t5v) (orange). The interaction of Sac3 with its crystallographic neighbor () is shown with α1 and α2 helices forming the crystallographic interface in both crystal forms. (C) The yeast Mediator complex was affinity-purified via TAP-tagged Med15 from wild-type and sac3Δ cells. Calmodulin eluates were analyzed by SDS-PAGE and immunoblotting using the indicated antibodies. Loss of Cdk8 occurs also when Med15 is used as a TAP-tagged bait. (D) Yeast RNA Polymerase II was affinity-purified via TAP-tagged Rpb3 from wild-type and sac3Δ cells. Calmodulin eluates were analyzed by SDS-PAGE and Coomassie staining (upper panel) and immunoblotting (lower panel) using the indicated antibodies. Subunits were assigned according to their calculated molecular weight. Tfg1 and Tfg2 are subunits of TFIIF. Asterisk indicates degradation product of Rpb1, which appeared to be more susceptible to proteolysis when hyperphosphorylated on Ser5. (E) Med7-TAP purifications of Mediator from wild-type and mutant cells. Calmodulin eluates were analyzed by SDS-PAGE and Coomassie staining. Open circles indicate Med13 (top) and Med12 (bottom). (F) Genetic interaction analysis shows negative synthetic links between MED31 and SAC3 R288D. The indicated genotypes were produced by transformation with the respective HIS plasmids into cells which also contain a SAC3 cover plasmid (URA3). Growth was followed on SDC-His and on SDC+5-fluoroorotic acid (5-FOA) plates to counterselect against the cover plasmid.
Figure S3
Figure S3
Gene Expression Analysis of TREX-2 and Mediator Mutants, Related to Figure 5 (A) GAL1 activation in the indicated strains. Induction was performed by adding 2% galactose to raffinose-containing media and incubation for 60 min. Relative GAL1 mRNA levels were analyzed by qPCR and normalized to SCR1 RNA. Wild-type level was set to 100%. Error bars represent SD of three/four independent experiments as indicated. The qPCR primer sequences are listed in Table S2. (B) Venn diagrams showing the number of overlapping and non-overlapping genes in sac3Δ, cdk8Δ, med31Δ, and sac3 R288D mutant strains for up-and downregulated genes. (C) Statistical analysis of G+C content, expression levels and gene length for up- and downregulated genes in sac3Δ cells. Mean values are shown; dashed line represents the genome mean. p values (Mann–Whitney’s U-test) are indicated only for significant changes as compared to the genome mean. Downregulated genes in sac3Δ cells had a significantly higher GC content and were shorter in length than the genome average. Upregulated genes exhibited lower expression values than average. (D) Table shows the expression level changes of genes involved in the superpathway of sulfur amino acid biosynthesis in the indicated mutants. Changes with a 2-fold or greater decrease in expression are marked in green. LogFC values for med31Δ cells were taken from Koschubs et al. (2009). (E) Validation of target genes. mRNA levels of sulfur amino acid biosynthesis genes, which showed an at least 2-fold decrease in expression in one of the deletion mutants (labeled green in D) were measured by qPCR and normalized to SCR1 RNA. Wild-type level was set to 100%. Error bars represent SD of three independent experiments. The qPCR primer sequences are listed in Table S2.
Figure S4
Figure S4
ChIP-exo of TREX-2, Related to Figure 5 (A) Comparison of ChIP-exo profiles for Thp1-TAP and NoTag control in two independent experiments showed no significant difference in Thp1 occupancy. Bell plots show 5′-end tags for Thp1 and noTag control, aligned by the midpoint of transcription start site (TSS) and transcription end site (TES) and sorted by the gene length. Upper and lower sets of panel correspond to top 1% highly expressed genes and the remaining 99% genes. Bell plots are a graphical way to analyze if a particular factor is enriched at the 5′ or 3′ end of genes or throughout the gene body. For every transcript defined by (Xu et al., 2009), the 5′ end of the sequencing reads (tags) were retrieved for a defined region (+/− 2kb) around the midpoint of transcription start site (TSS) and transcription end site (TES). After plotting the tags with respect to the TSS-TES midpoint, the genes are sorted based on transcript length which gives it a characteristic bell shape. Both NoTag and Thp1-TAP show enrichment in the gene body relative to the 5′/3′ end of genes. (B) Plots of Thp1 and NoTag ChIP-exo reads over putative TREX-2 target genes featured in (Santos-Pereira et al., 2014). Shown is the smoothed distribution of ChIP-exo tags 5′ ends over a 4kb window around the TSS of MSB2, PMA1, TKL1, and TEF1. All datasets were normalized to have an equal number of tags.
Figure S5
Figure S5
Gene-NPC Targeting and Expression of HXK1, Related to Figure 6 (A) HXK1-NPC targeting assay. Yeast cells expressing GFP–LacI and GFP–Nup49 fusions and carrying 256 lacO repeats upstream of the subtelomeric HXK1 gene (Taddei et al., 2006) were analyzed under repressed (Glucose) and activated (Galactose) conditions in the respective strains. The percentage of HXK1 loci in the nuclear periphery is indicated. N indicates the total number of cells analyzed. P-values refer to a one-tailed Fisher’s exact test comparing the indicated distributions (scale bar, 2 μm). (B) HXK1 mRNA levels of uninduced (glucose) and induced (galactose) wild-type and indicated deletion strains. For HXK1 induction an exponentially growing YPD culture was washed once in YPG and incubated for additional 60 min at 30°C in YPG. Quantification was performed by qPCR and normalized to SCR1 RNA. Error bars represent SD of N independent biological replicates as indicated. Note that SAC3 deletion causes a modest derepression of HXK1 already in uninduced cells, which may correlate with a higher percentage of HXK1 loci at the nuclear periphery (WT uninduced versus sac3Δ uninduced: p = 0,0003) (see A). Deletion of the transcriptional repressor HXK2 induced HXK1 transcription already in Glucose but could not recover gene expression to WT levels in sac3Δ cells upon Galactose induction. qPCR primers used are listed in Table S2. (C) PES4 nuclear position is insensitive to galactose (Taddei et al., 2006) or SAC3 deletion. A strain bearing lacO repeats near PES4 and expressing GFP-LacI and GFP-Nup49 was grown in glucose or galactose and compared to a sac3Δ mutant. The same analysis was performed as in (A).
Figure S6
Figure S6
Sac3 Localization and Cell Growth in Mediator Mutants, Related to Figure 6 (A) Localization of N-terminally GFP-tagged wild-type Sac3 expressed from endogenous promoter in sac3Δ cells or cells carrying an additional deletion of CDK8 or MED31. Sac3 localizes mainly to the nuclear periphery, where it exhibits a punctate staining pattern that is typical for NPCs and their associated proteins. Scale bar 3μm. (B) Growth analyses of the indicated strains on medium prepared with glucose or galactose and different temperatures. Cell density was normalized and cells were spotted onto plates in 10-fold serial dilutions. Plates were incubated for 2-3 days.
Figure S7
Figure S7
mRNA FISH Analysis and Model of the Mediator Middle Module, Related to Figures 3, 4, and 5 (A) Analysis of nuclear mRNA export in the indicated wild-type and mutant strains, containing the respective plasmids. Exponentially growing cells were subjected to poly(A)+ RNA fluorescent in situ hybridization (FISH) with Cy3-labeled oligo probes. DNA was stained with DAPI. Percentage numbers indicate cells with nuclear fluorescent intensity above cytoplasmic signal (n = 100). Scale bar, 4 μm. (B) Left: cartoon of the yeast Mediator complex cryo-EM structure (Tsai et al., 2014). Subunits of the ‘middle‘ module are indicated based on the deletion, labeling, and crystal structure docking analysis performed in that study. Approximate positions of the Pol II CTD binding site (Robinson et al., 2012, Tsai et al., 2014) and two prominent Cdk8 kinase module contact points (Tsai et al., 2013) are marked. Right: structural model of yeast Mediator ‘middle‘ module (Lariviere et al., 2013). The Med31/Med7N submodule in the left structure has the same orientation as the submodule docked into the cryo-EM based cartoon. Note that the Med31 submodule is flexibly connected to the elongated ‘middle‘ backbone, which itself contains a conserved flexible hinge (Baumli et al., 2005). TREX-2 docking onto the Med31 submodule is proposed to induce conformational changes in this part of Mediator.

Comment in

References

    1. Ahmed S., Brickner D.G., Light W.H., Cajigas I., McDonough M., Froyshteter A.B., Volpe T., Brickner J.H. DNA zip codes control an ancient mechanism for gene targeting to the nuclear periphery. Nat. Cell Biol. 2010;12:111–118. - PMC - PubMed
    1. Akoulitchev S., Chuikov S., Reinberg D. TFIIH is negatively regulated by cdk8-containing mediator complexes. Nature. 2000;407:102–106. - PubMed
    1. Bermejo R., Capra T., Jossen R., Colosio A., Frattini C., Carotenuto W., Cocito A., Doksani Y., Klein H., Gómez-González B. The replication checkpoint protects fork stability by releasing transcribed genes from nuclear pores. Cell. 2011;146:233–246. - PMC - PubMed
    1. Borggrefe T., Davis R., Erdjument-Bromage H., Tempst P., Kornberg R.D. A complex of the Srb8, -9, -10, and -11 transcriptional regulatory proteins from yeast. J. Biol. Chem. 2002;277:44202–44207. - PubMed
    1. Cabal G.G., Genovesio A., Rodriguez-Navarro S., Zimmer C., Gadal O., Lesne A., Buc H., Feuerbach-Fournier F., Olivo-Marin J.C., Hurt E.C., Nehrbass U. SAGA interacting factors confine sub-diffusion of transcribed genes to the nuclear envelope. Nature. 2006;441:770–773. - PubMed

Publication types

MeSH terms

Associated data