. 2015 Aug 27;162(5):1078-89.
doi: 10.1016/j.cell.2015.08.021.

A Distinct Function of Regulatory T Cells in Tissue Protection

Affiliations

A Distinct Function of Regulatory T Cells in Tissue Protection

Nicholas Arpaia et al. Cell. .

Abstract

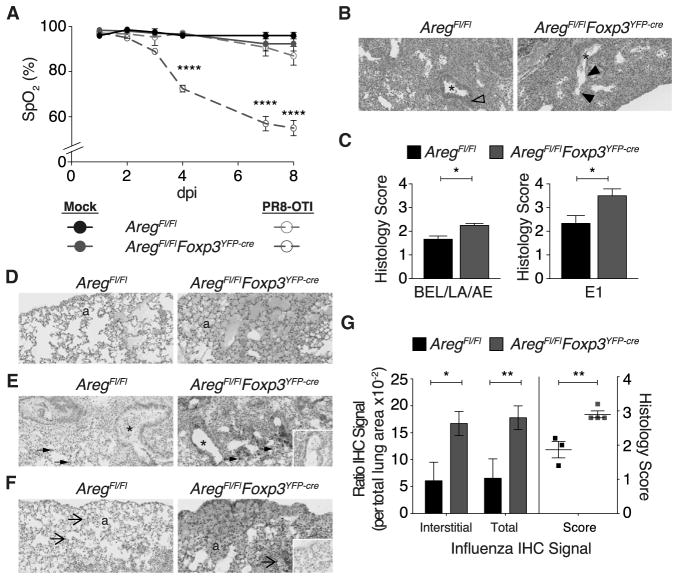
Regulatory T (Treg) cells suppress immune responses to a broad range of non-microbial and microbial antigens and indirectly limit immune inflammation-inflicted tissue damage by employing multiple mechanisms of suppression. Here, we demonstrate that selective Treg cell deficiency in amphiregulin leads to severe acute lung damage and decreased blood oxygen concentration during influenza virus infection without any measureable alterations in Treg cell suppressor function, antiviral immune responses, or viral load. This tissue repair modality is mobilized in Treg cells in response to inflammatory mediator IL-18 or alarmin IL-33, but not by TCR signaling that is required for suppressor function. These results suggest that, during infectious lung injury, Treg cells have a major direct and non-redundant role in tissue repair and maintenance-distinct from their role in suppression of immune responses and inflammation-and that these two essential Treg cell functions are invoked by separable cues.


Figures

Figure 1
Figure 1. In Vitro Amphiregulin Production by Treg and Conventional CD4+ T Cells
(A and B) Amphiregulin expression by Treg cells and conventional CD4+ T cells with an effector/memory cell phenotype. (A) Flow cytometric analysis for amphiregulin (Areg) and Foxp3 expression in CD4+TCRβ+ cells isolated from spleens, axillary and inguinal (pLN) and mesenteric (MLN) lymph nodes, lungs, and LILP of C57BL/6 mice following in vitro stimulation for 3 hr with PMA and ionomycin in the presence of brefeldin A. Amphiregulin+ Treg (green) and conventional CD4+ T cells (orange) and amphiregulin Treg cells (blue). The frequencies of cells within each gate are shown. (B) Flow cytometric analysis of surface and intracellular Treg cell activation markers. Histograms depict expression in amphiregulinCD4+Foxp3+ (blue) or CD4+Foxp3+amphiregulin+ (green) populations as gated in (A). Data represent one of three independent experiments, each with n ≥ 3 mice. See also Figure S1.
Figure 2
Figure 2. Treg- and T-Cell-Specific Ablation of Amphiregulin Does Not Result in Immune Activation
(A–C) Flow cytometric analysis of cells isolated from spleens, axillary and inguinal (pLN), and mesenteric (MLN) lymph nodes, lungs, and LILP of ~3-month-old AregFl/Fl (black), AregFl/FlFoxp3YFP-cre (blue), and AregFl/FlCD4-cre (red) mice (see Experimental Procedures). (A) Intracellular staining for amphiregulin (Areg) and Foxp3 within CD4+ T cells following in vitro stimulation performed as described in Figure 1A. Specific loss of amphiregulin expression in Foxp3+ Treg cells in AregFl/FlFoxp3YFP-cre mice (middle) or all CD4+TCRβ+ T cells in AregFl/FlCD4-cre mice (bottom) as compared to AregFl/Fl control animals (top). The frequencies of cells within each quadrant are shown. (B) Ex vivo surface staining of CD4+Foxp3 (top) and CD8+ (bottom) conventional T cells isolated from the indicated organs. Overlaid shaded histograms depict expression of CD44 on T cells isolated from AregFl/Fl (black), AregFl/Fl Foxp3YFP-cre (blue), and AregFl/FlCD4-cre (red) mice. (C) Cytokine production by CD4+Foxp3 T cells stimulated in vitro as described in Figure 1 legend. The data are shown as the frequency of CD4+Foxp3 T cells producing each cytokine indicated in the top left corner of the plot. Shown as mean ± SEM; comparisons to AregFl/Fl not statistically significant. Lng, lung; LP, large intestine lamina propria (LILP). Data shown are representative of more than 3 independent experiments (n ≥ 3 mice per each group). See also Figure S2.
Figure 3
Figure 3. Amphiregulin Does Not Influence Effector Differentiation or Mediate Suppression
(A and B) In vitro suppressor capacity of Treg cells is independent of amphiregulin expression. FACS-sorted naive CD4+CD44loCD62Lhi amphiregulin-sufficient or -deficient T cells from (A) AregFl/Fl (solid lines/symbols) or (B) AregFl/FlCD4-Cre (dashed lines/open symbols) mice, respectively, were cultured with graded numbers of CD4+CD25hi Treg cells FACS sorted from AregFl/Fl (black) or AregFl/FlCD4-Cre (red) animals in the presence of irradiated T-cell-depleted splenocytes and 1 μg/ml CD3 antibody for 80 hr. T cell proliferation was assessed by incorporation of [3H]-thymidine added during the final 8 hr of culture. Controls show proliferation under the same conditions for naive CD4+ T cells in the absence of Treg cells (“EFFECTOR ONLY”) and Treg cells incubated without effector cells (“Treg only”). Data are shown as mean ± SEM and represent one of two independent experiments. (C) Amphiregulin does not influence T helper cell polarization in vitro. Flow cytometric analysis of cytokine production by FACS-sorted naive CD4+CD44loCD62LhiCD25Foxp3 T cells from Foxp3GFP reporter mice cultured for 5 days with plate-bound CD3 and soluble CD28 antibodies in the presence of IL-2 alone (Th0; left); in combination with IL-12, IFNγ, and anti-mouse IL-4 antibody (Th1; middle); or IL-4 in combination with IFNγ and IL-12 neutralizing antibodies (Th2; right) with or without increasing amounts of recombinant amphiregulin (as indicated by symbol size). Intracellular staining for each indicated cytokine was performed following restimulation with PMA and ionomycin in the presence of brefeldin A. Data are representative of three independent experiments. (D–G) Equivalent in vivo suppressor capacity of amphiregulin-deficient and -sufficient Treg cells. Magnetic-bead-purified CD4+ T cells from Foxp3(CD45.1+) mice were transferred into Tcrb/Tcrd/ recipients alone (white symbols; “Foxp3 effector only”) or in combination with CD4+YFP+CD25hi Treg cells from Aregwt/wtFoxp3YFP-cre (black) or AregFl/FlFoxp3YFP-cre (blue) mice. (D) Changes in body weight were monitored and plotted as percent from weight at the date of transfer. Mice receiving only effector cells (“Foxp3 effector only”) succumbed to autoimmunity and were euthanized (the dashed line). The data are shown as mean ± SEM; n = 5 (Aregwt/wtFoxp3YFP-cre), n = 5 (AregFl/FlFox-p3YFP-cre), and n = 2 (Foxp3 Effector only). (E and F) Flow cytometric analysis of (E) the frequency of proliferating (Ki67+; left) and IFNγ-producing (right) transferred CD45.1+CD4+ and (F) CD45.1+CD8+ Foxp3 effector cells and (G) the frequency and expression levels of (H) Foxp3 (left) and CD25 (right) of transferred CD45.2+ Treg cells from each indicated group, as labeled in (D). The data are shown as mean ± SEM (n = 5 per group). No significant differences were observed in recipients receiving Aregwt/wtFoxp3YFP-cre and AregFl/FlFoxp3YFP-cre.
Figure 4
Figure 4. Production of Amphiregulin by Treg Cells Does Not Affect Anti-Viral Immune Responses
(A and B) Flow cytometric analyses for amphiregulin (Areg) expression by cells isolated from lungs of C57BL/6 mice that were intranasally instilled with PBS (dpi 0) or infected with 0.5 LD50 PR8-OTI influenza (flu) virus at the indicated time points (dpi: days post-infection). (A) Representative flow cytometry plots of amphiregulin and Foxp3 expression by CD4+ T cells directly following ex vivo isolation. (B) Numbers of amphiregulin-expressing CD4+Foxp3 conventional T cells (squares; “AREG+ Th”), CD4+Foxp3+ Treg cells (circles; “AREG+ Treg”), and LinCD90+CD127+KLRG1+ST2+ ILC2 (triangles; “AREG+ILC2”). Mean ± SEM. Data are representative of 2 independent experiments (n ≥ 3 mice per time point in each group, except n ≥ 2 per group in dpi 10 group in one of the two experiments). (C) AregFl/Fl (black), AregFl/FlFoxp3YFP-cre (blue), and AregFl/FlCD4-cre (red) mice were intranasally instilled with PBS (solid symbols; “mock”) or infected with 0.5 median lethal dose (LD50) PR8-OTI (open symbols; “PR8-OTI”). Changes in body weight were monitored daily in infected and control groups (dpi). The data are shown as mean percent weight ± SEM of weight at dpi 0. No significant differences were found between infected AregFl/FlFoxp3YFP-cre or AregFl/FlCD4-cre groups as compared to infected AregFl/Fl group (n = 4 per group except for n = 3 per group for mock-treated AregFl/FlFoxp3YFP-cre mice). Data are representative of ≥3 independent experiments. (D–G) Flow cytometric analysis of the frequency of virus-specific (D) CD8+CD44hi and (E) CD4+Foxp3CD44hi, (F) IFNγ (left), and IL-17-producing (right) CD4+Foxp3, and (G) IFNγ-producing CD8+ T cells in spleen, lung, and lung-draining lymph nodes (LDLN) of AregFl/Fl (black), AregFl/FlFoxp3YFP-cre (blue), and AregFl/FlCD4-cre (red) mice infected with 0.5 LD50 PR8-OTI at dpi 10. Mean ± SEM. Data are representative of ≥3 independent experiments (n ≥ 3 mice per group). (H) Influenza virus load on dpi 8 in lung tissue of AregFl/Fl (black), AregFl/Fl Foxp3YFP-cre (blue), and AregFl/FlCD4-cre (red) mice infected as in (C), as determined by TCID50. Data are shown as TCID50/mg of lung tissue analyzed. Mean ± SEM. Data are representative of three independent experiments. See also Figure S3.
Figure 5
Figure 5. Lung Treg Cells Prevent Tissue Damage through the Production of Amphiregulin
(A) Blood oxygen saturation (SpO2) in AregFl/Fl (solid black and dashed green) and AregFl/FlFoxp3YFP-cre (blue) mice following control treatment with PBS (solid symbols; “mock”) or infection with 0.5 LD50 PR8-OTI flu virus (open symbols; “PR8-OTI”) measured at the indicated dpi. The data are shown as mean ± SEM (n = 4 per group except for n = 3 per group for mock-treated AregFl/FlFoxp3YFP-cre mice). Depicted p value corresponds to comparison of infected AregFl/Fl with infected AregFl/FlFoxp3YFP-cre; the difference between control AregFl/Fl to control AregFl/FlFoxp3YFP-cre was not statistically significant. (B–F) Histopathological analysis of lungs from AregFl/Fl and AregFl/FlFoxp3YFP-cre mice following infection with 0.5 LD50 PR8-OTI virus as in (A), at dpi 8. (B) Representative H&E stained histologic sections depicting prominent BEL in AregFl/FlFoxp3YFP-cre lung (between filled arrowheads; right) in contrast to hyperplastic bronchial epithelium in AregFl/Fl (open arrowhead; left). Asterisk (*) marks bronchiolar lumen. (C) Quantification of increased severity (left) and extent (E1; right) of tissue damage, as measured by BEL, LA, increased cell debris, and AE. Mean ± SEM. (D) AE is marked in the subpleural region of histological sections from lungs of AregFl/FlFoxp3YFP-cre (right); alveoli (“a”). (E and F) Immunohistochemical staining for influenza virus protein antigens is (E) intensely positive in AregFl/FlFoxp3YFP-cre (right) bronchial epithelium, alveolar macrophages (solid arrows), and sloughed cellular debris. Similar but less intense staining is noted in infected AregFl/Fl (left) lung. (F) Alveolar edema stains intensely positive for influenza antigen by immunohistochemistry; in contrast, in AregFl/Fl lung sections (left), only cell-associated immunohistochemical signal (open arrows) is noted. Insets are negative control of same section; alveoli (“a”), bronchiolar lumen (*). (G) Quantification of interstitial and total signal intensity (see Experimental Procedures) and disease severity using image analysis software (left) and histological scoring (right) of sections from all mice stained as in (F). Original magnification all panels is 20×. Mean ± SEM. Data are representative of one of 2 independent experiments (n ≥ 3 mice per group). See also Figure S4.
Figure 6
Figure 6. IL-18 and IL-33 Signaling in Treg Cells Induces Production of Amphiregulin
(A–D) FACS-sorted CD4+Foxp3+ Treg cells from Foxp3GFP reporter mice were cultured in vitro with each of the indicated alarmins, or IL-1β, in the presence of IL-2 and IL-7, with (“TCRstim”; red) or without (“Unstim”; black) stimulation with CD3 and CD28 antibody-coated beads for 4 days followed by quantification of (A) total and normalized per cell (B) amphiregulin amounts and (C) IL-10 protein levels by ELISA of cell-free culture supernatants and flow cytometric analysis of cell pellets for determining total viable cell numbers (used for normalization in B and C) and (D) remaining protein levels of cell-associated amphiregulin. In the absence of TCR stimulation, IL-10 levels are below the limit of detection. The data are shown as mean ± SEM. Data are representative of ≥3 independent experiments. (E and F) The (E) frequency of amphiregulin+ST2+ cells, (F) representative flow cytometry plots depicting amphiregulin and ST2 (top) or IL-18R (bottom) expression, and the (G) frequency of amphiregulin expressing IL-18R+ST2, IL-18RST2+, and IL-18R+ST2+ cells determined by flow cytometric analysis of CD4+Foxp3+ Treg cells isolated from lungs of C57BL/6 mice following intranasal instillation with (F) PBS (dpi 0) or (E−G) infection with 0.5 LD50 PR8-OTI virus on the indicated dpi. Data are representative of 2 independent experiments (n ≥3 mice per group except n ≥2 in dpi 10 group in one of the two experiments). Data in (E) and (G) are presented as mean ± SEM. (H) Treg cell production of amphiregulin in response to influenza infection-induced tissue damage occurs in a TCR-independent manner. Tcrawt/FlFoxp3eGFP-Cre-ERT2 mice were gavaged twice with tamoxifen to induce deletion of a conditional Tcra allele and TCR ablation. Two weeks later, treated mice were infected with 0.5 LD50 PR8-OTI, and lung leukocytes were analyzed directly ex vivo by flow cytometry for amphiregulin production on dpi 5 using intracellular staining. Representative histograms (left) and MFI plots (right) depict the level of amphiregulin expression in TCR+ and TCR CD4+Foxp3+ Treg cells. TCR expression was detected using TCRβ-specific monoclonal antibody staining. MFI data are presented as mean ± SEM. Data are representative of n ≥10 mice. See also Figure S5.
Figure 7
Figure 7. Treg Cells Poised for Amphiregulin Production Display a Distinct Gene Expression Profile
(A–C) RNA-seq analysis of Treg cell subsets isolated from lungs of Il10GFPFoxp3Thy1·1 mice. Thy1.1+ Treg cells were FACS sorted into IL-10IL-18R, IL-10+IL-18R, and IL10IL-18R+ populations on day 5 following intranasal infection with 0.5 LD50 PR8-OTI. Differential gene expression between IL-10+IL-18R and IL10IL-18R+ populations is shown as (A) fold-change-fold-change plot of IL-10+IL-18R versus IL-10IL-18R and IL10IL-18R+ versus IL-10IL-18R highlighting genes exhibiting >2-fold (p < 0.01) increase in IL-10+IL-18R versus IL10IL-18R+ (green dots) and IL10IL-18R+ versus IL-10+IL-18R (blue dots) or (B) >2-fold increase (p < 0.01; shown in [A] as IL-10+IL-18R versus IL-10IL-18R, green dashed line and IL10IL-18R+ versus IL-10IL-18R, blue dashed line) in IL-10+IL-18R versus IL-10IL-18R and IL10IL-18R+ versus IL-10IL-18R (beige), IL-10+IL-18R versus IL-10IL-18R relative to IL10IL-18R+ versus IL-10IL-18R (green), or IL-10IL-18R+ versus IL-10IL-18R relative to IL10+IL-18R versus IL-10IL-18R (blue), as depicted by Venn diagram and (C) heatmap of genes with significant gene expression (n = 5 mice per population sequenced). See also Figure S6.

Comment in

References

    1. Arpaia N, Campbell C, Fan X, Dikiy S, van der Veeken J, deRoos P, Liu H, Cross JR, Pfeffer K, Coffer PJ, Rudensky AY. Metabolites produced by commensal bacteria promote peripheral regulatory T-cell generation. Nature. 2013;504:451–455. - PMC - PubMed
    1. Arvey A, van der Veeken J, Samstein RM, Feng Y, Stamatoyannopoulos JA, Rudensky AY. Inflammation-induced repression of chromatin bound by the transcription factor Foxp3 in regulatory T cells. Nat Immunol. 2014;15:580–587. - PMC - PubMed
    1. Asseman C, Mauze S, Leach MW, Coffman RL, Powrie F. An essential role for interleukin 10 in the function of regulatory T cells that inhibit intestinal inflammation. J Exp Med. 1999;190:995–1004. - PMC - PubMed
    1. Bedoya F, Cheng GS, Leibow A, Zakhary N, Weissler K, Garcia V, Aitken M, Kropf E, Garlick DS, Wherry EJ, et al. Viral antigen induces differentiation of Foxp3+ natural regulatory T cells in influenza virus-infected mice. J Immunol. 2013;190:6115–6125. - PMC - PubMed
    1. Berasain C, Avila MA. Amphiregulin. Semin Cell Dev Biol. 2014;28:31–41. - PubMed

Publication types

Substances

Associated data