. 2015 Aug 28;11(8):e1004454.
doi: 10.1371/journal.pcbi.1004454. eCollection 2015 Aug.

Modeling and Classification of Kinetic Patterns of Dynamic Metabolic Biomarkers in Physical Activity

Affiliations

Modeling and Classification of Kinetic Patterns of Dynamic Metabolic Biomarkers in Physical Activity

Marc Breit et al. PLoS Comput Biol. .

Abstract

The objectives of this work were the classification of dynamic metabolic biomarker candidates and the modeling and characterization of kinetic regulatory mechanisms in human metabolism with response to external perturbations by physical activity. Longitudinal metabolic concentration data of 47 individuals from 4 different groups were examined, obtained from a cycle ergometry cohort study. In total, 110 metabolites (within the classes of acylcarnitines, amino acids, and sugars) were measured through a targeted metabolomics approach, combining tandem mass spectrometry (MS/MS) with the concept of stable isotope dilution (SID) for metabolite quantitation. Biomarker candidates were selected by combined analysis of maximum fold changes (MFCs) in concentrations and P-values resulting from statistical hypothesis testing. Characteristic kinetic signatures were identified through a mathematical modeling approach utilizing polynomial fitting. Modeled kinetic signatures were analyzed for groups with similar behavior by applying hierarchical cluster analysis. Kinetic shape templates were characterized, defining different forms of basic kinetic response patterns, such as sustained, early, late, and other forms, that can be used for metabolite classification. Acetylcarnitine (C2), showing a late response pattern and having the highest values in MFC and statistical significance, was classified as late marker and ranked as strong predictor (MFC = 1.97, P < 0.001). In the class of amino acids, highest values were shown for alanine (MFC = 1.42, P < 0.001), classified as late marker and strong predictor. Glucose yields a delayed response pattern, similar to a hockey stick function, being classified as delayed marker and ranked as moderate predictor (MFC = 1.32, P < 0.001). These findings coincide with existing knowledge on central metabolic pathways affected in exercise physiology, such as β-oxidation of fatty acids, glycolysis, and glycogenolysis. The presented modeling approach demonstrates high potential for dynamic biomarker identification and the investigation of kinetic mechanisms in disease or pharmacodynamics studies using MS data from longitudinal cohort studies.


Conflict of interest statement

KMW holds stock in sAnalytiCo Ltd. and in Biocrates Life Sciences AG. CB, MB, MN declare no competing interests.

Figures
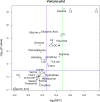
Fig 1
Fig 1. Volcano plot.
The volcano plot displays the log2(MFC) between minimum and maximum concentrations values versus the-log10(P-value) calculated from statistical hypothesis testing. The horizontal blue line indicates the selected significance level of 0.001. The vertical blue line indicates the threshold for classification as moderate predictor (MFC > 1.20). The vertical green line denotes the classification threshold for a strong predictor (MFC > 1.40). Acetylcarnitine (C2), propionylcarnitine (C3) and alanine could be selected as strong biomarker candidates. Valerylcarnitine (C5), arginine, glucose, butyrylcarnitine (C4), methylmalonylcarnitine (C3-DC-M), and hydroxyvalerylcarnitine (C5-OH) were identified as moderate biomarker candidates.
Fig 2
Fig 2. Kinetic signatures of acylcarnitines.
Kinetic signatures of the 11 selected acylcarnitines are depicted. Dynamic curves were characterized by polynomial fitting of 9th degree to the median concentration values of the analyzed metabolites. For visualization, relative changes (in %) of metabolite concentrations in reference to their initial concentration at rest are displayed. An early response pattern is shown for valerylcarnitine (C5) with a decrease in relative concentration of approx. 16%. Late response profiles include acetylcarnitine (C2), propionylcarnitine (C3) and butyrylcarnitine (C4).
Fig 3
Fig 3. Kinetic signatures of amino acids.
Kinetic signatures of the 18 selected amino acids. Methionine yields a halving interval response pattern with a plateau (sigmoid characteristics). Alanine and arginine show a late response pattern.
Fig 4
Fig 4. Kinetic signature of glucose.
A delayed response pattern is apparent in glucose, decreasing in relative concentration (-12%) towards the end of exercise with a steep increase (up to 13%) after the end of exercise during the recovery phase.
Fig 5
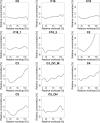
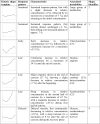
Fig 5. Kinetic shape templates.
Kinetic shape templates for the classification of similar dynamic patterns.
Fig 6
Fig 6. Data analysis workflow.
Flow chart of the selected data analysis and biomarker discovery workflow (according to the workflow described by Baumgartner & Graber, 2008 [42]). Intermediate discovery steps include the technical validation of raw data, preprocessing of data, selection of dynamic biomarker candidates, modeling and characterization of metabolite kinetic patterns, identification of metabolite groups with similar kinetic behavior, specification of observed kinetic shape templates, classification of dynamic biomarker candidates, and subsequently the biochemical interpretation of findings.
Fig 7
Fig 7. Glucose concentration curves.
A) Concentration curves of all test persons after linear interpolation. B) Box plot representation of concentration curves of all test persons.
Fig 8
Fig 8. Heatmap.
Colored heatmap, visualizing the results of hierarchical cluster analysis. Concentration values are scaled and centered for each metabolite by row, resulting in an improved color representation. Relative workload values (x-axis) are visualized in linear order, resulting in a colored representation of the polynomially fitted concentration curves for each metabolite.

Similar articles

Cited by

References

    1. Guldberg CM, Waage P. Studier i affiniteten. (Translation: Studies on affinities.) Forhandlinger i Videnskabs-Selskabet i Christiania; 1864.
    1. Guldberg CM, Waage P. E´tudes sur les affinites chimiques. (Translation: Studies on chemical affinities.) Christiania: Brøgger & Christie; 1867.
    1. Guldberg CM, Waage P. Über die chemische Affinität. (Translation: On chemical affinity.) Erdmann’s Journal für practische Cehmie. 1879;127:69–114.
    1. Voit E, Martens H, Omholt SW. 150 years of the mass action law. PLoS Comput Biol. 2015;11(1):e1004012 10.1371/journal.pcbi.1004012 - DOI - PMC - PubMed
    1. Michaelis L, Menten ML. Die Kinetik der Invertinwirkung. (Translation: The kinetics of invertase activity.) Biochemische Zeitschrift. 1913;49:333–369.

LinkOut - more resources