. 2015 Sep 29;6(29):27938-52.
doi: 10.18632/oncotarget.4391.

Automated tumor analysis for molecular profiling in lung cancer

Affiliations

Automated tumor analysis for molecular profiling in lung cancer

Peter W Hamilton et al. Oncotarget. .

Abstract

The discovery and clinical application of molecular biomarkers in solid tumors, increasingly relies on nucleic acid extraction from FFPE tissue sections and subsequent molecular profiling. This in turn requires the pathological review of haematoxylin & eosin (H&E) stained slides, to ensure sample quality, tumor DNA sufficiency by visually estimating the percentage tumor nuclei and tumor annotation for manual macrodissection. In this study on NSCLC, we demonstrate considerable variation in tumor nuclei percentage between pathologists, potentially undermining the precision of NSCLC molecular evaluation and emphasising the need for quantitative tumor evaluation. We subsequently describe the development and validation of a system called TissueMark for automated tumor annotation and percentage tumor nuclei measurement in NSCLC using computerized image analysis. Evaluation of 245 NSCLC slides showed precise automated tumor annotation of cases using Tissuemark, strong concordance with manually drawn boundaries and identical EGFR mutational status, following manual macrodissection from the image analysis generated tumor boundaries. Automated analysis of cell counts for % tumor measurements by Tissuemark showed reduced variability and significant correlation (p < 0.001) with benchmark tumor cell counts. This study demonstrates a robust image analysis technology that can facilitate the automated quantitative analysis of tissue samples for molecular profiling in discovery and diagnostics.

Keywords: digital pathology; image analysis; manual macrodissection; molecular pathology; percentage tumor.


Conflict of interest statement

CONFLICTS OF INTEREST

Professor Peter Hamilton is the founder of and non-executive director with PathXL Ltd. Jonathon Tunstall is the Director of Product Strategy with PathXL Ltd. David McCleary is Head of Development and Research at PathXL. Jim Diamond is Research Lead at PathXL Ltd. Professor Manuel Salto-Tellez is a Senior Advisor to PathXL.

Figures

Figure 1
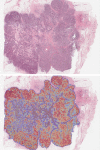
Figure 1. Comparison of current methods for macrodissection based on manual annotation (top) and the proposed automated tumor annotation for macrodissection (bottom)
Figure 2
Figure 2. Two examples of manual tumor annotation showing observer varibility
In both A. and B. the solid black contours were from the first review, with the dotted lines from the second review. A minor discrepancy exists between the two boundaries in (A) In (B), the larger discrepant area (shown with the white arrow) is a region of mixed tumor cells and necrotic tissue. This deviation might impact downstream molecular analysis.
Figure 3
Figure 3. Scatterplot of tumor percentage for 136 lung cancer cases derived from two experienced pathologists, showing gross variation between estimates
Figure 4
Figure 4. Shows the % tumor estimates provided by pathologists for 20 random regions of lung cancer
Each column represents an indvidual case with color coded dots showing the % tumor estimates for each case.
Figure 5
Figure 5. For ten cases the absolute numbers of tumor cells were counted
This is shown by the solid black line for cases ordered by increasing % tumor cells. Visual estimation of % tumor cells by four pathologists is individually plotted as the grey lines. This shows no consistency in the overcalling or undercalling of % tumor cells.
Figure 6
Figure 6. Two examples A. and B. showing the comparison between pathologist annotation (solid black line) with the automated macrodissection method (dotted black line) on H&E stained lung images
Both examples show strong concordance between manual and automated boundaries.
Figure 7
Figure 7. Objective comparison of manual and automated tumor annotations for 136 neoplastic lung tissue slides using four statistical measurements
A. Shows the inclusion rate vs. exclusion rate plot. For each of the 136 slides, the inclusion rate figure (left) and exclusion rate figures (right) are shown. For clarity, this plot was sorted by exclusion rate in descending order. The two dotted vertical lines indicate the median exclusion rate value across all slides to be 91.70% and inclusion rate of 89.00%. The top 8 cases in the plot do not have exclusion rate values as the pathologist indicated that the entirety of these tissues should be taken forward for nucleic acid extraction without macrodissection. B. A receiver operating characteristic (ROC) curve shows the majority of cases achieved strong boundary concordance with low false positivity and high true positivity (sensitivity). The area under the curve (AUC) value is 0.89. C. A box plot for CI measurement. The median CI value is 0.93, and there are 10 outlier cases marked as “+” in the plot. D. A Stem plot of the false discovery rate (FDR) for all the cases. Using a threshold value of 0.33, results in only 3 outlier cases.
Figure 8
Figure 8. Illustrates how a Tumormap can be generated from the posterior probabilities, highlighting regions of high tumor probability (red) against low tumor probability (blue) and associated color spectrum within the generated tumor boundary
Figure 9
Figure 9. A. Comparison of automated tumour nuclei counts and percentage tumour values (y-axis), against benchmark data on tumor % showing strong correlation, mapping closely to actual tumor cell percentage values
B. The same scatterplot as (A) but superimposing the range of pathology estimates (red circles) against the benchmark data.
Figure 10
Figure 10. Design of the automated annotation solution
A. Shows the manual markup and annotatation selection which provides training data for image classification in (B). B. Illustrates the linear SVM classifier which can process new images to automatically identify regions of tumour and non-tumour.
Figure 11
Figure 11. An example showing how a tissue slide is annotated using the automatic tissue identification
A. An original H&E stained lung tissue slide captured. B. A pseudo coloured TumorMap image after processing, where gray represents tumor rich tissue, white represents non-tumor tissue and black shows the white background (void). C. A refined TumorMap image where the boundary has been smoothed to support tissue annotation. D. An overlay of the TumorMap boundary on top of the original lung slide.

References

    1. Amir-Aslani A, Mangematin V. The future of drug discovery and development: Shifting emphasis towards personalized medicine. Technol. Forecast. Soc. Change. 2010;77:203–17.
    1. Kasaian K, Jones SJ. A new frontier in personalized cancer therapy: mapping molecular changes. Future Oncol. 2011;7:873–94. - PubMed
    1. Mirnezami R, Nicholson J, Darzi A. Preparing for Precision Medicine. N. Engl. J. Med. 2012:489–91. - PubMed
    1. Angulo B, Conde E, Suárez-Gauthier A, Plaza C, Martínez R, Redondo P, et al. A comparison of EGFR mutation testing methods in lung carcinoma: Direct sequencing, real-time PCR and immunohistochemistry. PLoS One. 2012;7 - PMC - PubMed
    1. Smits AJJ, Kummer JA, de Bruin PC, Bol M, van den Tweel JG, Seldenrijk K a, et al. The estimation of tumor cell percentage for molecular testing by pathologists is not accurate. Mod. Pathol. 2014;27:168–74. [Internet]. Available from: http://www.ncbi.nlm.nih.gov/pubmed/23887293. - PubMed

Publication types

MeSH terms

Substances