Flexible Modeling of Epidemics with an Empirical Bayes Framework
- PMID: 26317693
- PMCID: PMC4552841
- DOI: 10.1371/journal.pcbi.1004382
Flexible Modeling of Epidemics with an Empirical Bayes Framework
Abstract
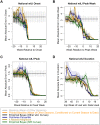
Seasonal influenza epidemics cause consistent, considerable, widespread loss annually in terms of economic burden, morbidity, and mortality. With access to accurate and reliable forecasts of a current or upcoming influenza epidemic's behavior, policy makers can design and implement more effective countermeasures. This past year, the Centers for Disease Control and Prevention hosted the "Predict the Influenza Season Challenge", with the task of predicting key epidemiological measures for the 2013-2014 U.S. influenza season with the help of digital surveillance data. We developed a framework for in-season forecasts of epidemics using a semiparametric Empirical Bayes framework, and applied it to predict the weekly percentage of outpatient doctors visits for influenza-like illness, and the season onset, duration, peak time, and peak height, with and without using Google Flu Trends data. Previous work on epidemic modeling has focused on developing mechanistic models of disease behavior and applying time series tools to explain historical data. However, tailoring these models to certain types of surveillance data can be challenging, and overly complex models with many parameters can compromise forecasting ability. Our approach instead produces possibilities for the epidemic curve of the season of interest using modified versions of data from previous seasons, allowing for reasonable variations in the timing, pace, and intensity of the seasonal epidemics, as well as noise in observations. Since the framework does not make strict domain-specific assumptions, it can easily be applied to some other diseases with seasonal epidemics. This method produces a complete posterior distribution over epidemic curves, rather than, for example, solely point predictions of forecasting targets. We report prospective influenza-like-illness forecasts made for the 2013-2014 U.S. influenza season, and compare the framework's cross-validated prediction error on historical data to that of a variety of simpler baseline predictors.
Conflict of interest statement
The authors have declared that no competing interests exist.
Figures


References
-
- Molinari NAM, Ortega-Sanchez IR, Messonnier ML, Thompson WW, Wortley PM, Weintraub E, et al. The annual impact of seasonal influenza in the US: measuring disease burden and costs. Vaccine. 2007;25(27):5086–5096. - PubMed
-
- Laporte RE. How to improve monitoring and forecasting of disease patterns. BMJ: British Medical Journal. 1993;307(6919):1573–1574. Available from: http://www.ncbi.nlm.nih.gov/pmc/articles/PMC1697783/pdf/bmj00052-0002.pdf. 10.1136/bmj.307.6919.1573 - DOI - PMC - PubMed
-
- Centers for Disease Control and Prevention. Announcement of Requirements and Registration for the Predict the Influenza Season Challenge. Federal Register. 2013. November;78(227):70303–70305. Available from: https://www.federalregister.gov/articles/2013/11/25/2013-28198/announcem....
-
- Hethcote HW. The mathematics of infectious diseases. SIAM review. 2000;42(4):599–653. 10.1137/S0036144500371907 - DOI
Publication types
MeSH terms
Grants and funding
LinkOut - more resources
Full Text Sources
Other Literature Sources
Medical
Miscellaneous

