. 2015 Aug 28;10(8):e0136612.
doi: 10.1371/journal.pone.0136612. eCollection 2015.

Longitudinal Metabolomics Profiling of Parkinson's Disease-Related α-Synuclein A53T Transgenic Mice

Affiliations

Longitudinal Metabolomics Profiling of Parkinson's Disease-Related α-Synuclein A53T Transgenic Mice

Xi Chen et al. PLoS One. .

Abstract

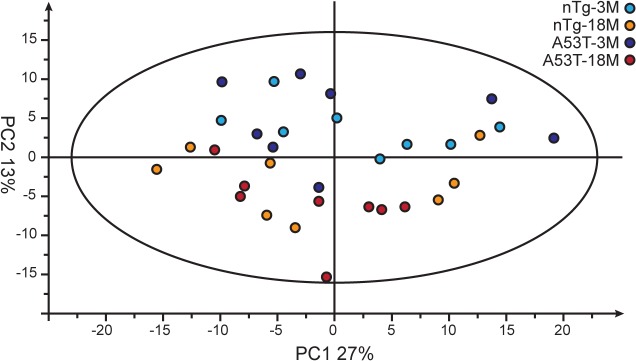
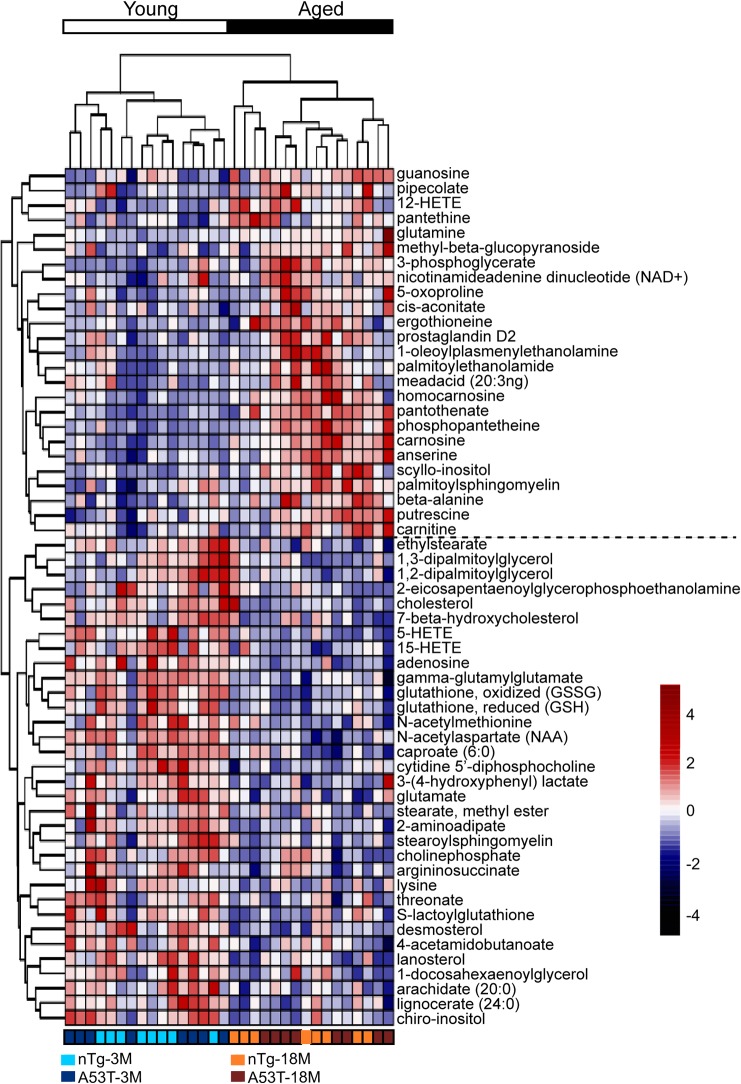
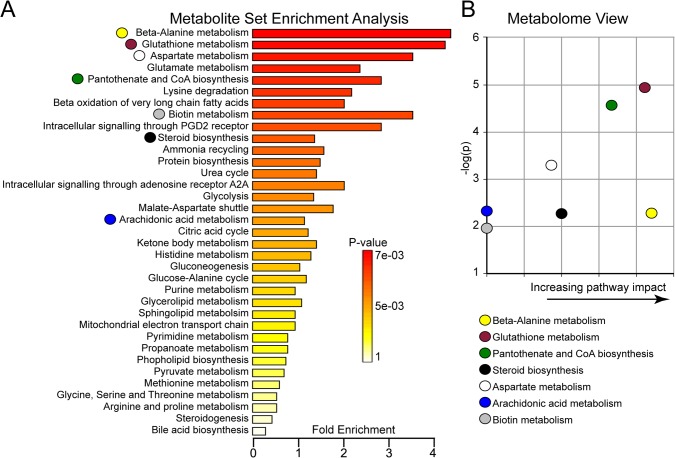
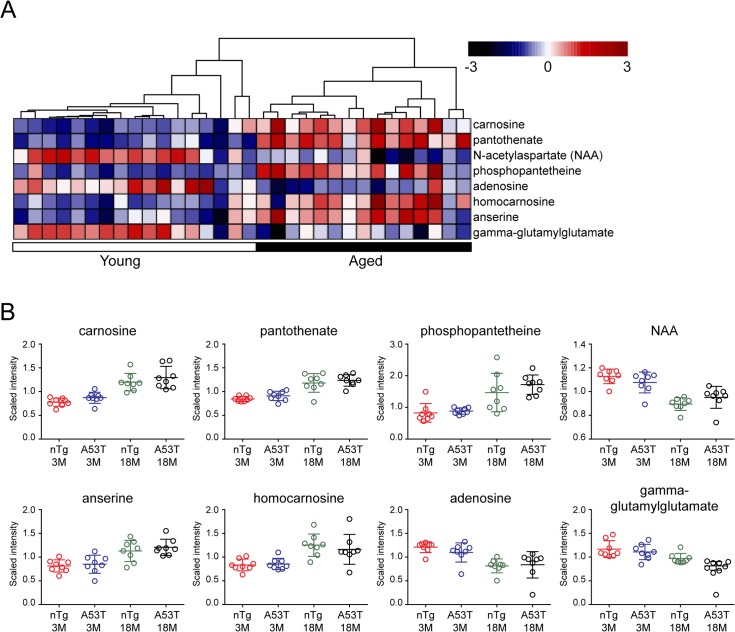
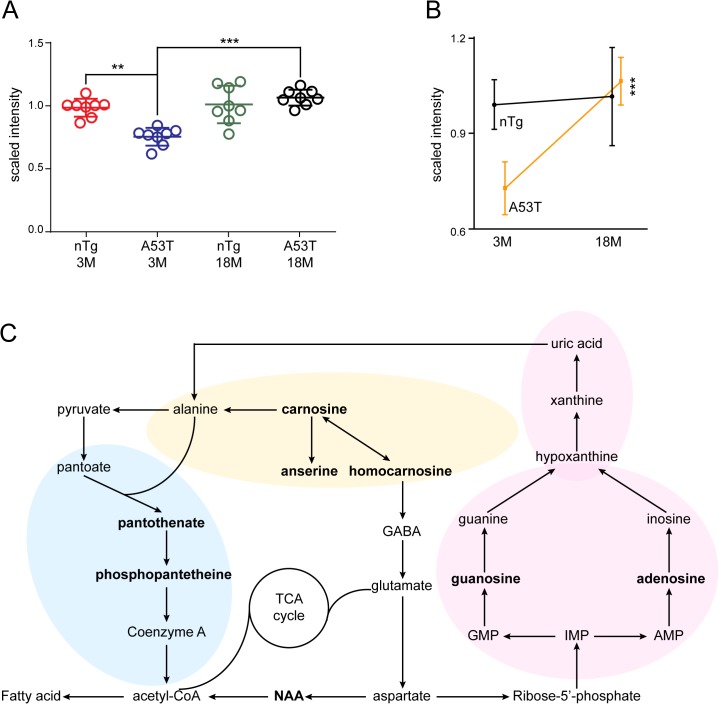
Metabolic homeostasis is critical for all biological processes in the brain. The metabolites are considered the best indicators of cell states and their rapid fluxes are extremely sensitive to cellular changes. While there are a few studies on the metabolomics of Parkinson's disease, it lacks longitudinal studies of the brain metabolic pathways affected by aging and the disease. Using ultra-high performance liquid chromatography and tandem mass spectroscopy (UPLC/MS), we generated the metabolomics profiling data from the brains of young and aged male PD-related α-synuclein A53T transgenic mice as well as the age- and gender-matched non-transgenic (nTg) controls. Principal component and unsupervised hierarchical clustering analyses identified distinctive metabolites influenced by aging and the A53T mutation. The following metabolite set enrichment classification revealed the alanine metabolism, redox and acetyl-CoA biosynthesis pathways were substantially disturbed in the aged mouse brains regardless of the genotypes, suggesting that aging plays a more prominent role in the alterations of brain metabolism. Further examination showed that the interaction effect of aging and genotype only disturbed the guanosine levels. The young A53T mice exhibited lower levels of guanosine compared to the age-matched nTg controls. The guanosine levels remained constant between the young and aged nTg mice, whereas the aged A53T mice showed substantially increased guanosine levels compared to the young mutant ones. In light of the neuroprotective function of guanosine, our findings suggest that the increase of guanosine metabolism in aged A53T mice likely represents a protective mechanism against neurodegeneration, while monitoring guanosine levels could be applicable to the early diagnosis of the disease.


Conflict of interest statement

Competing Interests: The authors have declared that no competing interests exist.

Figures

Fig 1
Fig 1. Principle component analysis (PCA) of brain metabolites influenced by aging and Parkinson’s disease-related α-synuclein A53T mutation.
PCA plot showing a segregation of the metabolites affected in all the aged mouse brain samples (colored by dark and light red for A53T and nTg mice) from the young ones (colored by dark and light blue for A53T and nTg mice). The first principle component (PC1) accounts for 27% of the overall variability; the second principle component (PC2) accounts for 13% of the overall variability.
Fig 2
Fig 2. Hierarchical clustering of metabolites affected by aging.
There are 58 metabolites significantly affected by aging from a two-way ANOVA test. The unsupervised hierarchical clustering plot shows that an age-dependent segregation of these metabolites. The scaled intensity of 58 metabolites is relatively depicted according to the color key shown on the right. Red indicates high intensity levels; blue, low intensity levels.
Fig 3
Fig 3. Metabolite pathway affected by aging.
(A) Summary plot for the metabolite set enrichment analysis (MSEA) are ranked by Holm p-value. Holm p-value is the p value adjusted by Holm-Bonferroni test that is a method to counteract the problem of multiple comparisons and is widely used for large-scale data analysis. (B) Metabolome view shows key nodes in metabolic pathways that have been significantly altered with aging. The y-axis represents unadjusted p value from pathway enrichment analysis. The x-axis represents increasing metabolic pathway impact according to the betweenness centrality from pathway topology analysis.
Fig 4
Fig 4. Identification of Aging-related metabolite biomarker.
(A) Two-way ANOVA test (q value <0.05) and RF analysis (Mean decrease accuracy >5) identify eight metabolites significantly affected by aging. Unsupervised hierarchical clustering plot shows the segregation between aged and young samples. The scaled intensity of eight metabolites is relatively depicted according to the color key shown on the top. Red indicates high intensity levels; blue, low intensity levels. The q-value used here represents the measurement of the proportion of false positives incurred (also called the false discovery rate). (B) Scatter plots compare the scaled intensity of those eight metabolites from different sample groups.
Fig 5
Fig 5. Guanosine metabolism is affected by both aging and A53T mutation.
(A) Scatter plot depicts the alteration of guanosine levels in different age and genotype groups. One-way ANOVA test, **q value <0.01; ***q value <0.001. (B) Line graph highlights the age-dependent changes of guanosine in A53T and nTg mice. One-way ANOVA test, ***q value <0.001. (C) Schematic diagram summarizes the alanine metabolic (in yellow shade) and acetyl-CoA biosynthesis (in blue shade) pathways mainly affected by aging, and the purine metabolic (in pink shade) pathway influenced by both aging and genotypes. The metabolites highlighted with the bold font represent the ones differentially altered between groups (q value < 0.05 in two-way ANOVA test).

Similar articles

Cited by

References

    1. Thomas B, Beal MF. Parkinson's disease. Hum Mol Genet. 2007;16 Spec No. 2:R183–94. Epub 2007/10/04. 10.1093/hmg/ddm159 . - DOI - PubMed
    1. Cascante M, Llorens M, Melendez-Hevia E, Puigjaner J, Montero F, Marti E. The metabolic productivity of the cell factory. Journal of theoretical biology. 1996;182(3):317–25. . - PubMed
    1. Poliquin PO, Chen J, Cloutier M, Trudeau LE, Jolicoeur M. Metabolomics and in-silico analysis reveal critical energy deregulations in animal models of Parkinson's disease. PLoS One. 2013;8(7):e69146 10.1371/journal.pone.0069146 - DOI - PMC - PubMed
    1. O'Reilly EJ, Gao X, Weisskopf MG, Chen H, Schwarzschild MA, Spiegelman D, et al. Plasma urate and Parkinson's disease in women. American journal of epidemiology. 2010;172(6):666–70. 10.1093/aje/kwq195 - DOI - PMC - PubMed
    1. Schwarzschild MA, Schwid SR, Marek K, Watts A, Lang AE, Oakes D, et al. Serum urate as a predictor of clinical and radiographic progression in Parkinson disease. Archives of neurology. 2008;65(6):716–23. 10.1001/archneur.2008.65.6.nct70003 - DOI - PMC - PubMed

Publication types