. 2015 Sep;13(7):402-14.
doi: 10.1089/adt.2015.655.

High-content assays for characterizing the viability and morphology of 3D cancer spheroid cultures

Affiliations

High-content assays for characterizing the viability and morphology of 3D cancer spheroid cultures

Oksana Sirenko et al. Assay Drug Dev Technol. 2015 Sep.

Abstract

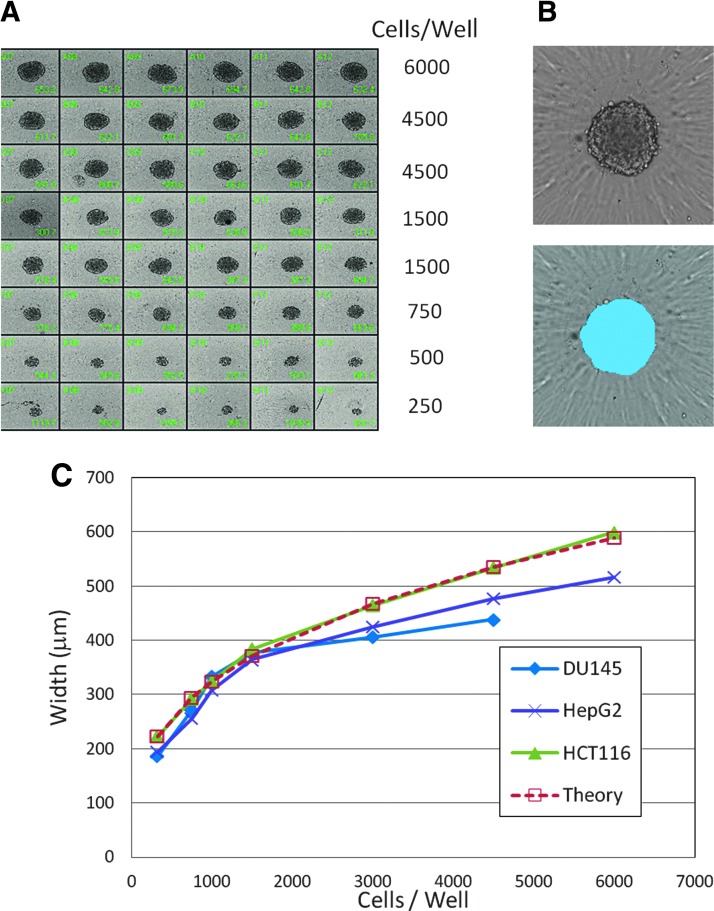
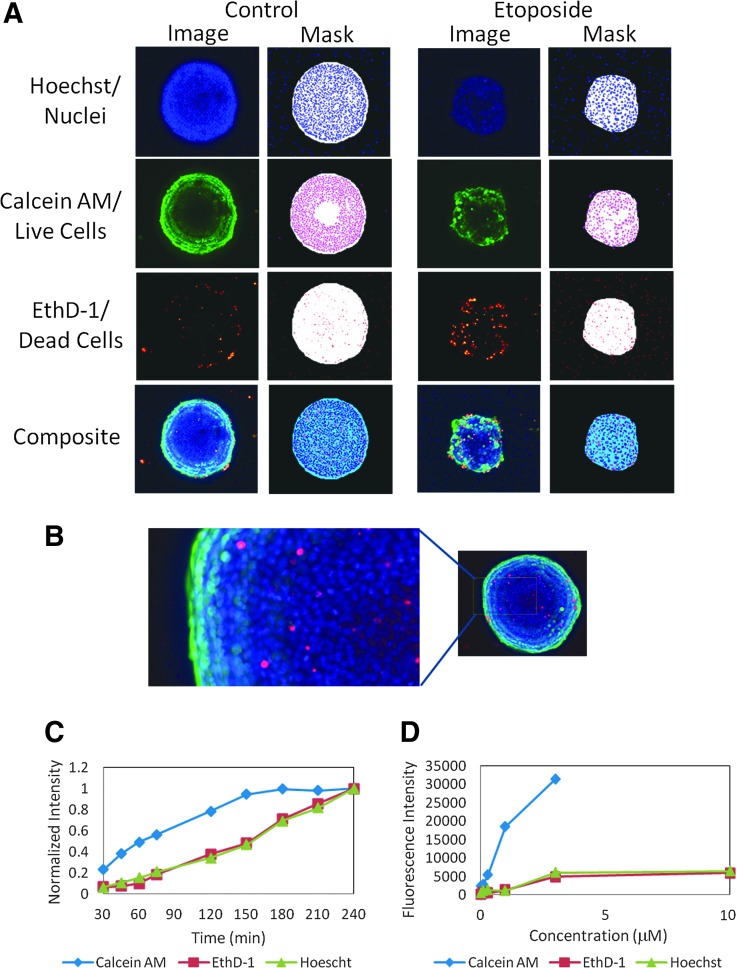
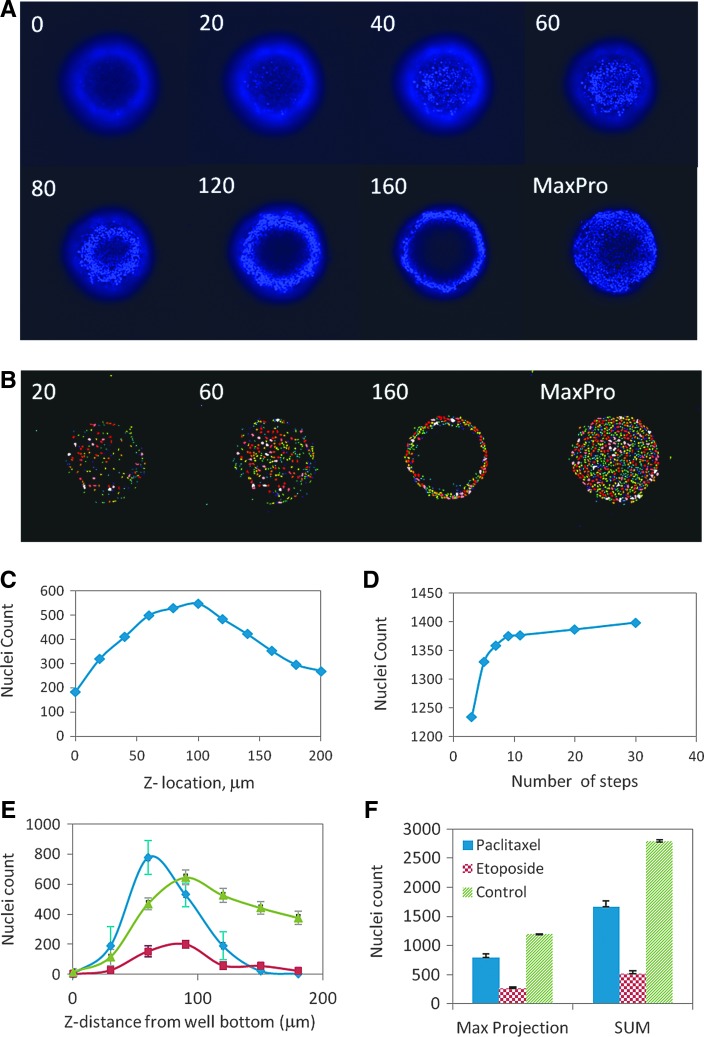
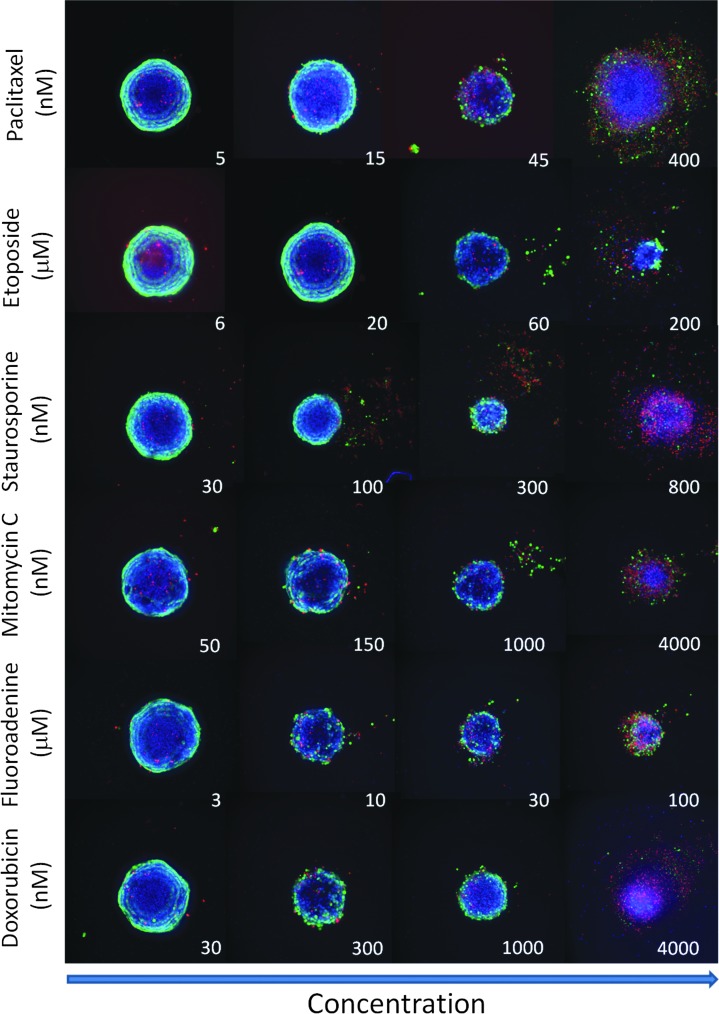
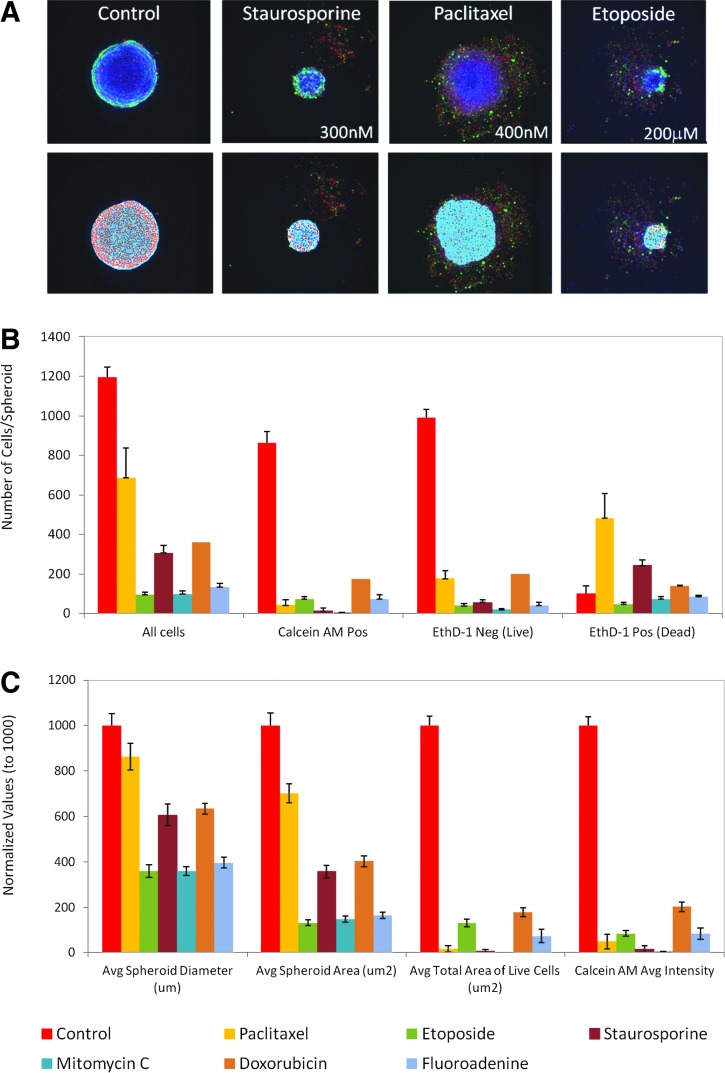
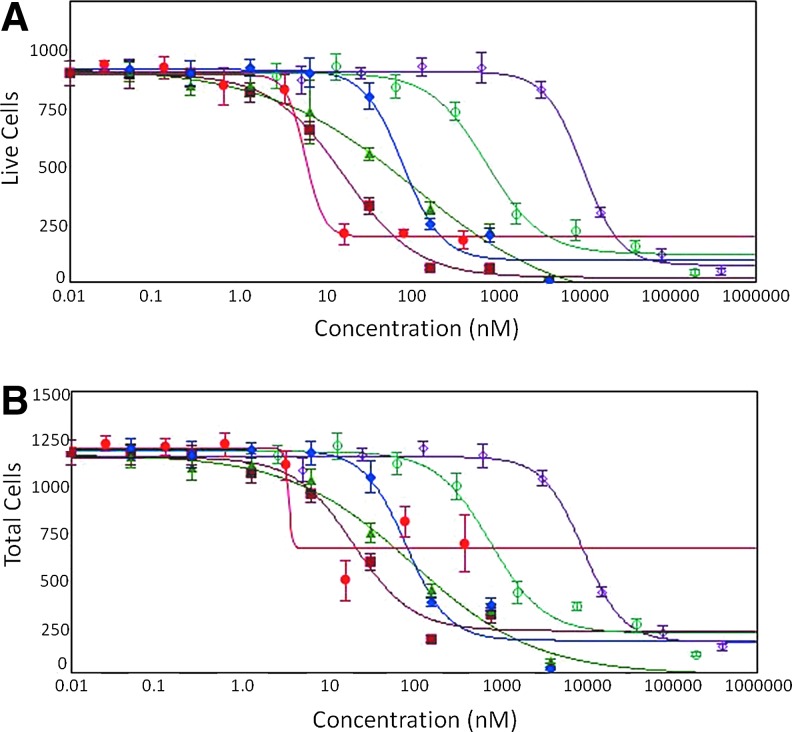
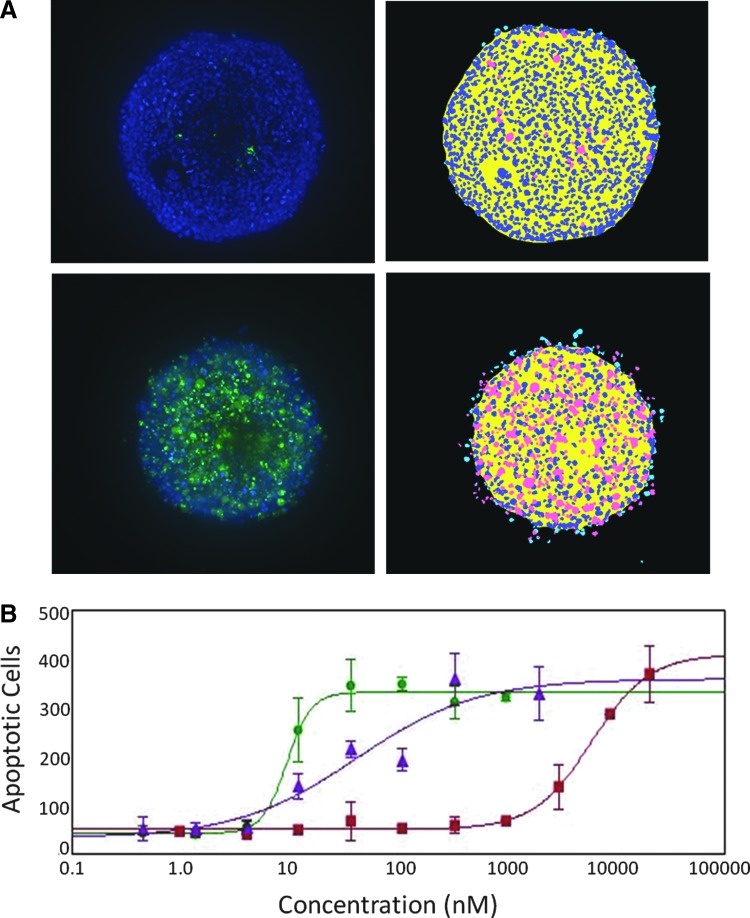
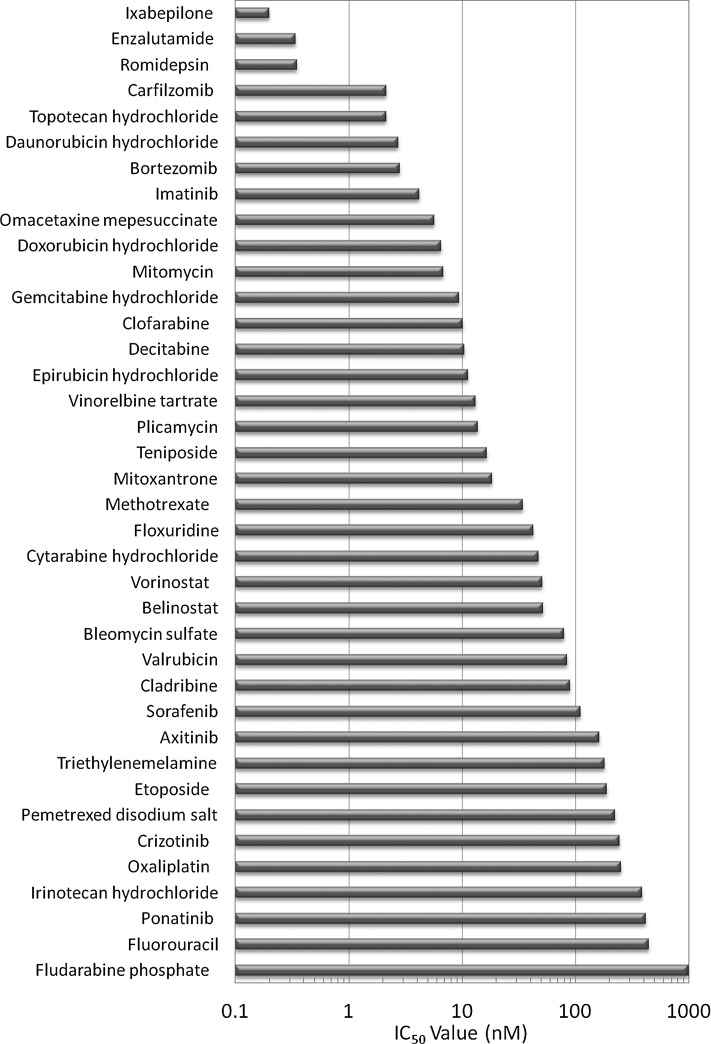
There is an increasing interest in using three-dimensional (3D) spheroids for modeling cancer and tissue biology to accelerate translation research. Development of higher throughput assays to quantify phenotypic changes in spheroids is an active area of investigation. The goal of this study was to develop higher throughput high-content imaging and analysis methods to characterize phenotypic changes in human cancer spheroids in response to compound treatment. We optimized spheroid cell culture protocols using low adhesion U-bottom 96- and 384-well plates for three common cancer cell lines and improved the workflow with a one-step staining procedure that reduces assay time and minimizes variability. We streamlined imaging acquisition by using a maximum projection algorithm that combines cellular information from multiple slices through a 3D object into a single image, enabling efficient comparison of different spheroid phenotypes. A custom image analysis method was implemented to provide multiparametric characterization of single-cell and spheroid phenotypes. We report a number of readouts, including quantification of marker-specific cell numbers, measurement of cell viability and apoptosis, and characterization of spheroid size and shape. Assay performance was assessed using established anticancer cytostatic and cytotoxic drugs. We demonstrated concentration-response effects for different readouts and measured IC50 values, comparing 3D spheroid results to two-dimensional cell cultures. Finally, a library of 119 approved anticancer drugs was screened across a wide range of concentrations using HCT116 colon cancer spheroids. The proposed methods can increase performance and throughput of high-content assays for compound screening and evaluation of anticancer drugs with 3D cell models.


Figures

<b>Fig. 1.</b>
Fig. 1.
(A) Spheroids from HCT116 cells plated at different densities. Images were acquired 48 h postplating. Smaller spheroids (500 cells/well or less) were observed to have less consistent spheroidal shape. (B) Example of image analysis and spheroid mask (blue) using the TL image. (C) Dependence of spheroid width as determined by image analysis on cell plating density (n = 12) for three cell types: HCT116 cells (green); HepG2 cells (purple); DU145 cells (blue). The response was modeled using a spherical volume model with a single-cell diameter variable. A fit of the HCT116 data to the theoretical spherical volume model using a cell diameter of 32 μm is shown in red. Error bars not shown; SDs were less than 5% of values.
<b>Fig. 2.</b>
Fig. 2.
(A) Untreated and treated spheroids were stained with a combination of three dyes: Hoechst 15 μM, EthD-1 3 μM, and calcein AM 1 μM. Images of Hoechst, calcein AM, and EthD-1 were taken using DAPI, FITC, and Texas Red channels, respectively. A composite image of all three channels is shown at the bottom. Images were generated using maximum projection from a Z-stack of seven images 30 μm apart. The resulting object masks from image analyses are shown to the right of each image. (B) Zoomed region of an untreated spheroid showing mixed population of cells. (C). Average fluorescence intensities from spheroids (n = 3) versus incubation time for all three stains. The data are normalized to the 240-min time point. (D) Average fluorescence intensity for spheroids versus dye concentration for all three stains. Error bars not shown; SDs were less than 5% of values.
<b>Fig. 3.</b>
Fig. 3.
(A) Confocal images of a spheroid stained with Hoechst taken at indicated distances from the well bottom. As the image plane moves up from the well bottom toward the spheroid center, regions of distinct nuclei appear first in the center (at the surface of spheroid in contact with the plate bottom), then form a ring pattern that increases in diameter until it reaches some maximum associated with the outer surface of the spheroid. The MaxPro image is generated from 11 individual images taken 20 μm apart. (B) Nuclei segmentation shown for corresponding images in A. Individual nuclei are given a random false color. (C) Nuclei counts for a single spheroid measured from the 11 different Z-images taken at indicated distances from the plate bottom. (D) Dependence of nuclei count in the MaxPro image from a single spheroid on the number of individual images in a Z-stack taken over a 200 μm distance. The Z-stack setup was varied from three images taken 100 μm apart to 30 images taken 5 μm apart. (E) Nuclei counts measured from the separate z-images for three representative phenotypes of spheroids: Control (untreated, green), etoposide (200 μM, red), and paclitaxel (400 nM, blue). (F) Comparison between the nuclei counts obtained from the MaxPro images and sum of the nuclei count from all individual images for the three representative phenotypes of spheroids. Error bars in E and F represent ±1 SD (n = 6).
<b>Fig. 4.</b>
Fig. 4.
Representative images of spheroids treated with different compound concentrations. Composite images of Hoechst (blue), calcein AM (green), and EthD-1 (red). Note the dose-dependent decrease of spheroid size and also increase in the number of dead cells (in red) across all treatments. Spheroids treated with high concentrations of some compounds (e.g., paclitaxel and staurosporine) appear to disintegrate.
<b>Fig. 5.</b>
Fig. 5.
(A) Representative spheroid phenotypes (top) and their corresponding masks (bottom) showing image analysis and segmentation. (B) Image analysis readouts derived as a result of Nuclei Count and Cell Scoring analysis for the following compounds: control (0.1% DMSO), paclitaxel 150 nM, etoposide 200 μM, staurosporine 300 nM, mitomycin C 1 μM, doxorubicin 1 μM, and fluoroadenine 100 μM. (C) Image analysis readouts were derived from geometric or average intensity readouts. The values in C are normalized to DMSO controls (set to 1,000). Error bars in B and C represent ± 1 SD (n = 8).
<b>Fig. 6.</b>
Fig. 6.
Concentration-dependent effects and 4-parameter curve fits of selected compounds in 3D spheroid culture using (A) Live cells (EthD-1 negative) per spheroid or (B) total cells per spheroid as determined by Cell Scoring analysis of MaxPro image. Red circles—paclitaxel; dark red squares—staurosporine; blue diamonds—doxorubicin; green triangles—mitomycin C; teal open circles—etoposide; purple open diamonds—fluoroadenine. Error bars represent  ±1 SD (n = 8).
<b>Fig. 7.</b>
Fig. 7.
Apoptosis assay. Spheroids were treated with indicated compounds for 42 h, then stained with Hoechst (blue) and caspase 3/7 (green) reagents. (A) Representative images and analysis of control and sample treated with 1 μM staurosporine. Nuclei are identified by a blue mask; Apoptotic cells are identified by a pink mask. (B) Dose-dependent increase of number of apoptotic cells in spheroids treated with 3 compounds: paclitaxel (green circles, IC50 = 9.5 nM), staurosporine (purple triangles, IC50 = 41.5 nM), and mitomycin C (red squares, IC50 = 6.01 μM). The content of apoptotic cells was ∼50% in the treated samples. Error bars represent ± 1 SD (n = 3).
<b>Fig. 8.</b>
Fig. 8.
IC50 values of 38 compounds from the small library screen of 119 approved anticancer drugs obtained from 4-parameter fits to calcein AM-positive cell readout over the range of tested concentrations.

References

    1. Kunz-Schughart LA, Freyer JP, Hofstaedter F, et al. : The use of 3-D cultures for high-throughput screening: the multicellular spheroid model. J Biomol Screen 2004;9:273–285 - PubMed
    1. Mueller-Klieser W. Three-dimensional cell cultures: from molecular mechanisms to clinical applications. Am J Physiol 1997;273:C1109–C1123 - PubMed
    1. Wartenberg M, Donmez F, Ling FC, et al. : Tumor-induced angiogenesis studied in confrontation cultures of multicellular tumor spheroids and embryoid bodies grown from pluripotent embryonic stem cells. FASEB J 2001;15:995–1005 - PubMed
    1. Frieboes HB, Zheng X, Sun CH, et al. : An integrated computational/experimental model of tumor invasion. Cancer Res 2006;66:1597–1604 - PubMed
    1. Wenzel C, Riefke B, Grundemann S, et al. : 3D high-content screening for the identification of compounds that target cells in dormant tumor spheroid regions. Exp Cell Res 2014;323:131–143 - PubMed

Substances