. 2015 Aug 28;10(8):e0136758.
doi: 10.1371/journal.pone.0136758. eCollection 2015.

Three Dimensional Culture of Human Renal Cell Carcinoma Organoids

Affiliations

Three Dimensional Culture of Human Renal Cell Carcinoma Organoids

Cynthia A Batchelder et al. PLoS One. .

Abstract

Renal cell carcinomas arise from the nephron but are heterogeneous in disease biology, clinical behavior, prognosis, and response to systemic therapy. Development of patient-specific in vitro models that efficiently and faithfully reproduce the in vivo phenotype may provide a means to develop personalized therapies for this diverse carcinoma. Studies to maintain and model tumor phenotypes in vitro were conducted with emerging three-dimensional culture techniques and natural scaffolding materials. Human renal cell carcinomas were individually characterized by histology, immunohistochemistry, and quantitative PCR to establish the characteristics of each tumor. Isolated cells were cultured on renal extracellular matrix and compared to a novel polysaccharide scaffold to assess cell-scaffold interactions, development of organoids, and maintenance of gene expression signatures over time in culture. Renal cell carcinomas cultured on renal extracellular matrix repopulated tubules or vessel lumens in renal pyramids and medullary rays, but cells were not observed in glomeruli or outer cortical regions of the scaffold. In the polysaccharide scaffold, renal cell carcinomas formed aggregates that were loosely attached to the scaffold or free-floating within the matrix. Molecular analysis of cell-scaffold constructs including immunohistochemistry and quantitative PCR demonstrated that individual tumor phenotypes could be sustained for up to 21 days in culture on both scaffolds, and in comparison to outcomes in two-dimensional monolayer cultures. The use of three-dimensional scaffolds to engineer a personalized in vitro renal cell carcinoma model provides opportunities to advance understanding of this disease.


Conflict of interest statement

Competing Interests: AFT holds shares in Molecular Matrix, Inc. There are no patents, products in development, or marketed products to declare. This does not alter the authors' adherence to all the PLOS ONE policies on sharing data and materials.

Figures

Fig 1
Fig 1. Relative gene expression in RCC tumor and non-tumor samples.
Gene expression relative to normal human kidney cDNA was calculated from RCC tumor (N = 22) and non-tumor (N = 18) samples and presented as the mean ± standard error of the mean (SEM); *p<0.05. Relative to grossly normal kidney, all genes were upregulated more than 2-fold except for LOX (downregulated) and SIX2 (upregulated 1.4 fold) in tumor samples. Expression was also upregulated in non-tumor samples for many genes. Differences between tumor and non-tumor samples were not significant with the exception of CA9 and LOX (p<0.05).
Fig 2
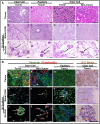
Fig 2. Phenotypic comparison of 3D RCC-scaffold constructs with parental tumor characteristics.
A. Hematoxylin and eosin (H&E) staining of parental tissue and corresponding RCC 3D constructs with renal ECM or polysaccharide scaffolds (PSS). Representative examples shown include clear cell (a-c) and papillary (d-f) RCC subtypes. Tumor (g-i) and non-tumor (j-l) tissue and 3D constructs from a single clear cell RCC-affected kidney are also shown. Regardless of tumor subtype, RCC typically repopulated medullary regions of the renal ECM, specifically the pyramids and medullary rays. RCC in the PSS were predominantly found as heterogeneous organoids (black arrows) that were free-floating within, or loosely attached to, the scaffold. B. Immunohistochemical staining for vimentin (green), cytokeratin (red), and the RCC Marker (brown). Representative examples are shown from clear cell tumor (a-c) and non-tumor (d-f) tissue from the same kidney; and papillary (g-i), and clear cell (j-l) RCC. Co-expression of cytokeratin and vimentin (white arrows) was noted in 70% of parental tumor tissues with remaining tissues vimentin-positive. Tumor-derived cell-scaffold constructs typically expressed the cytokeratin / vimentin staining pattern of the parental tissue, although increased vimentin expression was noted on renal ECM. Co-expression of these markers was only observed in parietal epithelial cells of Bowman’s capsule in histologically normal non-tumor tissues. In rare instances, non-tumor tissues contained tubules with double-positive cells (d). Strong RCC Marker (brown arrows) expression was observed in 90% of specimens, in proximal tubules of non-tumor tissue, and was maintained in some, but not all, 3D RCC constructs (k, l). Scale bars = 100 μm.
Fig 3
Fig 3. RCC organoid formation in 3D is dependent on scaffold type.
Non-parametric characterization of cell morphology in 3D tissue engineered constructs. Some constructs contained cells in more than one classification. Tumor (N = 15) and non-tumor (N = 8) cells were found as single cells or lining some tubules of the renal pyramid and medullary rays in 3D cell-renal ECM constructs. In the 3D PSS constructs, tumor (N = 22) and non-tumor (N = 8) cells were typically observed as loosely-attached organoid clusters, although some cells were found lining scaffold lumens. Scaffold impact on cell morphology was significant (p<0.001).
Fig 4
Fig 4. RCC gene expression signature is maintained over time in 3D, but not 2D, cultures.
Relative expression of selected tumor signature genes in tissue (tumor, non-tumor) and after 14 or 21 days in monolayer culture (2D plastic) or on 3D scaffolds (Renal ECM or PSS). PCR samples were run in triplicate to ensure accuracy with appropriate PCR reagents and negative transcriptase controls. Representative examples are shown from papillary (A) and clear cell (B, D) tumors, and non-tumor clear cell specimens (C). Because of the variation in gene expression signature from one biological replicate (e.g., patient sample) to the next, pooling of data was not appropriate. Instead, this analysis focused on the degree to which the original tumor or non-tumor gene expression pattern was maintained over time in culture across all patients (N = 22 tumor, N = 8 non-tumor 3D cultures). In all cases, expression of the signature gene set was more frequently maintained in 3D cultures. Differences in gene expression were not detected between renal ECM and the PSS. Despite strong expression in tumor tissues, expression of FABP7 was not maintained with any culture condition tested.

References

    1. Siegel R, Naishadham D, Jemal A. Cancer statistics, 2013. CA Cancer J Clin. 2013;63: 11–30. 10.3322/caac.21166 - DOI - PubMed
    1. NIH National Cancer Institute SEER Stat Fact Sheets: Kidney and Renal Pelvis Cancer. http://www.cancer.gov/researchandfunding/snapshots/kidney.
    1. Shuch B, Amin A, Armstrong AJ, Eble JN, Ficarra V, Lopez-Beltran A, et al. Understanding pathologic variants of renal cell carcinoma: Distilling therapeutic opportunities from biologic complexity. Eur Urol. 2015;67: 85–97. 10.1016/j.eururo.2014.04.029 - DOI - PubMed
    1. Ebert T, Bander NH, Finstad CL, Ramsawak RD, Old LJ. Establishment and characterization of human renal cancer and normal kidney cell lines. Cancer Res. 1990;50: 5531–5536. - PubMed
    1. Anglard P, Trahan E, Liu S, Latif F, Merino MJ, Lerman MI, et al. Molecular and cellular characterization of human renal cell carcinoma cell lines. Cancer Res. 1992;52: 348–356. - PubMed

Publication types