. 2015 Aug 28;11(8):e1005091.
doi: 10.1371/journal.ppat.1005091. eCollection 2015 Aug.

Inhibition of mTORC1 Enhances the Translation of Chikungunya Proteins via the Activation of the MnK/eIF4E Pathway

Affiliations

Inhibition of mTORC1 Enhances the Translation of Chikungunya Proteins via the Activation of the MnK/eIF4E Pathway

Pierre-Emmanuel Joubert et al. PLoS Pathog. .

Abstract

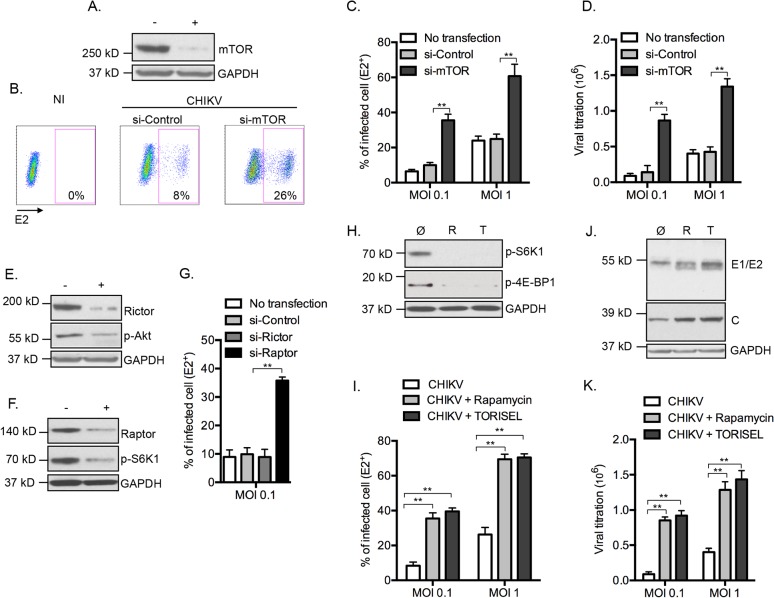
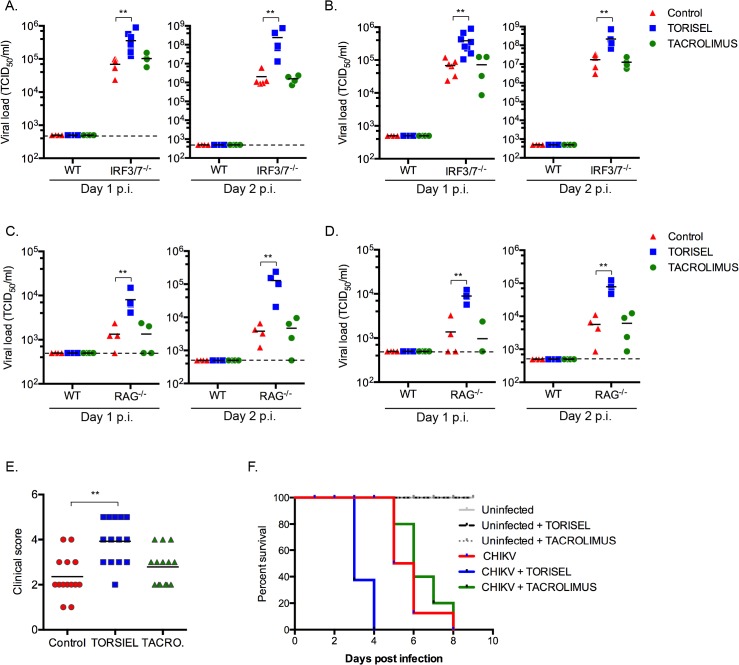
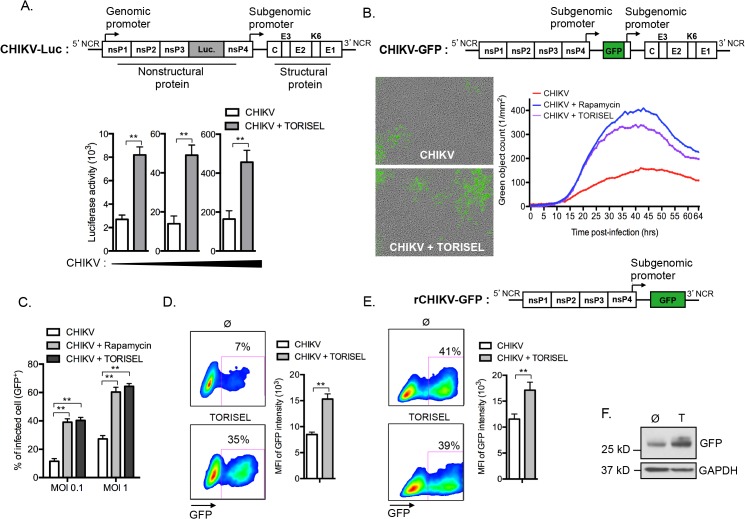
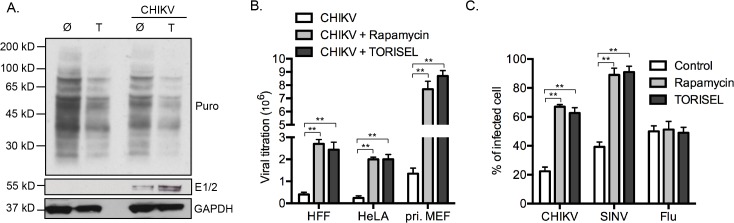
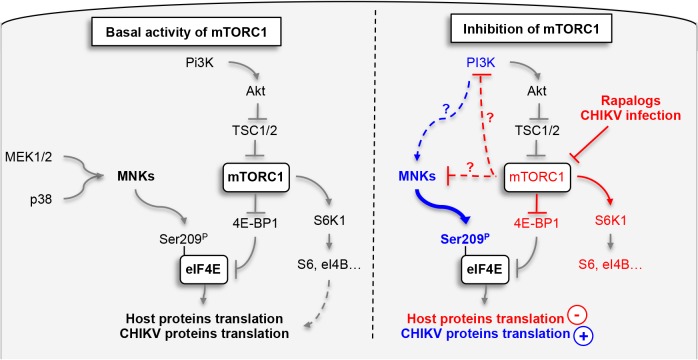
Chikungunya virus (CHIKV), the causative agent of a major epidemic spanning five continents, is a positive stranded mRNA virus that replicates using the cell's cap-dependent translation machinery. Despite viral infection inhibiting mTOR, a metabolic sensor controls cap-dependent translation, viral proteins are efficiently translated. Rapalog treatment, silencing of mtor or raptor genes, but not rictor, further enhanced CHIKV infection in culture cells. Using biochemical assays and real time imaging, we demonstrate that this effect is independent of autophagy or type I interferon production. Providing in vivo evidence for the relevance of our findings, mice treated with mTORC1 inhibitors exhibited increased lethality and showed a higher sensitivity to CHIKV. A systematic evaluation of the viral life cycle indicated that inhibition of mTORC1 has a specific positive effect on viral proteins, enhancing viral replication by increasing the translation of both structural and nonstructural proteins. Molecular analysis defined a role for phosphatidylinositol-3 kinase (PI3K) and MAP kinase-activated protein kinase (MnKs) activation, leading to the hyper-phosphorylation of eIF4E. Finally, we demonstrated that in the context of CHIKV inhibition of mTORC1, viral replication is prioritized over host translation via a similar mechanism. Our study reveals an unexpected bypass pathway by which CHIKV protein translation overcomes viral induced mTORC1 inhibition.


Conflict of interest statement

The authors have declared that no competing interests exist.

Figures

Fig 1
Fig 1. Inhibition of mTORC1 favors CHIKV infection.
(A-D) MEFs pretreated with mtor siRNA for 3d were infected by CHIKV at indicated MOI for 24h. (A) Western blot was performed 24h post-infection (p.i.) using anti-mTOR and anti-GAPD antibodies. Similar results were observed in four independent experiments. (B, C) The percentage of intracellular E2 staining was analyzed using an anti-E2 antibody, assessed using flow cytometer. Representative FACS data is shown (B), and results shown for MOI 0.1 and 1.0 (C). Greater than 10,000 cells were acquired. Bars indicate mean values ±SEM from five independent experiments. (D) Extracellular viral titers were determined at 24h p.i. and results were expressed as TCID50/ml. Bars indicate mean values ±SEM from four independent experiments. (E-G) MEFs pretreated with siRNA targeting rictor or raptor were infected by CHIKV (MOI = 0.1) for 24h. (E, F) Western blot was performed using anti-rictor, anti-raptor and anti-GAPD antibodies. Reduced activity of mTORC1 and mTORC2 was confirmed by following the phosphorylation on tyrosine 389 of S6K-1 (p-S6K1) and the phosphorylation on serine 473 of Akt (p-Akt), respectively. Similar results were observed in three independent experiments. CHIKV protein E2 was stained and the percentage of positive cells was determined and represented as graph (G). Bars indicate mean values ±SEM from three independent experiments. (H) MEFs were treated with Rapamycin (100 nM) or TORISEL (0.1 mg/ml) for 24h and reduced activity of mTORC1 was confirmed by following the phosphorylation on tyrosine 389 of S6K-1 (pS6K1) and the phosphorylation on serine 65 of 4E-BP1 (p-4E-BP1). Similar results were observed in five independent experiments. (I-K) MEFs were infected with CHIKV at indicated MOI for 24h in presence of Rapamycin (100 nM) or TORISEL (0.1 mg/ml). (I) The percentage of E2 positive cells is depicted. Bars indicate mean values ±SEM from five independent experiments. (J) Western blot was performed using antibodies against envelope proteins 1 and 2 (anti-E1/E2), nucleocapsid (anti-C) and GAPDH. Similar results were observed in two independent experiments. (K) Extracellular viral titers were determined at 24h p.i. Results were expressed as TCID50/ml. Bars indicate mean values ±SEM from four independent experiments. Student’s test **, P < 0.05. +, indicates si-mtor (A), si-rictor (E) and si-raptor (F);-, si-control; Ø, control buffer for inihibitor experiments; R, Rapamycin; T, TORISEL.
Fig 2
Fig 2. TORISEL favors CHIKV replication in infected tissues and enhances sensitivity of mice to infection.
(A-D) Wild-type (WT) or IRF3-/-/7-/- mice were treated with intra-peritoneal injection of 100 μL of solution containing TORISEL (10 mg/kg), tacrolimus (1 mg/kg) or PBS for 8 days followed by infection with 1 × 10⁵ PFU CHIKV, delivered subcutaneously. (A, C) Skin and (B, D) muscle were collected at indicated time points p.i., homogenized, and tested for viral titer. Median values for control (red), TORISEL (bueu) and tacrolimus (green) treatment are depicted. (E, F) IRF3-/-/7-/- mice were treated with intra-peritoneal injection of 100 μL of solution containing TORISEL (10 mg/kg), tacrolimus (1 mg/kg) or PBS. (E) 2 days p.i., clinical score was assessed using a scale developed by K. Racke (score (1) = no change; score (2) = mouse do not grasp the cage with toes but with the ankle; score (3) = mouse is unable to return and land on its feet when flipped over; score (4) = hind limbs drag behind during walking or are not used by the animal for movement; score (5) = premoribund status). Individual mice are shown; median value is indicated by bar ±SEM. (F) Mice were monitored for lethal CHIKV for 10 d with data displayed as Kaplan-Meier curves (n = 14 for control mice, for TORISEL-treated mice and for Tacrolimus-treated mice). Student’s test **, P < 0.05.
Fig 3
Fig 3. Rapalog treatment enhances viral replication.
(A) MEFs were pretreated with TORISEL (0.1 mg/ml) then infected with CHIKV for 1h at 4°C. Extracellular E2 staining was analyzed by flow cytometry. Representative E2 staining is shown by histogram. Similar results were obtained in four independent experiments. (B) MEFs were pretreated with Rapamycin (100 nM) or TORISEL (0.1 mg/ml) for 24h and then infected with CHIKV (MOI = 2) for 2h. Intracellular E2 staining was analyzed with similar results obtained in four independent experiments. (C) MEFs were infected with CHIKV using indicated MOI in presence or absence of TORISEL (0.1 mg/ml). Northern blots were performed using specific radioactive probes that recognize 49S genomic or 26S subgenomic mRNA of CHIKV. Similar results were observed in three independent experiments. (D-H) MEFs were infected with CHIKV for 24h with indicated MOI in presence of Rapamycin (100 nM) or TORISEL (0.1 mg/ml). Blue bars indicate the period of Rapalog exposure. At the end of Rapalog treatment, cells were washed and maintained in control media or analyzed using flow cytometer depending of the time point (D). (E-H) E2 positive cells were represented in graphs corresponding to the time points of Rapalog exposure: 1h pretreatment, prior to infection (E); treated 2h during CHIKV infection phase (F); treated post-infection for 22h (G); or treated 24h p.i. for an additional 24h (G). Bars indicate mean values ±SEM from three independent experiments. Student’s test **, P < 0.05. NS, non significant.
Fig 4
Fig 4. mTORC1 inhibitors enhance translation of both structural and non-structural CHIKV proteins.
(A) MEFs were infected with increasing doses of CHIKV-luciferase reporter construct in the presence of TORISEL. A schematic of the CHIKV-luciferase construct is depicted. Luciferase activity was measured 4h p.i. using luciferin and read-out on a luminometer. Bars indicate mean values ±SEM from three independent experiments. (B) A schematic of the CHIKV-GFP construct is illustrated. MEFs were infected with CHIK-GFP (MOI = 1) in the presence of Rapamycin (100 nM) or TORISEL (0.1 mg/ml). GFP positive cells were quantified using real time imaging. Images show GFP staining (used to define green object count) and curves plot the kinetics of infection. Similar results were obtained in seven independent experiments. (C) MEFs were infected with CHIKV-GFP for 24h at indicated MOI in presence of Rapamycin or TORISEL, and the percentage of GFP positive cells were determined. Similar results were observed in five independent experiments. (D) WT MEFs were infected with CHIKV-GFP (MOI = 1) for 24h in presence of TORISEL. Infected cells were gated according to GFP intensity and the MFI was plotted for infected cell populations. Bar indicate mean values ±SEM from three independent experiments. (E) A schematic of the single cycle rCHIKV-GFP construct is shown. MEFs were transfected with rCHIKV-GFP and after 24h TORISEL was added to the cultures. GFP positive cells were gated by flow cytometry and the MFI was plotted. Bars indicate mean values ±SEM from three independent experiments. (F) Cell lysates were prepared from rCHIKV-GFP transfected MEFs and Western blot was performed using anti-GFP and anti-GAPD antibodies. Similar results were observed in two independent experiments. Ø, control; T, TORISEL. Student’s test **, P < 0.05.
Fig 5
Fig 5. Enhanced protein translation during mTORC1 inhibition is specific for viral proteins.
(A) MEFs were infected with CHIKV (MOI = 1) in the presence of TORISEL for 24h (0.1 mg/ml) and labeled with puromycin (Puro) as detailed in the Methods section. Western blot was performed using anti-puromycin (clone 12D10), anti-E1/2 and anti-GAPD antibodies. Similar results were observed in three independent experiments. (B) HFF, HeLA or primary MEFs were infected with CHIKV (MOI = 0.1) in the presence of Rapamycin (100 nM) or TORISEL (0.1 mg/ml). Extracellular viral titers were determined 24h p.i. and results expressed as TCID50/ml. Bars indicate mean values ±SEM from four independent experiments. (C) MEFs were infected with CHIKV (MOI = 1), Sindbis expressing GFP (SINV; MOI = 0.1) or influenza A (Flu, 250 HAU106) for 24 h. The staining of E2, GFP and M2 proteins were analyzed using flow cytometry to quantify infection. Bars indicate mean values ±SEM from three independent experiments. Ø, control; T, TORISEL. Student’s test **, P < 0.05.
Fig 6
Fig 6. Inhibition of mTORC1 favors viral protein translation by activation of an MnK/p-eIF4E pathway.
(A) MEFs were infected with CHIKV (MOI = 5) in the presence of TORISEL (0.1 mg/ml) for 24h and eIF4E phosphorylation was assessed by Western blot. Band intensity of the p-eIF4E/GAPDH ratio calculated with numbers shown below the respective conditions. Similar results were observed in three independent experiments. (B) MEFs were pretreated with eif4e siRNA followed by CHIKV infection (MOI = 1) in presence of Rapamycin (10 nM) or TORISEL (0.1 mg/ml). Percentage of E2 positive cells was measured 24 p.i.. Bars indicate mean values ±SEM from three independent experiments. (C) MEFs were infected with CHIKV (MOI = 5) in presence of TORISEL (T) and/or an MnK1/2 inhibitor (CGP57380, 20 μM) for 24h and Western blot analysis was performed to detect phosphorylation of eIF4E at serine 209 (p-eIF4E (S209)). eIF4E and GAPDH were measured to control protein expression and loading. Band intensity of the p-eIF4E / GAPDH ratio is reported. (D) MEFs were infected with CHIKV-GFP (MOI = 1) in the presence of TORISEL and/or indicated dose of an MnK1/2 inhibitor (CGP57380). GFP positive cells were analyzed 24 p.i. using real time imaging. Results represent the fold induction of GFP positive cells observed in TORISEL treated cells, as compared to untreated cells. Bars indicate mean values ±SEM from three independent experiments. (E) MEFs were infected with increasing doses of CHIKV-Luc in presence of TORISEL ± MNKs inhibitor II (MNK1/2 inhi. – 5 μM) and luciferase activity was measured at 4h p.i. Bars indicate mean values ±SEM from three independent experiments. (F) MEFs were infected with CHIKV (MOI = 5) for 24h in presence of TORISEL ± MEKs inhibitor (PD0325901, 1 μg/ml), an p38 MAPK inhibitor (SB203580, 1 μM) or an PI3K inhibitor (LY294002, 25 μM) and eIF4E phosphorylation was followed by Western blot. p-eIF4E / GAPDH band intensity is reported. Similar results were observed in three independent experiments. (G) MEFs were infected with CHIKV (MOI = 1) for 24h using the inhibitors described in (E). Results represent the fold induction of E2 positive cells observed in TORISEL treated cells, as compared to untreated cells. Bar indicate mean values ±SEM from three independent experiments. (H, I) MEFs were pretreated with siRNA specific for mtor, s6k1 or 4e-bp1 followed by CHIKV infection (MOI = 1) in presence of TORISEL. Western blot was performed 24h p.i. using anti-mTOR, anti-S6K1 and anti-4E-BP1 antibodies (H). Additionally, the fold induction of E2 positive cells is shown. Bars indicate mean values ±SEM from three independent experiments (I). Ø means control; T means TORISEL. +, indicates respective siRNA knock-down;-, indicates si-control. Student’s test **, P < 0.05.
Fig 7
Fig 7. CHIKV-induced mTORC1 inhibition favors infection through the MnK/p-eIF4E pathway.
(A) MEF were infected with CHIKV (MOI = 5) and phosphorylation of S6K1 and eIF4E was assessed by Western blot at indicated times post-infection. Band intensities for p-S6k1 and p-eIF4E were normalized to t = 0 and as a function of time (red line, p-eIF4E, blue line, p-S6K1). Bars indicate mean values ±SEM from three independent experiments. (B) MEF were infected with CHIKV (MOI = 5) in presence of ROS inhibitor (N-acetyl-L-cysteine) and phosphorylation of S6K1 and eIF4E was followed as in (A). (C) MEF were infected with CHIKV (MOI = 5) in presence of an MnK inhibitor (MnK1/2 inhi. – 5 μM) or PI3K inhibitor (LY294002, 25 μM) and phosphorylation of eIF4E was followed at 6h p.i.. Band intensity for p-eIF4E normalized to t = 0. Bars indicate mean values ±SEM from three independent experiments. (D, E) MEFs were infected with CHIKV at indicated MOI in the presence of MnK inhibitor (MnK1/2 inhi. – 5 μM) or PI3K inhibitor (LY294002, 25 μM), and the percentage of intracellular E2 staining was analyzed at 24h p.i. using an anti-E2 and monitored by FACS analysis. Bars indicate mean values ±SEM from four independent experiments (D). In parallel, MEFs were infected with CHIKV-GFP (MOI = 1) and GFP positive cells were followed using real time imaging. Similar results were obtained in five independent experiments (E). (F) MEFs were infected with CHIKV-Luc (MOI = 1) in presence of MnK inhibitor or PI3K inhibitor. Luciferase activity was determined at 6h p.i.. Bars indicate mean values ±SEM from three independent experiments. Ø, control. Student’s test **, P < 0.05.
Fig 8
Fig 8. Schematic representation of mechanism by which CHIKV protein synthesis is increase by the inhibition of mTORC1.
Grey lines indicate pathways known in the literature; blue and red lines highlight respectively activation and inhibition pathways characterized in this study. Indirect molecular connections are indicated by dotted lines.

Similar articles

Cited by

References

    1. The 2005–2007 Chikungunya epidemic in Réunion: ambiguous etiologies, memories, and meaning-making. (2013) The 2005–2007 Chikungunya epidemic in Réunion: ambiguous etiologies, memories, and meaning-making. 32: 174–189. Available: http://www.tandfonline.com/doi/abs/10.1080/01459740.2012.679981. 10.1080/01459740.2012.679981 - DOI - DOI - PubMed
    1. Chikungunya outbreak in bueng kan province, Thailand, 2013. (2014) Chikungunya outbreak in bueng kan province, Thailand, 2013. 20: 1404–1406. Available: http://eutils.ncbi.nlm.nih.gov/entrez/eutils/elink.fcgi?dbfrom=pubmed&id.... 10.3201/eid2008.140481 - DOI - PMC - PubMed
    1. Re-emergence of chikungunya virus. (2014) Re-emergence of chikungunya virus.: JVI.01432–14. Available: http://jvi.asm.org/cgi/doi/10.1128/JVI.01432-14. - DOI - PMC - PubMed
    1. Notes from the field: chikungunya virus spreads in the Americas—Caribbean and South America, 2013–2014. (2014) Notes from the field: chikungunya virus spreads in the Americas—Caribbean and South America, 2013–2014. 63: 500–501. Available: http://eutils.ncbi.nlm.nih.gov/entrez/eutils/elink.fcgi?dbfrom=pubmed&id.... - PMC - PubMed
    1. Proteomic analysis of chikungunya virus infected microgial cells. (2012) Proteomic analysis of chikungunya virus infected microgial cells. 7: e34800 Available: http://dx.plos.org/10.1371/journal.pone.0034800. 10.1371/journal.pone.0034800 - DOI - DOI - PMC - PubMed

Publication types

MeSH terms

Substances