. 2015 Sep;45(5):581-96.
doi: 10.1007/s10519-015-9732-8. Epub 2015 Aug 29.

Nonparametric Estimates of Gene × Environment Interaction Using Local Structural Equation Modeling

Affiliations

Nonparametric Estimates of Gene × Environment Interaction Using Local Structural Equation Modeling

Daniel A Briley et al. Behav Genet. 2015 Sep.

Abstract

Gene × environment (G × E) interaction studies test the hypothesis that the strength of genetic influence varies across environmental contexts. Existing latent variable methods for estimating G × E interactions in twin and family data specify parametric (typically linear) functions for the interaction effect. An improper functional form may obscure the underlying shape of the interaction effect and may lead to failures to detect a significant interaction. In this article, we introduce a novel approach to the behavior genetic toolkit, local structural equation modeling (LOSEM). LOSEM is a highly flexible nonparametric approach for estimating latent interaction effects across the range of a measured moderator. This approach opens up the ability to detect and visualize new forms of G × E interaction. We illustrate the approach by using LOSEM to estimate gene × socioeconomic status interactions for six cognitive phenotypes. Rather than continuously and monotonically varying effects as has been assumed in conventional parametric approaches, LOSEM indicated substantial nonlinear shifts in genetic variance for several phenotypes. The operating characteristics of LOSEM were interrogated through simulation studies where the functional form of the interaction effect was known. LOSEM provides a conservative estimate of G × E interaction with sufficient power to detect statistically significant G × E signal with moderate sample size. We offer recommendations for the application of LOSEM and provide scripts for implementing these biometric models in Mplus and in OpenMx under R.


Conflict of interest statement

Conflict of Interests

All authors declare that they have no conflict of interest.

Figures

Figure 1
Figure 1
Path diagrams representing each type of G×E model. In all models, latent additive genetic (A), shared environmental (C), and nonshared environmental (E) factors with are estimated for a phenotype for twin1 (Y1) and a phenotype for twin2 (Y2). The A factors correlate at 1.0 for monozygotic twins and at 0.5 for dizygotic twins. The C factors correlate at 1.0, and the E factors are uncorrelated. A. Categorical G×E in which separate parameters are estimated for low risk (al, cl, el, and μl) and high risk (ah, ch, eh, and μh) environments. B. Parametric G×E model in which the focal pathways are specified to be a linear combination of parameters representing main effects (a, c, e) and interaction terms (a′, c′, and e′) of the ACE components with the moderator (M). The main effect of M is represented as a “moderated mean” (b1). The intercept of the phenotype is also estimated (b0). C. Nonparametric LOSEM G×E model in which local parameters for each level of the moderator are estimated (âM, ĉM, êM, μ^M), noting the circumflex refers to the fact that these parameters are based on weighted data rather than data precisely at the level of M. The subscript [−m…0…+m] refers to the fact that the parameters are actually vectors that include weighted estimates from a lower bound of M to an upper bound of M.
Figure 2
Figure 2
Example distributions of weighting variable (y-axis) at three target levels of the moderator (x-axis). Data closer to the target level of the moderator carries more weight in the analysis. The distribution around the target is smaller with larger sample size and smaller standard deviation of the moderator. A. Distribution for the current analysis based on data from ECLS-B (N = 650, SD = 1). B. Distribution for hypothetical analysis based on data from ECLS-B with ten times the number of participants.
Figure 3
Figure 3
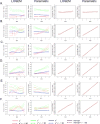
Comparison of LOSEM and parametric gene × socioeconomic status results for cognitive ability measures from ECLS-B. A. Age 10 months Bayley. B. Age 2 years Bayley. C. Age 4 years Math Achievement. D. Age 4 years Reading Achievement. E. Kindergarten Math Achievement. F. Kindergarten Reading Achievement.
Figure 4
Figure 4
LOSEM, linear parametric, and nonlinear parametric model for Kindergarten reading achievement.
Figure 5
Figure 5
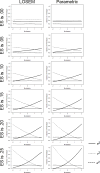
Average model parameters for LOSEM and a parametric model across 100 datasets for interaction effect sizes (ES) ranging from .00 to .25. All datasets included 1000 twin pairs.
Figure 6
Figure 6
Power curves for parametric and nonparametric tests of G×E interaction for differing interaction effect sizes. All datasets included 1000 twin pairs.
Figure 7
Figure 7
Average model parameters for LOSEM, a linear parametric model (mis-specified), and a properly specified parametric model. All datasets included 1000 twin pairs.

References

    1. Asparouhov T. Sampling weights in latent variable modeling. Struct Equ Modeling. 2005;12(3):411–434.
    1. Benjamin Y, Hochberg Y. Controlling the false discovery rate: A practical and powerful approach to multiple testing. J R Stat Soc Series B Stat Methodol. 1995;57(1):289–300.
    1. Boker S, Neale M, Maes H, Wilde M, Spiegel M, Brick T, Fox J. OpenMx: An open source extended structural equation modeling framework. Psychometrika. 2011;76:306–317. - PMC - PubMed
    1. Bowman AW. An alternative method of cross-validation for the smoothing of density estimates. Biometrika. 1984;71:353–360.
    1. Briley DA, Harden KP, Tucker-Drob EM. Genotype × cohort interaction on completed fertility and age at first birth. Behav Genet. 2015;45:71–83. - PMC - PubMed

Publication types

LinkOut - more resources