. 2015 Nov;14(11):1081-93.
doi: 10.1128/EC.00094-15. Epub 2015 Aug 28.

A MORN Repeat Protein Facilitates Protein Entry into the Flagellar Pocket of Trypanosoma brucei

Affiliations

A MORN Repeat Protein Facilitates Protein Entry into the Flagellar Pocket of Trypanosoma brucei

Brooke Morriswood et al. Eukaryot Cell. 2015 Nov.

Abstract

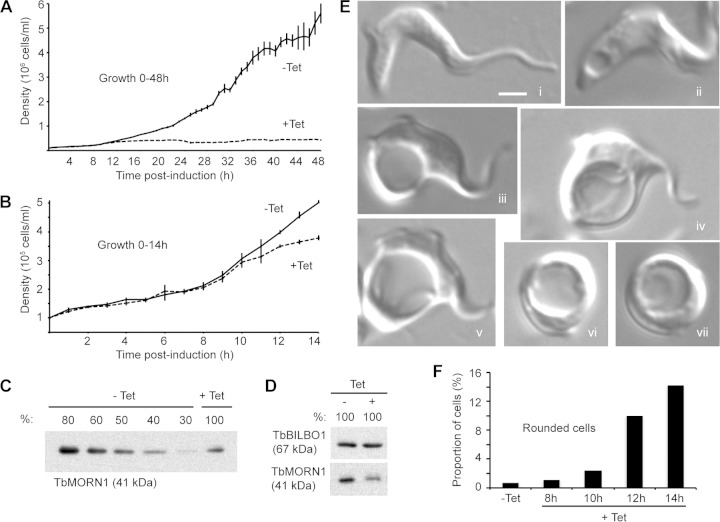
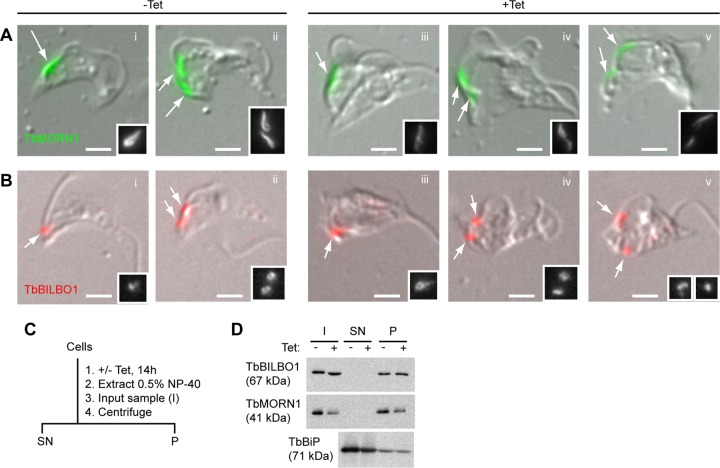
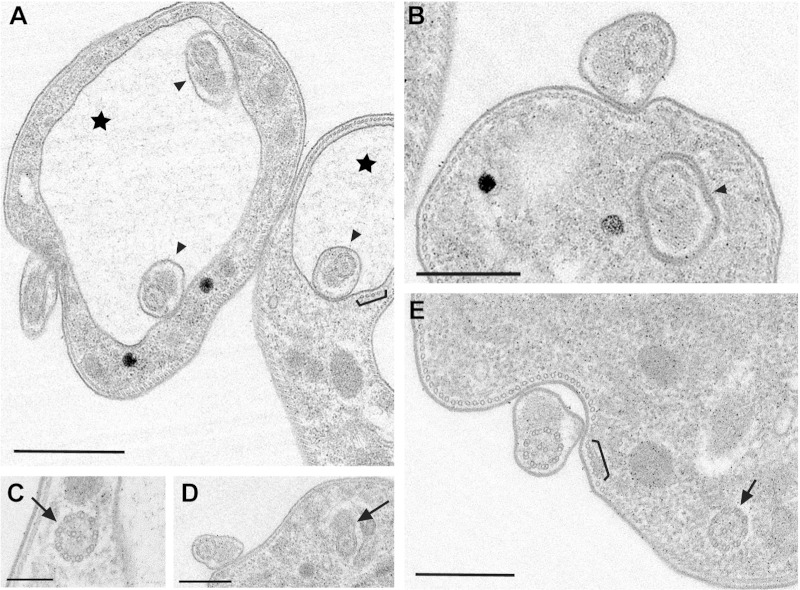
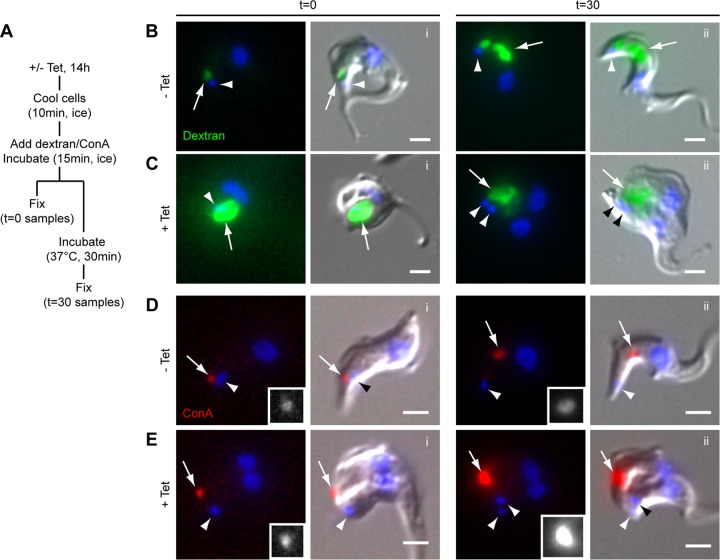
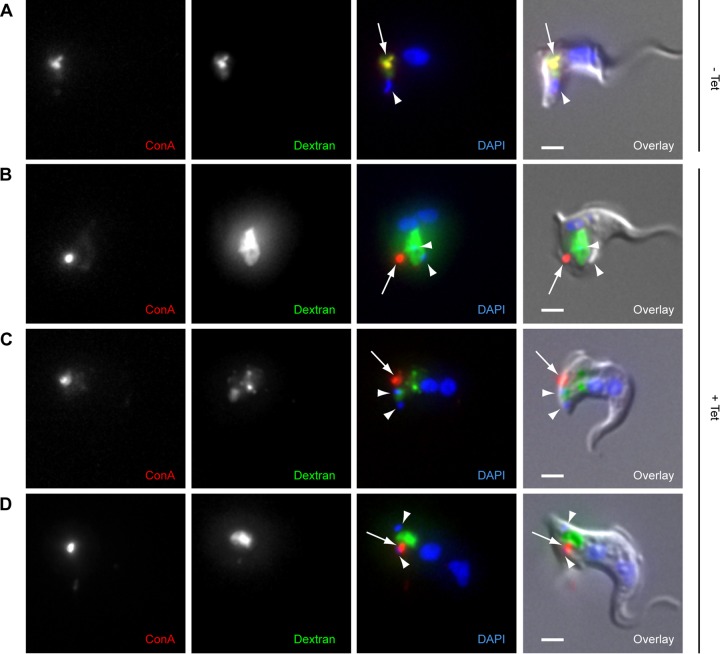
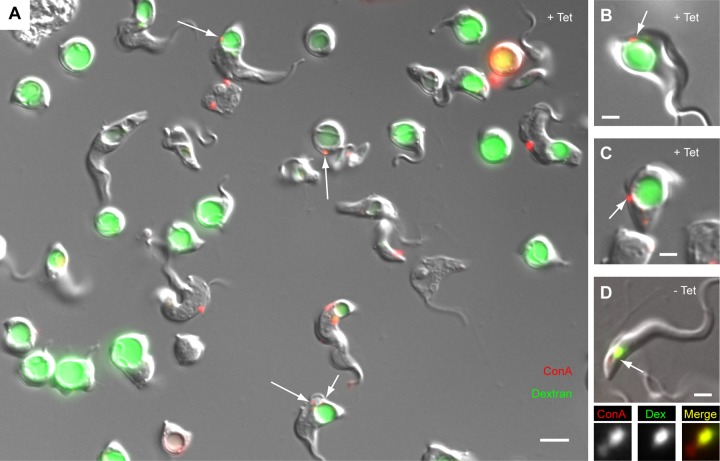
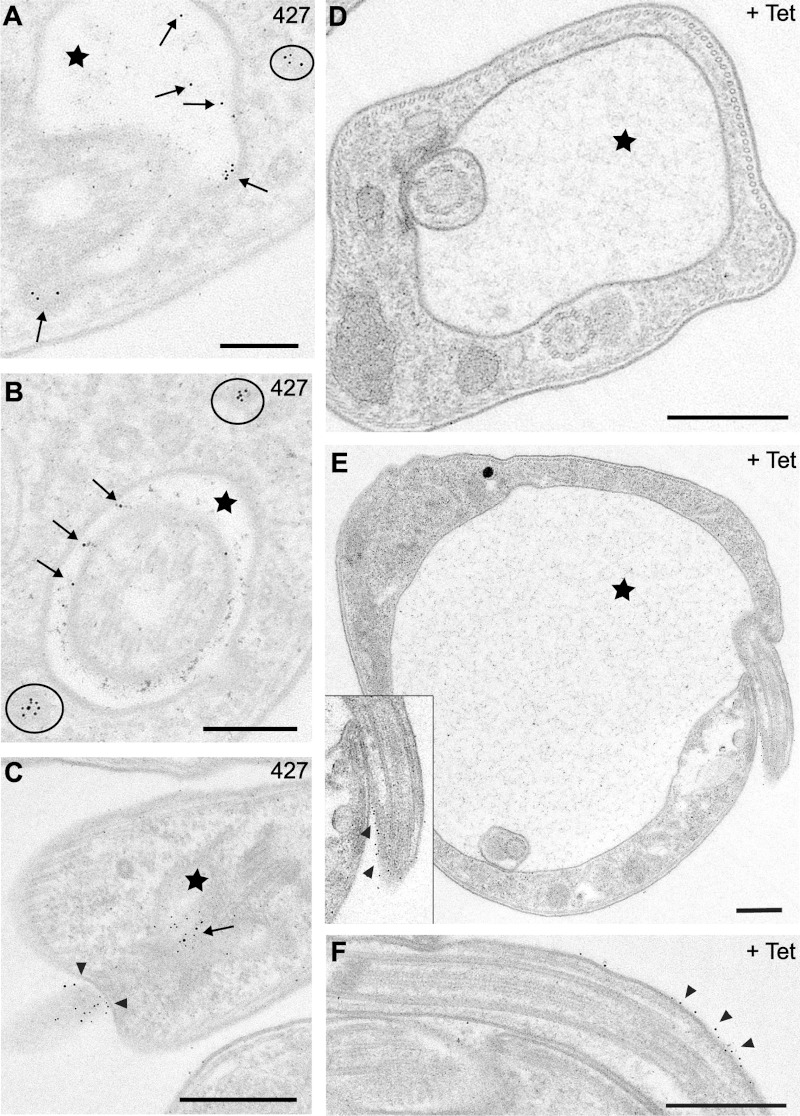
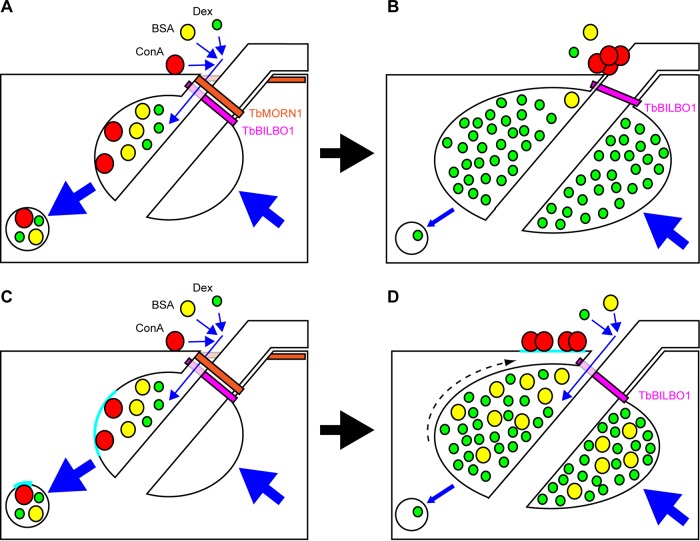
The parasite Trypanosoma brucei lives in the bloodstream of infected mammalian hosts, fully exposed to the adaptive immune system. It relies on a very high rate of endocytosis to clear bound antibodies from its cell surface. All endo- and exocytosis occurs at a single site on its plasma membrane, an intracellular invagination termed the flagellar pocket. Coiled around the neck of the flagellar pocket is a multiprotein complex containing the repeat motif protein T. brucei MORN1 (TbMORN1). In this study, the phenotypic effects of TbMORN1 depletion in the mammalian-infective form of T. brucei were analyzed. Depletion of TbMORN1 resulted in a rapid enlargement of the flagellar pocket. Dextran, a polysaccharide marker for fluid phase endocytosis, accumulated inside the enlarged flagellar pocket. Unexpectedly, however, the proteins concanavalin A and bovine serum albumin did not do so, and concanavalin A was instead found to concentrate outside it. This suggests that TbMORN1 may have a role in facilitating the entry of proteins into the flagellar pocket.


Figures

FIG 1
FIG 1
Depletion of TbMORN1 is rapidly lethal and is associated with distinct morphological alterations. (A) Growth curves of TbMORN1 RNAi cells in the first 48 h after induction. Uninduced control (−Tet) cells exhibited robust growth. Cells in which TbMORN1-directed RNAi had been induced (+Tet) rapidly cease growth. Cell death (lysis) was confirmed visually. Population density was measured every hour, and each data point was obtained in at least four independent inductions. Data are presented as means ± SEM. (B) Magnification of the data shown in panel A in the 0- to 14-h range. A clear difference in the population densities of uninduced (−Tet) and induced (+Tet) cells was visible 12 h after induction of TbMORN1-directed RNAi. (C) Immunoblotting using anti-TbMORN1 antibodies confirmed depletion of TbMORN1. A representative immunoblot (13-h point) is shown. Diluted whole-cell lysates of uninduced (−Tet) cells were compared with an undiluted (100%) sample from induced (+Tet) cells. TbMORN1 levels were reduced by approximately 50% relative to the uninduced controls. (D) Confirmation that whole-cell lysates from uninduced (−Tet) and induced (+Tet) cells were comparable in protein concentration. Lysates were probed with anti-TbBILBO1 and anti-TbMORN1 antibodies. TbMORN1 levels show depletion; TbBILBO1 levels confirm equivalent concentrations. (E) Examples of morphological alterations observed in live TbMORN1-depleted (+Tet) cells (14-h point). All images are shown at the same magnification. Scale bar, 2 μm. (F) The number of rounded cells increased rapidly following TbMORN1 depletion. Quantification of rounded cells was carried out after fixation using isothermal glutaraldehyde at the indicated time points and is expressed as a fraction of the total population. Data were obtained from three independent experiments (n > 250 cells for each time point).
FIG 2
FIG 2
Imaging and biochemical analysis of TbMORN1-depleted cells. (A and B) TbMORN1 RNAi cells from uninduced (−Tet) and induced (+Tet, 14-h point) populations were extracted with detergent, fixed, and labeled with the indicated antibodies. Immunofluorescence images were acquired using identical exposure times and are shown superimposed on differential interference contrast (DIC) images. Greyscale insets reproduce the structures indicated by arrows. Scale bars, 2 μm. (A) TbMORN1 labeling is reduced in +Tet populations. (B) TbBILBO1 localization and signal intensity seem unchanged in +Tet populations. (C) Schematic of the biochemical fractionation protocol. After extraction in 0.5% NP-40, an input sample (I) was taken. Centrifugation was used to separate the soluble cytoplasmic supernatant (SN) from the insoluble cytoskeletal pellet (P). (D) Immunoblotting of samples from biochemical fractionation (14-h point). I, SN, P samples are as defined for panel C. Equal fractions (2.5% of total; equal to ∼106 cells in I sample) were loaded in each lane. Three independent experiments were carried out; a representative immunoblot is shown.
FIG 3
FIG 3
Ultrastructural phenotype of TbMORN1-depleted cells. Shown are common morphological characteristics of TbMORN1-depleted cells (14-h point). Images were taken from 60-nm-thick resin sections contrasted with uranyl acetate and lead citrate. (A) Enlarged vacuoles (stars) and multiple axonemes with PFRs inside the pocket (arrowheads). The microtubule quartet seems unaffected (bracket; also in panel E). (B) Axoneme with PFR inside the flagellar neck region (arrowhead). (C to E) Intracellular axonemes with and without PFR (arrows). Scale bars: 1 μm (A and D), 500 nm (B and E), and 200 nm (C).
FIG 4
FIG 4
Dextran (20-Å diameter) appears to accumulate in the enlarged flagellar pocket of TbMORN1-depleted cells, while ConA (80-Å diameter) does not. (A) Schematic of the uptake protocol. (B) Uptake of fluorophore-conjugated dextran (green) in control cells. DNA is labeled with DAPI (blue). The left side of each pair shows the fluorescence image; the right side shows the DIC overlay. At 0 min, dextran (arrow) exhibited a round labeling pattern adjacent to the kinetoplast (arrowhead). At 30 min, robust uptake of dextran into the region of the cell corresponding to the endosomal-lysosomal system was observed. (C) Accumulation of fluorophore-conjugated dextran in TbMORN1-depleted cells. At 0 min, a large accumulation of dextran could be observed in the region of the cell corresponding to the enlarged FP. The label was observed to persist in this region at 30 min. Data were obtained from three independent experiments. (D) Uptake of fluorophore-conjugated ConA (red) in control cells. The labeling pattern is similar to that seen for dextran. The ConA signal (arrows) is shown enlarged in greyscale in the insets. (E) Accumulation of ConA after TbMORN1 depletion. At 0 min, ConA was found in a punctate accumulation (arrow) some distance from the kinetoplast (arrowhead). The distribution did not change at 30 min. Data were obtained from three independent experiments, and cells were imaged using the same exposure times for −Tet and +Tet samples. Scale bars, 2 μm.
FIG 5
FIG 5
Loss of overlap between dextran (20-Å diameter) and ConA (80-Å diameter) in TbMORN1-depleted cells. TbMORN1 RNAi cells from uninduced (−Tet) or induced (+Tet, 14-h point) populations were incubated simultaneously with fluorophore-conjugated ConA (red) and dextran (green) for 30 min at 37°C and then fixed. DNA was labeled with DAPI. (A) Uninduced cells showed strong overlap between the two signals in the region of the cell corresponding to the endosomal-lysosomal system. (B to D) TbMORN1-depleted cells show a loss in overlap between the two signals. ConA (arrows) showed a small punctate accumulation, dextran a larger and more amorphous accumulation. Kinetoplasts (sometimes partially obscured by the dextran signal) are indicated with arrowheads. Data were obtained from three independent experiments. Scale bars, 2 μm.
FIG 6
FIG 6
Loss of overlap between dextran (20-Å diameter) and ConA (80-Å diameter) in unfixed TbMORN1-depleted cells. TbMORN1 RNAi cells from uninduced or induced (14-h point) populations were incubated simultaneously with fluorophore-conjugated ConA (red) and dextran (green) for 30 min at 37°C and analyzed directly. Immunofluorescence images are shown superimposed on DIC images. (A) Representative field of view from a population of TbMORN1-depleted cells. The labeling patterns recapitulate those seen in fixed cells. Dextran was found inside the enlarged FP. The ConA signal could frequently be observed in punctate accumulations (arrows) as seen in fixed cells. Scale bar, 5 μm. (B and C) Two more examples from the induced population. The ConA accumulation (arrow) matches that seen in fixed cells. (D) A cell from the uninduced population. Both labels show a good degree of overlap. The labeled area indicated with the arrow is shown in the insets below. Scale bars: 5 μm (A) and 2 μm (B to D).
FIG 7
FIG 7
Reduced uptake of BSA-gold (>100-Å diameter) in TbMORN1-depleted cells. Images were taken from 60-nm-thick resin sections contrasted with uranyl acetate and lead citrate of trypanosome cells after incubation with BSA-gold (5 nm; 14-h point). Arrows indicate particles of BSA-gold inside the FP, circles show vesicles containing gold particles, and arrowheads point at gold particles at the FP entrance and flagellum; FPs are labeled with stars. (A to C) Efficient BSA-gold uptake and accumulation within the FP was observed in 427 wild-type cells. (D and E) Enlarged FPs of +Tet cells rarely contained any BSA-gold. (E and F) Extracellular gold particles (arrowheads) were often found just outside the pocket at the flagellum. The relevant area of panel E is enlarged in the inset. Scale bars: 200 nm (A and B) and 500 nm (C to F).
FIG 8
FIG 8
Summary of observations and two possible interpretations. Shown are schematic representations of the posterior end of a trypanosome cell in longitudinal cross-section. The FPC is depicted in magenta (TbBILBO1). The TbMORN1 macromolecular complex is shown as an orange fishhook above the FPC. Dextran, BSA, and ConA are depicted, respectively, as green, yellow, red circles. Blue arrows indicate movement. Endocytosis and secretion are represented by large blue arrows. (A) Model 1. In uninduced cells, dextran, BSA, and ConA enter the FP (small blue arrows) and are taken up by endocytosis and trafficked to the endosomal-lysosomal system in transport vesicles. The secretory pathway returns membrane to the FP. (B) Following TbMORN1-directed RNAi, the FPC is intact but TbMORN1 is largely absent. BSA (fluid phase) and ConA (membrane bound) can no longer efficiently access the FP, and ConA accumulates close to the point of flagellum entry. Dextran can still access the FP and accumulates inside it. The rate of endocytosis is reduced (small blue arrow), while secretion is unaffected. (C) Model 2. The situation is the same as that depicted in model 1, except for the behavior of ConA. Here, ConA binds exclusively to glycoproteins present either within or adjacent to the FP in a defined patch (cyan, here shown inside the FP). (D) Following depletion of TbMORN1, the maintenance of subdomains is lost and the ConA-binding glycoprotein patch is displaced outside the FP (dashed arrow), where it accumulates ConA. The rate of endocytosis is reduced as in model 1, leading to an enlargement of the FP and an accumulation of both dextran and BSA within it.

References

    1. Gull K. 1999. The cytoskeleton of trypanosomatid parasites. Annu Rev Microbiol 53:629–655. doi:10.1146/annurev.micro.53.1.629. - DOI - PubMed
    1. Wheeler RJ, Gluenz E, Gull K. 2013. The limits on trypanosomatid morphological diversity. PLoS One 8:e79581. doi:10.1371/journal.pone.0079581. - DOI - PMC - PubMed
    1. Robinson DR, Sherwin T, Ploubidou A, Byard EH, Gull K. 1995. Microtubule polarity and dynamics in the control of organelle positioning, segregation, and cytokinesis in the trypanosome cell cycle. J Cell Biol 128:1163–1172. doi:10.1083/jcb.128.6.1163. - DOI - PMC - PubMed
    1. Lacomble S, Vaughan S, Gadelha C, Morphew MK, Shaw MK, McIntosh JR, Gull K. 2009. Three-dimensional cellular architecture of the flagellar pocket and associated cytoskeleton in trypanosomes revealed by electron microscope tomography. J Cell Sci 122:1081–1090. doi:10.1242/jcs.045740. - DOI - PMC - PubMed
    1. Grünfelder CG, Engstler M, Weise F, Schwarz H, Stierhof YD, Morgan GW, Field MC, Overath P. 2003. Endocytosis of a glycosylphosphatidylinositol-anchored protein via clathrin-coated vesicles, sorting by default in endosomes, and exocytosis via RAB11-positive carriers. Mol Biol Cell 14:2029–2040. doi:10.1091/mbc.E02-10-0640. - DOI - PMC - PubMed

Publication types

MeSH terms

Substances

LinkOut - more resources