. 2015 Oct 9;290(41):25072-80.
doi: 10.1074/jbc.M115.682369. Epub 2015 Aug 28.

Transient Kinetic Analysis of Hydrogen Sulfide Oxidation Catalyzed by Human Sulfide Quinone Oxidoreductase

Affiliations

Transient Kinetic Analysis of Hydrogen Sulfide Oxidation Catalyzed by Human Sulfide Quinone Oxidoreductase

Tatiana V Mishanina et al. J Biol Chem. .

Abstract

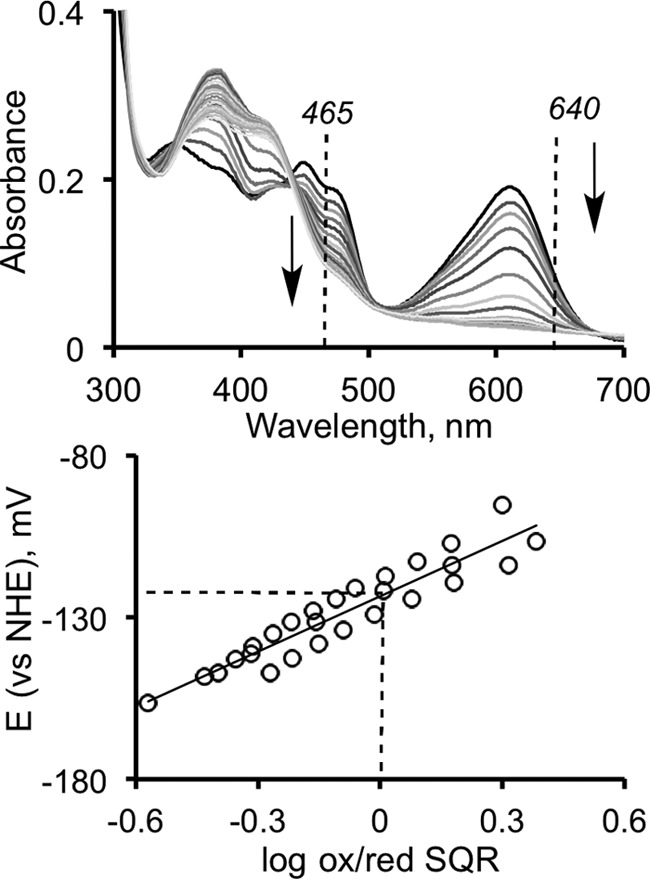
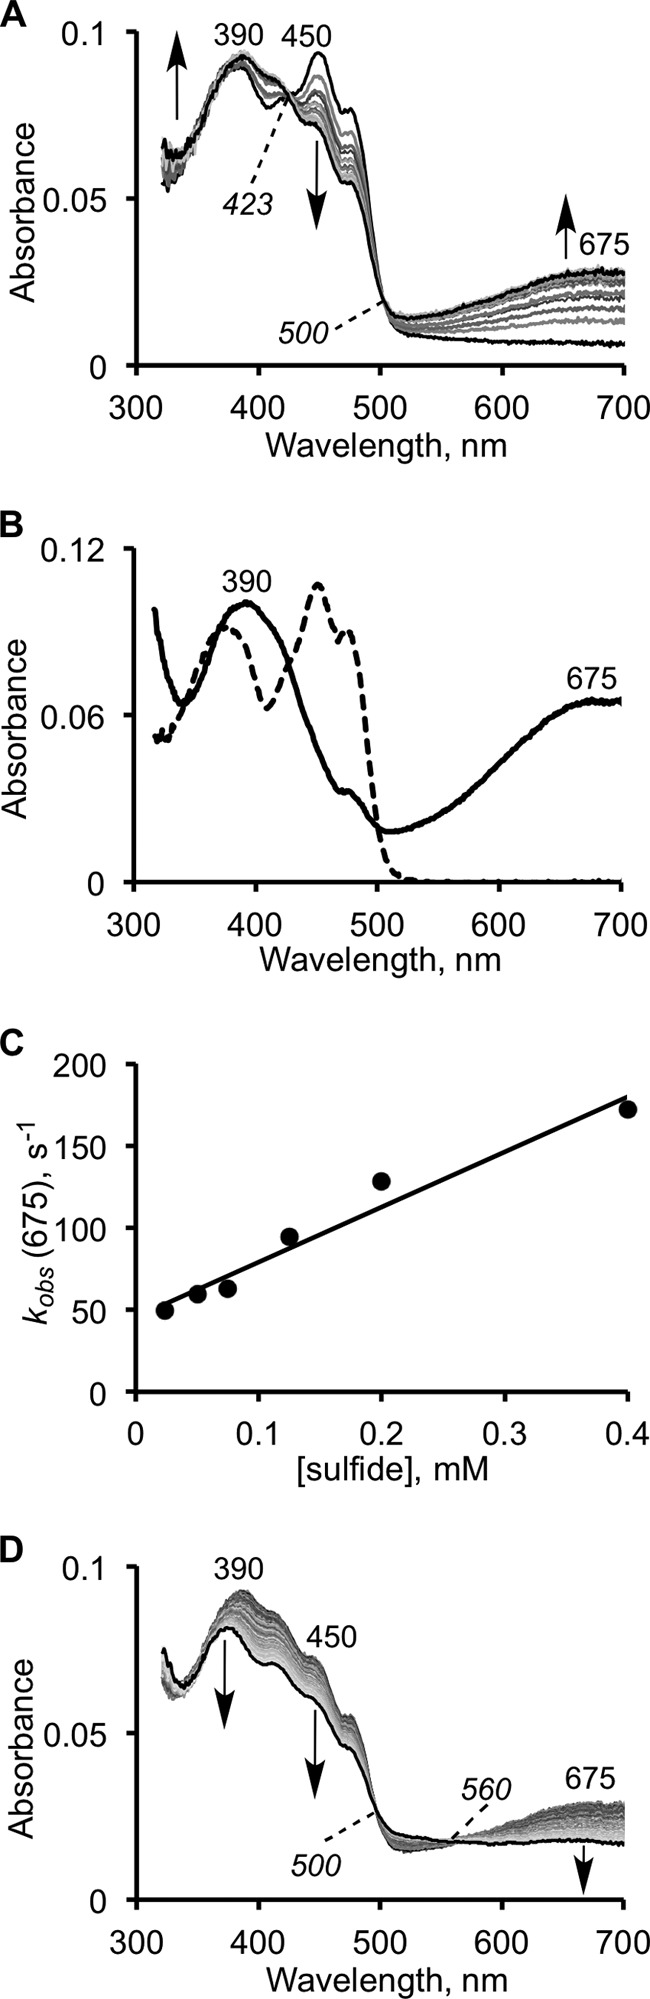
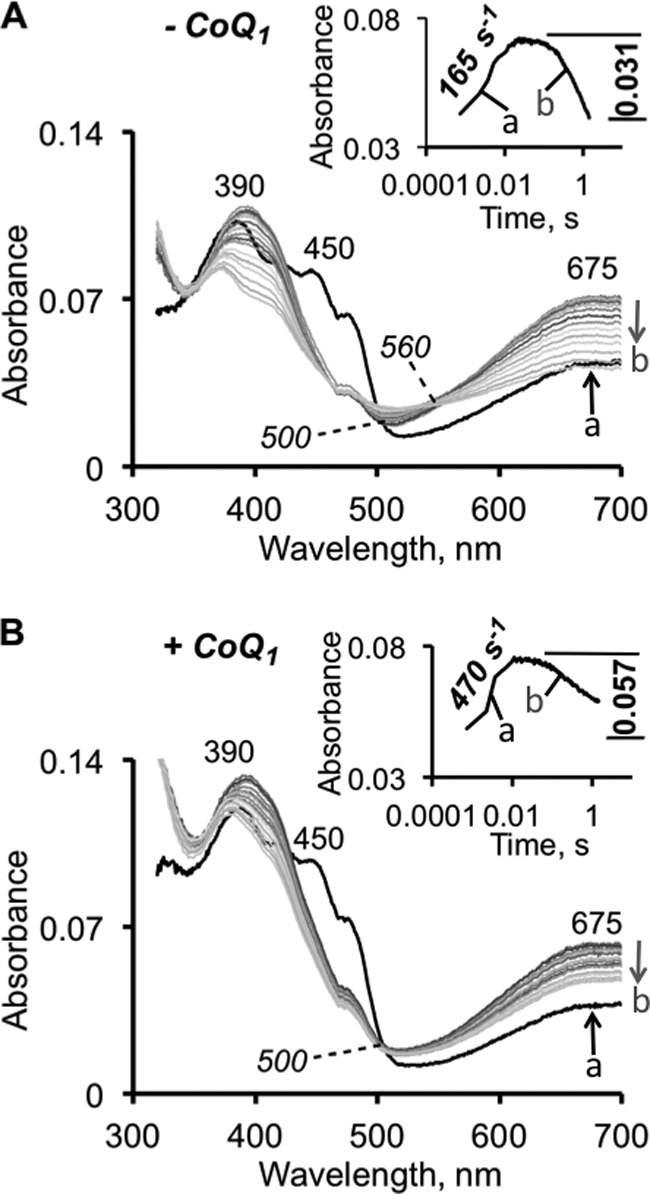
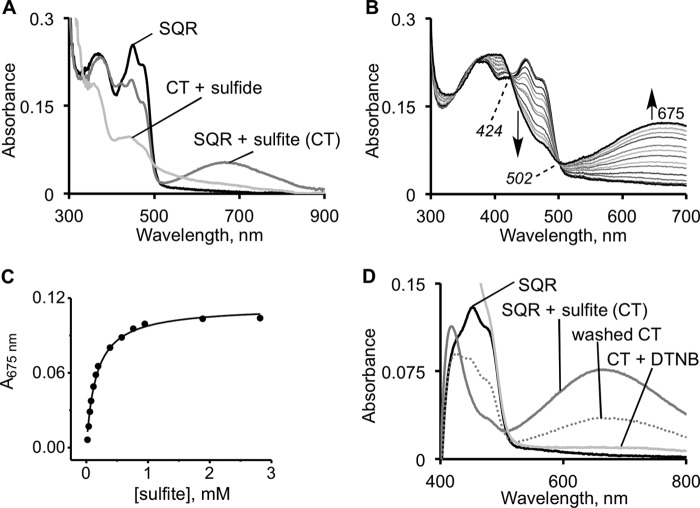
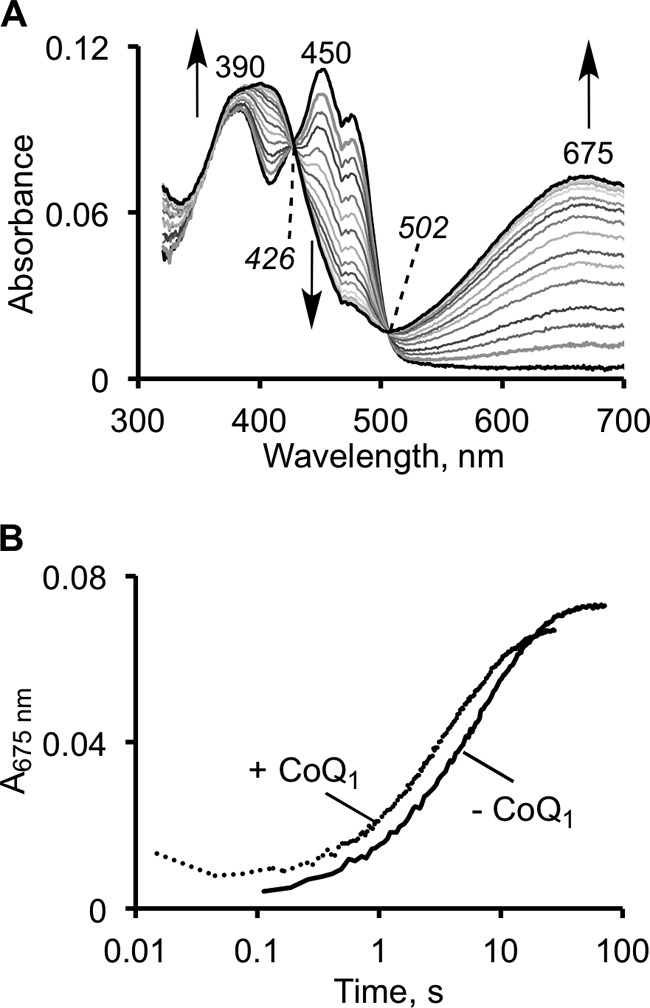
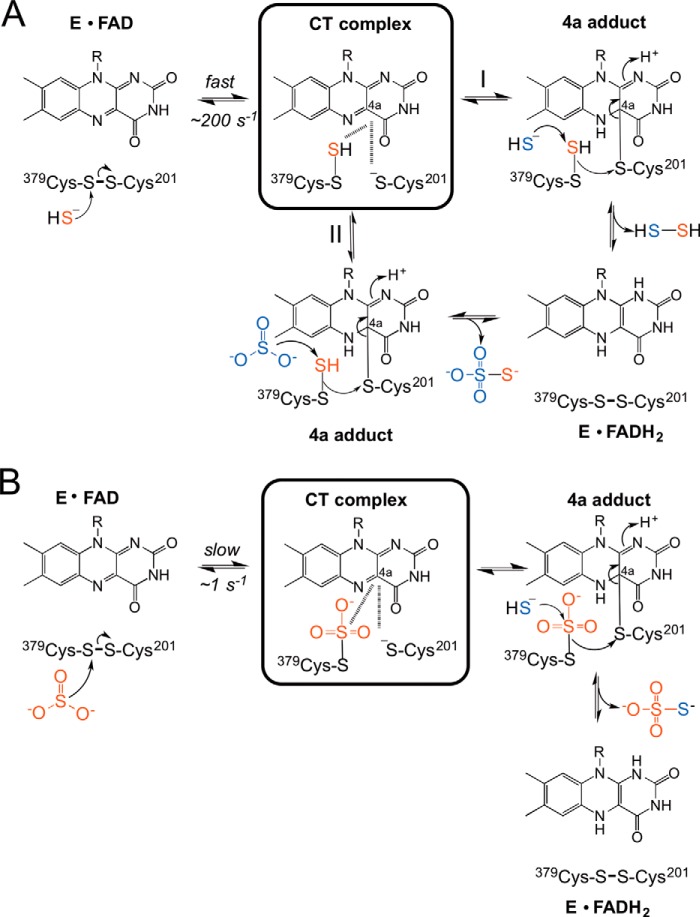
The first step in the mitochondrial sulfide oxidation pathway is catalyzed by sulfide quinone oxidoreductase (SQR), which belongs to the family of flavoprotein disulfide oxidoreductases. During the catalytic cycle, the flavin cofactor is intermittently reduced by sulfide and oxidized by ubiquinone, linking H2S oxidation to the electron transfer chain and to energy metabolism. Human SQR can use multiple thiophilic acceptors, including sulfide, sulfite, and glutathione, to form as products, hydrodisulfide, thiosulfate, and glutathione persulfide, respectively. In this study, we have used transient kinetics to examine the mechanism of the flavin reductive half-reaction and have determined the redox potential of the bound flavin to be -123 ± 7 mV. We observe formation of an unusually intense charge-transfer (CT) complex when the enzyme is exposed to sulfide and unexpectedly, when it is exposed to sulfite. In the canonical reaction, sulfide serves as the sulfur donor and sulfite serves as the acceptor, forming thiosulfate. We show that thiosulfate is also formed when sulfide is added to the sulfite-induced CT intermediate, representing a new mechanism for thiosulfate formation. The CT complex is formed at a kinetically competent rate by reaction with sulfide but not with sulfite. Our study indicates that sulfide addition to the active site disulfide is preferred under normal turnover conditions. However, under pathological conditions when sulfite concentrations are high, sulfite could compete with sulfide for addition to the active site disulfide, leading to attenuation of SQR activity and to an alternate route for thiosulfate formation.

Keywords: electrochemistry; enzyme kinetics; flavin; flavoprotein; hydrogen sulfide; oxidation-reduction (redox).


Figures

FIGURE 1.
FIGURE 1.
Structure and mechanism of SQR. A, the structure of a single subunit of human SQR modeled using I-TASSER. FAD (pink) and the active site cysteine residues, Cys-201 and Cys-379, are shown in sphere representation. B, close-up of the active site showing the redox-active cofactors, flavin, and a pair of cysteine residues. C, postulated reaction mechanism of SQR in which sulfide adds into the disulfide bond in the active site, forming a persulfide intermediate and a CT complex between the liberated thiolate and oxidized FAD (FADox). The addition of sulfide or sulfite to the persulfide produces hydrodisulfide or thiosulfate and is accompanied by electron transfer to FAD and reformation of the disulfide bond. The electrons from reduced FAD (FADred) are passed to CoQ to complete the catalytic cycle. D, elution profile of SQR and gel filtration standards in 50 mm Tris buffer (pH 8) containing 0.3% DHPC, and 200 mm NaCl. The standards used were: 1, thyroglobulin (670 kDa); 2, γ-globulin (158 kDa); 3, ovalbumin (44 kDa); 4, myoglobin (17 kDa); and 5, vitamin B12 (1.35 kDa).
FIGURE 2.
FIGURE 2.
Redox titration of SQR-bound FAD. The titration was performed as described under “Experimental Procedures” in the presence of indigo carmine as a reference dye. Top panel, FAD reduction was monitored at 465 nm (the isosbestic point for the reference dye), and the reduction of the dye was followed at 640 nm. Bottom panel, Nernst-plot analysis of the estimated standard reduction potential of the solution versus the fraction of oxidized SQR-bound FAD. The spectrum (top) is representative of three independent experiments, whereas the lower panel shows data from all three experiments. NHE, normal hydrogen electrode; ox/red, oxidized/reduced.
FIGURE 3.
FIGURE 3.
Kinetics of CT complex formation on SQR in the presence of sulfide. A, reaction between 10 μm SQR and 125 μm Na2S in 50 mm Tris-Cl buffer, pH 8.0, with 0.03% DHPC, was monitored over a period of 15 s. The first phase of the reaction is associated with the formation of an SQR-sulfide CT complex. B, representative spectrum of the fully developed CT complex (solid line) in the presence of an excess of sulfide (1 mm) and oxidized SQR (dashed line). C, dependence of the observed rate constant for formation of the CT complex on sulfide concentration, in 50 mm potassium phosphate buffer, pH 7.4, with 0.03% DHPC. The kinetics of CT complex decay (0.2 s−1) are unaffected by the changes in sulfide concentration. D, decay of the CT complex is accompanied by flavin reduction at 450 nm.
FIGURE 4.
FIGURE 4.
Kinetics of sulfide-dependent CT complex formation in the presence of CoQ1. The kinetics of CT formation (indicated by the up arrow a) and decay (indicated by the down arrow b) were monitored after mixing 10 μm SQR with 400 μm Na2S ± 100 μm CoQ1 (final concentrations; CoQ1 was included in the sulfide syringe) in 50 mm Tris-Cl buffer, pH 8.0, containing 0.03% DHPC. Due to fast CT formation at this higher sulfide concentration, the first recorded spectrum (shown in black in both panels) already possesses CT features. Although spectrally similar, the reactions without (A) and with (B) CoQ1 differ kinetically. The rate constant for the formation of the CT complex is enhanced in the presence of CoQ1. The rate constants and amplitudes for the kinetics measured at 675 nm are shown in the insets.
FIGURE 5.
FIGURE 5.
Characterization of the SQR-sulfite CT complex. A, a CT complex is formed upon the addition of 400 μm sulfite to 20 μm SQR and is resolved in the presence of 600 μm sulfide. The final spectrum is that of the reduced flavin (because sulfide is in excess) as observed previously (18). B, titration of 19 μm SQR with sulfite (0–3 mm) in 50 mm Tris-Cl buffer, pH 8.0, containing 0.03% DHPC (n = 3). The starting and final spectra are shown in black. C, the dependence of the CT absorbance change (average of three experiments) on sulfite concentration. D, DTNB (0.33 mm) treatment of the CT complex formed in A, after washing to remove excess sulfite, leads to the disappearance of CT complex, suggesting that a thiol in SQR participates in the CT complex. The decrease in absorbance of the “washed” CT complex likely resulted from a partial reversal to the oxidized protein during the handling step. Note that spectrophotometer was blanked with a DTNB solution, which itself absorbs in the visible region (400–500 nm).
FIGURE 6.
FIGURE 6.
Stopped-flow kinetics of the SQR reaction with sulfite. A, reaction between 10 μm SQR and 200 μm sulfite in 50 mm potassium phosphate buffer, pH 7.4, with 0.03% DHPC, monitored over a period of 75 s. B, kinetics of CT formation in the absence and presence of 30 μm CoQ1. The kinetic traces could be fitted to a two-exponential model as described under “Results.” The addition of CoQ1 did not significantly alter the kinetics of CT complex formation, and similar kinetics were observed in 50 mm Tris-Cl buffer, pH 8.0.
FIGURE 7.
FIGURE 7.
Mechanistic alternatives for the flavin reductive half-reaction catalyzed by human SQR. A, reductive half-reaction in which sulfide is the first substrate to add to the disulfide bond forming a CT complex. The reaction branches at this point into paths I (sulfide as acceptor) and II (sulfite as acceptor), leading to the formation of hydrodisulfide and thiosulfate, respectively, and to reduced flavin (FADH2). Under Vmax conditions, the kcat for path II is 5-fold greater than for path I at pH 7.4 (19). B, reductive half-reaction of SQR in which sulfite is the first substrate and adds to the disulfide bond to give a sulfocysteine intermediate. This reaction is slow and is followed by sulfide addition to sulfocysteine to give thiosulfate and reduced flavin.

References

    1. Powell M. A., Somero G. N. (1986) Hydrogen sulfide oxidation is coupled to oxidative phosphorylation in mitochondria of Solemya reidi. Science 233, 563–566 - PubMed
    1. Goubern M., Andriamihaja M., Nübel T., Blachier F., Bouillaud F. (2007) Sulfide, the first inorganic substrate for human cells. FASEB J. 21, 1699–1706 - PubMed
    1. Kimura H. (2010) Hydrogen sulfide: from brain to gut. Antioxid. Redox Signal. 12, 1111–1123 - PubMed
    1. Polhemus D. J., Lefer D. J. (2014) Emergence of hydrogen sulfide as an endogenous gaseous signaling molecule in cardiovascular disease. Circ. Res. 114, 730–737 - PMC - PubMed
    1. Kabil O., Motl N., Banerjee R. (2014) H2S and its role in redox signaling. Biochim. Biophys. Acta 1844, 1355–1366 - PMC - PubMed

Publication types

LinkOut - more resources