. 2015 Oct 16;290(42):25356-73.
doi: 10.1074/jbc.M115.658658. Epub 2015 Aug 28.

Tumor Necrosis Factor-α (TNFα)-induced Ceramide Generation via Ceramide Synthases Regulates Loss of Focal Adhesion Kinase (FAK) and Programmed Cell Death

Affiliations

Tumor Necrosis Factor-α (TNFα)-induced Ceramide Generation via Ceramide Synthases Regulates Loss of Focal Adhesion Kinase (FAK) and Programmed Cell Death

María José Hernández-Corbacho et al. J Biol Chem. .

Abstract

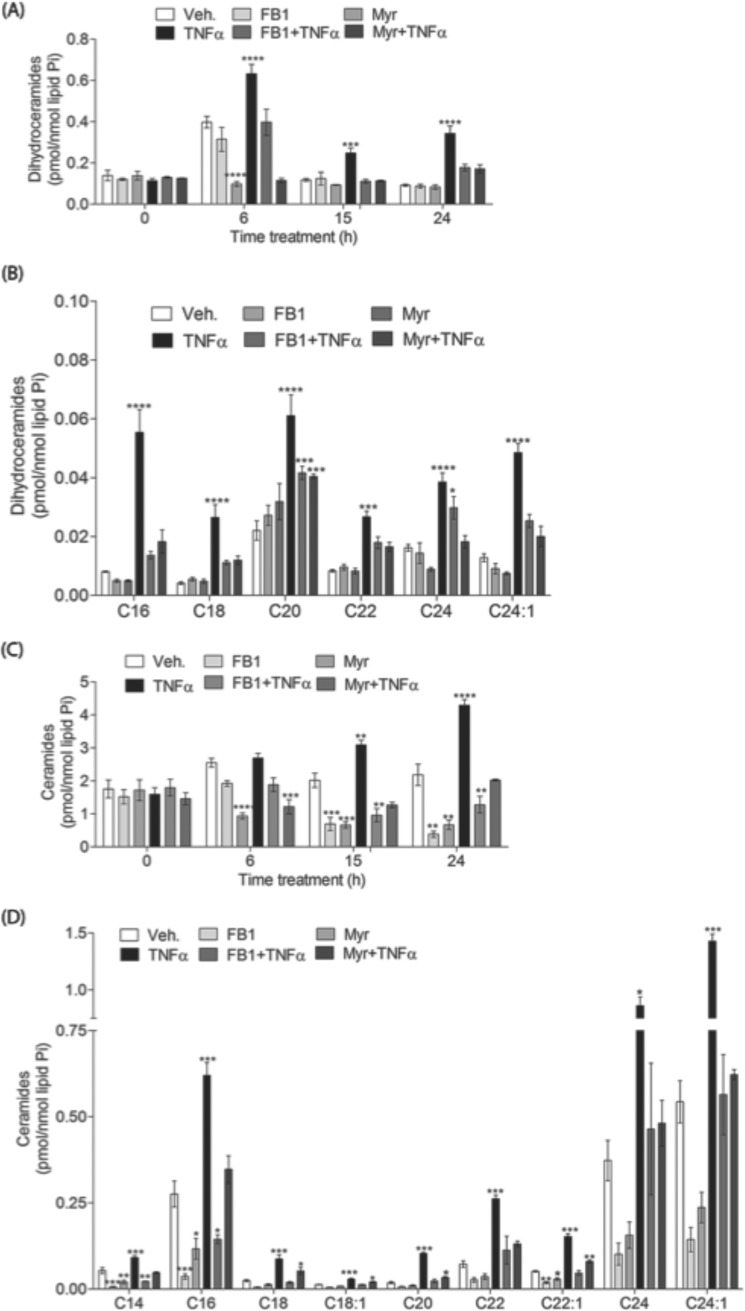
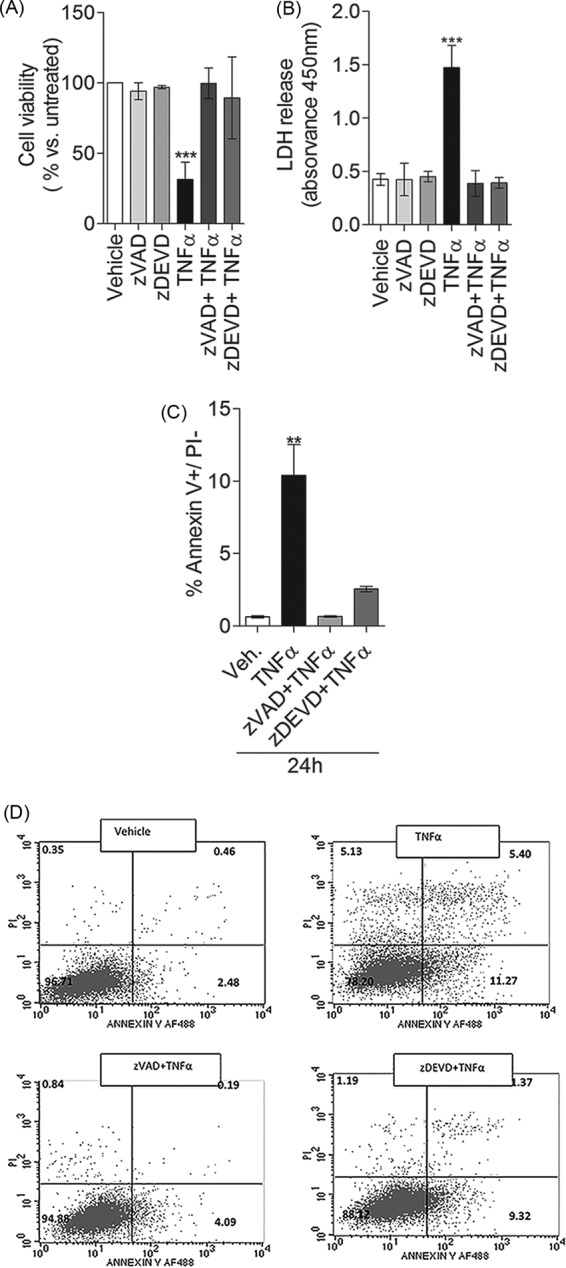
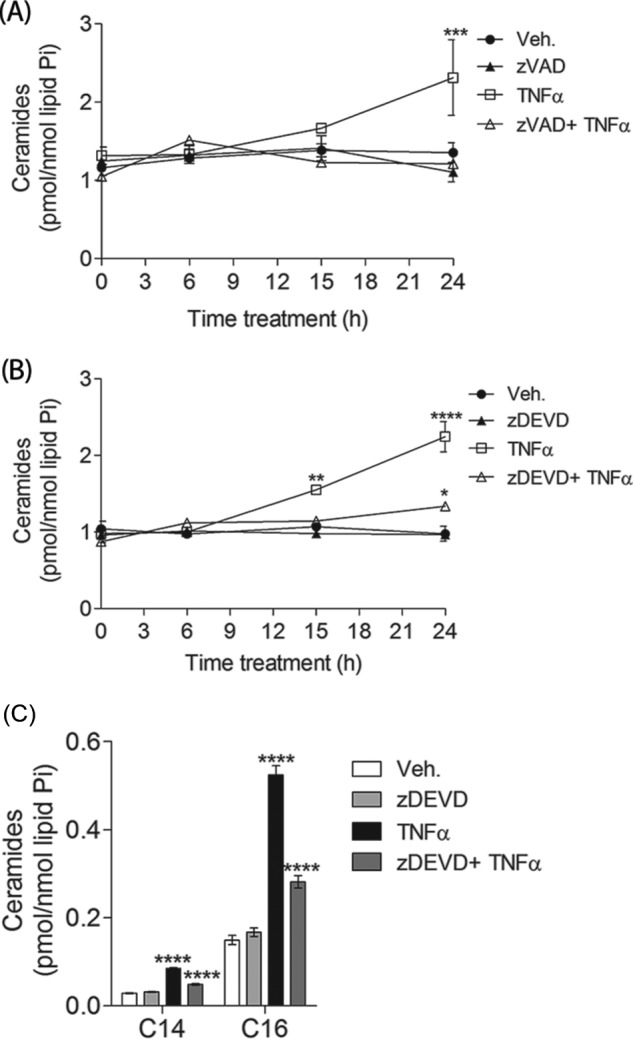
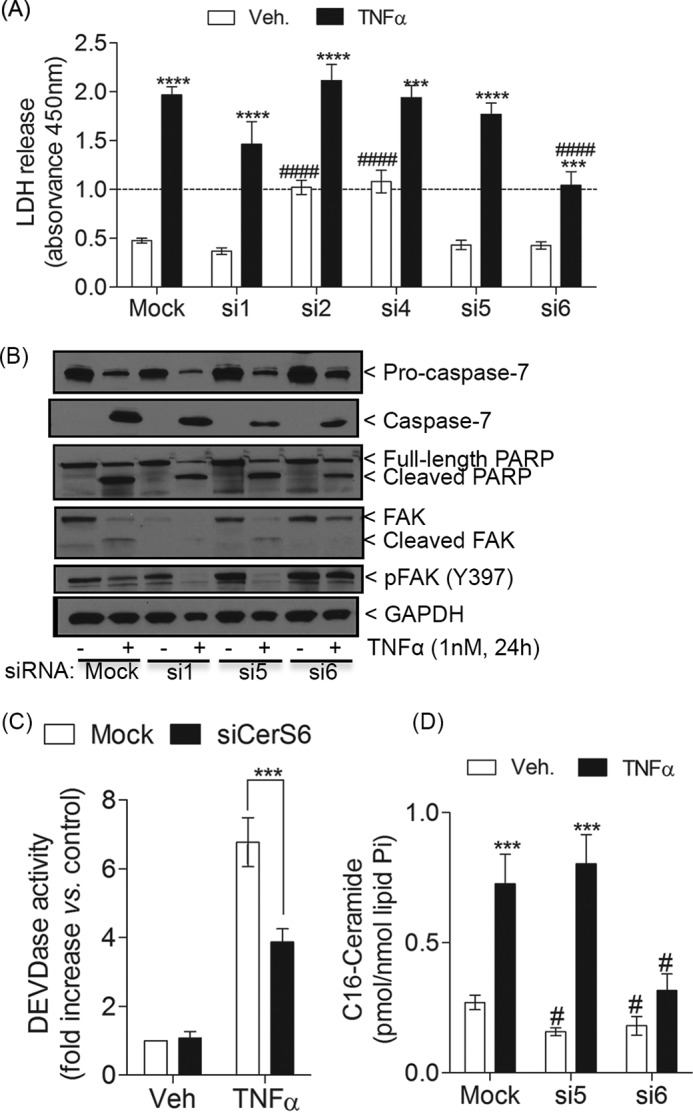
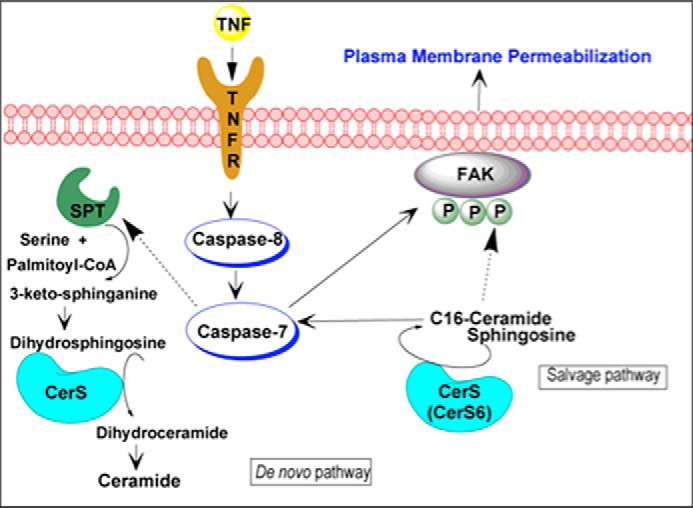
Ceramide synthases (CerS1-CerS6), which catalyze the N-acylation of the (dihydro)sphingosine backbone to produce (dihydro)ceramide in both the de novo and the salvage or recycling pathway of ceramide generation, have been implicated in the control of programmed cell death. However, the regulation of the de novo pathway compared with the salvage pathway is not fully understood. In the current study, we have found that late accumulation of multiple ceramide and dihydroceramide species in MCF-7 cells treated with TNFα occurred by up-regulation of both pathways of ceramide synthesis. Nevertheless, fumonisin B1 but not myriocin was able to protect from TNFα-induced cell death, suggesting that ceramide synthase activity is crucial for the progression of cell death and that the pool of ceramide involved derives from the salvage pathway rather than de novo biosynthesis. Furthermore, compared with control cells, TNFα-treated cells exhibited reduced focal adhesion kinase and subsequent plasma membrane permeabilization, which was blocked exclusively by fumonisin B1. In addition, exogenously added C6-ceramide mimicked the effects of TNFα that lead to cell death, which were inhibited by fumonisin B1. Knockdown of individual ceramide synthases identified CerS6 and its product C16-ceramide as the ceramide synthase isoform essential for the regulation of cell death. In summary, our data suggest a novel role for CerS6/C16-ceramide as an upstream effector of the loss of focal adhesion protein and plasma membrane permeabilization, via the activation of caspase-7, and identify the salvage pathway as the critical mechanism of ceramide generation that controls cell death.

Keywords: Ceramide; PTK2 protein tyrosine kinase 2 (PTK2) (focal adhesion kinase) (FAK); cell death; ceramide synthase; fumonisin b1; plasma membrane; sphingolipid.


Figures

FIGURE 1.
FIGURE 1.
The ceramide synthase inhibitor FB1 but not the serine palmitoyltransferase inhibitor Myr protects from TNFα-induced programmed cell death in MCF-7 cells. A, MCF-7 cells were pretreated with 50 μm FB1 or 100 nm Myr for 1 h and then treated with either vehicle (PBS) or 1 nm TNFα for the times indicated. Cell viability was measured by the MTT assay. B, plasma membrane permeabilization was measured by LDH release into the medium. C, intracellular levels of calcium were measured as described under “Experimental Procedures.” D, to quantify TNFα-induced apoptosis and the effects of FB1 and Myr (15 and 24 h post-treatment), flow cytometry was used. Annexin V-fluorescein isothiocyanate (FITC) and propidium iodide staining were used to analyze the percentage of apoptotic cells. E, representation of the average of four independent experiments. A–D, data are the average of at least three independent experiments, and error bars represent S.E. Statistical significance was determined by two-way (A–C) or one-way (D) ANOVA with Bonferroni post-test. **, p < 0.01; ***, p 0.001; ****, p < 0.0001 versus vehicle.
FIGURE 2.
FIGURE 2.
TNFα-induced accumulation of a variety of sphingolipids. MCF-7 cells were pretreated with 50 μm FB1 or 100 nm Myr for 1 h and then treated with either vehicle (PBS) or 1 nm TNFα for the times indicated. Sphingolipids were quantified by mass spectrometry and normalized to total inorganic phosphates. Effects of FB1 and Myr on total dihydroceramide (A), individual dihydroceramide species (B), total ceramide (C), and individual ceramide species (D) are shown. Data are the average of three independent experiments. Error bars, S.E. For statistical analysis, a two-way ANOVA was performed with a Bonferroni post-test. *, p < 0.05; **, p < 0.01; ***, p < 0.001; ****, p < 0.0001.
FIGURE 3.
FIGURE 3.
Effects of TNFα on sphingoid bases. MCF-7 cells were pretreated with 50 μm FB1 or 100 nm Myr for 1 h and then treated with either vehicle (PBS) or 1 nm TNFα for 24 h. Sphingoid bases were quantified by mass spectrometry and normalized to total inorganic phosphates. Effects of FB1 and Myr on Sph (A), sphingosine 1-phosphate (B), dhSph (C), and dhSph 1-phosphate (D) are shown. Data represent the mean and S.E. (error bars) of at least three independent experiments. Statistical significance was determined by one-way ANOVA with Bonferroni post-test. **, p < 0.01; ***, p 0.001; ****, p < 0.0001 versus vehicle.
FIGURE 4.
FIGURE 4.
Both the pan-caspase inhibitor z-VAD and the caspase-3/7 inhibitor z-DEVD protect from TNFα-induced programmed cell death. MCF-7 cells were pretreated with either 10 μm z-VAD or 10 μm z-DEVD for 1 h and then treated with vehicle or 1 nm TNFα for 24 h. Effects of z-VAD and z-DEVD on cell viability were measured by the MTT assay (A), and effects on plasma membrane permeabilization were measured by LDH release into the medium (B). C, annexin V-fluorescein isothiocyanate (FITC) and propidium iodide staining were used to analyze the percentage of apoptotic cells. D, representation of the average of three independent experiments. A–C, data are the average of at least three independent experiments, and error bars represent S.E. For statistical analysis, a one-way ANOVA with Bonferroni post-test was used. **, p < 0.01; ***, p 0.001 versus vehicle.
FIGURE 5.
FIGURE 5.
TNFα-induced accumulation of total ceramides is inhibited by the pan-caspase inhibitor z-VAD-fmk and the caspase-3/7 inhibitor z-DEVD-fmk. MCF-7 cells were pretreated with either 10 μm z-VAD or 10 μm z-DEVD for 1 h and then treated with either vehicle (PBS) or 1 nm TNFα for the times indicated. Sphingolipids were quantified by mass spectrometry and normalized to total inorganic phosphates. A, effects of z-VAD-fmk on total ceramides. Effects of z-DEVD-fmk on total ceramides (B) and C14- and C16-ceramide (C) are shown. A–C, data are the average of three independent experiments. Error bars, S.E. For statistical analysis, a two-way ANOVA was performed with a Bonferroni post-test. *, p < 0.05; **, p < 0.01; ***, p < 0.001; ****, p < 0.0001.
FIGURE 6.
FIGURE 6.
The ceramide-synthase inhibitor FB1 protects from TNFα-induced caspase-7 cleavage and activation in MCF-7 cells. A, MCF-7 cells were treated as indicated for 15 or 24 h. The cleavage of caspase-8, caspase-7, and Bid was analyzed by Western blot. A representative experiment is shown. Similar results were obtained in at least two additional experiments. GAPDH was used as gel loading control. B, MCF-7 cells were pretreated with FB1 or Myr for 1 h and then treated with either vehicle (PBS) or 1 nm TNFα for the times indicated. The caspase-3/7-like DEVDase activity assay was performed in treated and untreated cells. Data are the average of three independent experiments. Error bars, S.E. For statistical analysis, a two-way ANOVA was performed with a Bonferroni post-test. *, p < 0.05; **, p < 0.01.
FIGURE 7.
FIGURE 7.
TNFα-induced dephosphorylation of FAK (Tyr-397) and cleavage of FAK are caspase-dependent events. Fumonisin B1 inhibited the loss of FAK (Tyr(P)-397). MCF-7 cells were treated with the indicated concentration of TNFα for 24 h (A), with 10 μm z-VAD or z-DEVD for 1 h prior to 24-h treatment with TNFα (1 nm) (B), or with 50 μm FB1 or 100 nm Myr for 1 h followed by treatment with either vehicle or TNFα for the times indicated (C). The levels of phosphorylated and total FAK were analyzed by Western blot. A representative experiment is shown. Similar results were obtained in at least two additional experiments. GAPDH was used as a gel loading control. D, quantitative analysis of effects of fumonisin B1 and myriosin on the loss of phosphorylated (Tyr(P)-397) and total FAK upon 24 h of TNFα treatment. Data represent the mean and S.E. (error bars) of at least three independent experiments. Statistical significance was determined by one-way ANOVA with Bonferroni post-test. *, p < 0.05; **, p < 0.01 versus vehicle.
FIGURE 8.
FIGURE 8.
The inhibition of the autophosphorylation of FAK on Tyr-397 by FAK inhibitor 14 (Y15) is sufficient to trigger cell death. MCF-7 cells were treated with a 10 μm concentration of the focal adhesion kinase inhibitor Y15 for the time indicated. A, the levels of phosphorylated and total FAK and pro-caspase-7 were analyzed by Western blot upon Y15 treatment for the indicated time. A representative experiment is shown. Similar results were obtained in at least two additional experiments. GAPDH was used as a gel loading control. B, cell viability was measured by the MTT assay. C, plasma membrane permeabilization was measured by the LDH release assay. D, a caspase-3/7-like DEVDase activity assay was performed in the time indicated. E, MCF-7 cells were pretreated with 10 μm z-DEVD for 1 h and then treated with Y15 for 6 h. Plasma membrane permeabilization was measured by LDH release into the medium. Data represent mean and S.E. (error bars) of at least three independent experiments. B–E, statistical significance was determined by one-way ANOVA with Bonferroni post-test. ***, p < 0.001; ****, p < 0.0001 versus vehicle.
FIGURE 9.
FIGURE 9.
Silencing of CerS6 but not other isoforms protects from cell death. MCF-7 cells were transfected with siCerS1, -2, -4, -5, or -6 or mock (siControl) for 48 h. After changing the medium, cells were treated with TNFα or vehicle for 24 h. A, LDH release was measured as described earlier. B, effects of mock, siCerS1, siCerS5, and siCerS6 on the levels of procaspase-7 and total and phosphorylated FAK were analyzed by Western blot. A representative experiment is shown. Similar results were obtained in at least three additional experiments. GAPDH was used as gel loading control. C, effects of mock and siCerS6 on the caspase-3/7-like DEVDase activity assay. D, effects of mock, siCerS5, and siCerS6 on C16-ceramide. A, C, and D, error bars, S.E. For statistical analysis, a one-way (C) or two-way ANOVA (A and D) was performed with multiple Bonferroni post-tests. ***, p < 0.001; ****, p < 0.0001 versus siRNA-matched untreated cells. #, p < 0.05; ####, p < 0.0001 versus treatment-matched siControl.
FIGURE 10.
FIGURE 10.
C6-ceramide-induced cell death is inhibited by the ceramide synthase inhibitor FB1. A, MCF-7 cells were treated with or without C6-Cer (25 μm, 18 h), and cell morphology images were taken by phase-contrast microscopy. B, plasma membrane permeabilization was measured by the LDH release assay in cells treated with C6-ceramide for the time indicated. C, cells were treated with EtOH (48 h), C6-Cer (48 h), C6-Cer and z-DEVD (10 μm; added 1 h prior to C6-Cer), or TNFα (1 nm; 24 h). The LDH released into the medium was measured. D, the levels of pro-caspase-7, phosphorylated FAK (Tyr(P)-397), and total FAK were analyzed by Western blot. Two representative experiments are shown. GAPDH was used as gel loading control. E, the caspase-3/7-like DEVDase activity was assayed as described under “Experimental Procedures.” Cells were treated with FB1 1 h prior to the addition of either vehicle (EtOH, 48 h) or C6-Cer (48 h). F, the LDH released into the medium was measured. Ceramides were quantified by mass spectrometry and normalized to total inorganic phosphates. Effects of C6-Cer and of FB1 plus C6-Cer on total ceramide levels (G) and C16-ceramide (H) are shown. B, C, E, F, G, and H, data represent mean and S.E. (error bars) of at least three independent experiments. Statistical significance was determined by one-way ANOVA with Bonferroni post-test (G and H), two-way ANOVA with Bonferroni post-test (B, D, and F), or unpaired t test (E). *, p < 0.05; **, p < 0.01; ***, p 0.001; ****, p < 0.0001 versus EtOH.
FIGURE 11.
FIGURE 11.
Proposed model of regulation of TNFα-induced cell death by ceramide synthase. TNFα stimulation induces ceramide generation by at least two pathways: a de novo pathway and the salvage pathway, which occurred downstream of the apical caspase-8. CerSs, which control both pathways, catalyze the N-acylation of (dihydro)sphingosine to produce (dihydro)ceramide. In turn, ceramide synthase-derived ceramide from the salvage pathway, especially CerS6 and its product C16-ceramide, activates caspase-7, which cleaves FAK. The loss of Tyr(P)-397-FAK and total FAK preceded cell death and subsequent secondary necrosis. SPT, serine palmitoyltransferase.

Similar articles

Cited by

References

    1. Kerr J. F., Wyllie A. H., Currie A. R. (1972) Apoptosis: a basic biological phenomenon with wide-ranging implications in tissue kinetics. Br. J. Cancer 26, 239–257 - PMC - PubMed
    1. Fulda S. (2009) Tumor resistance to apoptosis. Int. J. Cancer 124, 511–515 - PubMed
    1. Wyllie A. H., Kerr J. F., Currie A. R. (1980) Cell death: the significance of apoptosis. Int. Rev. Cytol. 68, 251–306 - PubMed
    1. Silva M. T. (2010) Secondary necrosis: the natural outcome of the complete apoptotic program. FEBS Lett. 584, 4491–4499 - PubMed
    1. Robertson A. M., Bird C. C., Waddell A. W., Currie A. R. (1978) Morphological aspects of glucocorticoid-induced cell death in human lymphoblastoid cells. J. Pathol. 126, 181–187 - PubMed

Publication types

MeSH terms

LinkOut - more resources