. 2015 Oct 16;290(42):25427-38.
doi: 10.1074/jbc.M115.646984. Epub 2015 Aug 28.

Metabolic Reprogramming Is Required for Myofibroblast Contractility and Differentiation

Affiliations

Metabolic Reprogramming Is Required for Myofibroblast Contractility and Differentiation

Karen Bernard et al. J Biol Chem. .

Abstract

Contraction is crucial in maintaining the differentiated phenotype of myofibroblasts. Contraction is an energy-dependent mechanism that relies on the production of ATP by mitochondria and/or glycolysis. Although the role of mitochondrial biogenesis in the adaptive responses of skeletal muscle to exercise is well appreciated, mechanisms governing energetic adaptation of myofibroblasts are not well understood. Our study demonstrates induction of mitochondrial biogenesis and aerobic glycolysis in response to the differentiation-inducing factor transforming growth factor β1 (TGF-β1). This metabolic reprogramming is linked to the activation of the p38 mitogen-activated protein kinase (MAPK) pathway. Inhibition of p38 MAPK decreased accumulation of active peroxisome proliferator-activated receptor γ coactivator 1α in the nucleus and altered the translocation of mitochondrial transcription factor A to the mitochondria. Genetic or pharmacologic approaches that block mitochondrial biogenesis or glycolysis resulted in decreased contraction and reduced expression of TGF-β1-induced α-smooth muscle actin and collagen α-2(I) but not of fibronectin or collagen α-1(I). These data indicate a critical role for TGF-β1-induced metabolic reprogramming in regulating myofibroblast-specific contractile signaling and support the concept of integrating bioenergetics with cellular differentiation.

Keywords: differentiation; glycolysis; mitochondria; myofibroblast; p38; transforming growth factor β (TGF-β).


Figures

FIGURE 1.
FIGURE 1.
TGF-β1 enhances the oxygen consumption of human lung fibroblasts. A, IMR-90 cells were treated with or without TGF-β1 (2.5 ng/ml) for 48 h at 37 °C. The OCR was measured as a function of time. Oligomycin (0.6 μm), carbonyl cyanide p-trifluoromethoxyphenylhydrazone (FCCP) (1 μm), or antimycin A (AA) (10 μm) was added at the indicated time point. B, bar graph representing the effect of TGF-β1 treatment on the ECAR of IMR-90 cells. C, bar graph corresponding to the calculation of basal, ATP-linked, proton leak, maximal, reserve, and non-mitochondrial OCR. D, bioenergetic map of IMR-90 cells representing the shift in OCR and ECAR following TGF-β1 treatment. E, bar graph representing the effect of TGF-β1 on complex I- or complex II-linked OCR in saponin-permeabilized cells in the presence of ADP (State 3). Error bars represent S.E. *, p < 0.005 compared with control. mpH, milli-pH units.
FIGURE 2.
FIGURE 2.
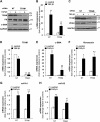
TGF-β1 stimulates mitochondrial biogenesis in human lung fibroblasts. A, IMR-90 cells were treated with or without TGF-β1 (2.5 ng/ml) for 48 h at 37 °C. Cells were then incubated with MitoTracker Deep Red FM (250 nm for 15 min ay 37 °C) and imaged using a confocal microscope (Zeiss LSM 700). * indicates the no MitoTracker control. B, IMR-90 cells were treated with TGF-β1 (2.5 ng/ml) at 37 °C for the indicated time points. Cells were then lysed, and expression levels of phosphorylated PGC-1α (pPGC-1α), total PGC-1α, α-SMA, and GAPDH were assessed by Western blotting. C, IMR-90 cells were treated without or with TGF-β1 (2.5 ng/ml) at 37 °C for the indicated time periods. Cells were then lysed, and expression levels of VDAC were determined by Western blotting. D, IMR-90 cells were treated with TGF-β1 (2.5 ng/ml) at 37 °C for the indicated time periods, and mitochondrial DNA copies were quantified by real time PCR. Error bars represent S.E. *, p < 0.05 compared with control. E, IMR-90 cells were treated without or with TGF-β1 (2.5 ng/ml) at 37 °C for the indicated time periods. Cells were then lysed, and expression levels of HKII were determined by Western blotting.
FIGURE 3.
FIGURE 3.
TGF-β1 stimulates metabolic reprogramming via a p38 MAPK pathway. A, IMR-90 cells were treated without or with TGF-β1 (2.5 ng/ml) in the absence or presence of the p38 MAPK inhibitor SB202190 (5 μm) for 48 h at 37 °C. SB202190 was applied 30 min prior to the addition of TGF-β1. Nuclear and cytosolic fractions were then isolated, and the expression levels of phosphorylated PGC-1α (pPGC-1α), lamin A/C, and α-tubulin were determined by Western blotting. B, analysis of total PGC-1α in nuclear fractions in response to TGF-β1 with or without SB202190 treatment. C, IMR-90 cells were treated as described in A. Total and mitochondrial fractions were then isolated. The expression levels of TFAM, VDAC, TOM20, HKII, and α-tubulin were determined by Western blotting. D, bar graph representing the effect of SB202190 (5 μm) on the TGF-β1-induced increase in mitochondrial DNA copy number. Values represent mean ± S.E. Error bars represent S.E. *, p < 0.05 compared with control plus vehicle; #, p < 0.05 compared with TGF-β1 plus vehicle.
FIGURE 4.
FIGURE 4.
Loss of p38 MAPK function decreases TGF-β1-induced expression of mitochondrial biogenesis and glycolysis markers. A, IMR-90 cells were transfected with pcDNA3.1 or a vector encoding a p38 MAPK mutant (inactive p38 MAPK). 24 h after transfection, IMR-90 cells were serum-starved overnight and treated without or with TGF-β1 (2.5 ng/ml) for 48 h at 37 °C. Cells were then lysed, and the expression levels of total p38 MAPK, HKII, VDAC, and α-tubulin were assessed by Western blotting. B, C, and D correspond to the densitometry analysis of total p38, HKII, and VDAC, respectively. Bar graphs represent mean ± S.E. (n = 3 per experimental condition). Error bars represent S.E. In B, *, p < 0.05 compared with pcDNA3.1-transfected cells minus TGF-β1; **, p < 0.005 compared with pcDNA3.1-transfected cells plus TGF-β1. In C and D, *, p < 0.05 compared with pcDNA3.1-transfected cells minus TGF-β1; #, p < 0.05 compared with pcDNA3.1-transfected cells plus TGF-β1.
FIGURE 5.
FIGURE 5.
Silencing of TFAM down-regulates TGF-β1-induced expression of α-SMA. A, IMR-90 cells were transfected with NT or TFAM siRNA (100 nm). After a 24-h recovery period in 10% serum-containing medium, cells were serum-starved (1% serum) overnight and treated without or with TGF-β1 (2.5 ng/ml for 48 h at 37 °C). Cells were then lysed, and expression levels of TFAM, FN, α-SMA, and GAPDH were assessed by Western blotting. B, densitometry analysis of the Western blotting results described in A from six independent experiments. Values represent mean ± S.E. Error bars represent S.E. **, p < 0.005 compared with control; #, p < 0.05 compared with NT plus TGF-β1. C, expression levels of TFAM, VDAC, and GAPDH analyzed by Western blotting in total cell lysates from NT or TFAM siRNA-transfected cells. D, E, F, G, and H, analysis of TFAM, α-SMA, fibronectin, Col1A1, and Col1A2 mRNA levels by real time PCR in NT or TFAM siRNA-transfected cells treated with or without TGF-β1 for 24 h. Values represent mean ± S.E. (n = 3 per experimental condition). Error bars represent S.E. *, p < 0.05 and **, p < 0.005 compared with control; ††, p < 0.005 compared with NT without TGF-β1; #, p < 0.05 and ##, p < 0.005 compared with NT plus TGF-β1; n.s., non-significant difference between means (NT plus TGF-β1 compared with TFAM plus TGF-β1).
FIGURE 6.
FIGURE 6.
Inhibition of mitochondrial function or biogenesis alters myofibroblast contractility. A, IMR-90 cells were seeded in type I collagen gel. 22 h after treatment with TGF-β1 (2.5 ng/ml, 37 °C), vehicle (DMSO) or rotenone (0.5 or 5 μm) was added for 2 h. Gel contraction was assessed at the indicated time points after gel release. Images were captured with a FOTO/Analyst Express camera. B, gel surface area analysis from four independent experiments. Bar graphs represent mean ± S.E. Error bars represent S.E. **, p < 0.005 compared with control vehicle; ##, p < 0.005 compared with TGF-β1 plus vehicle. C, representative Western blot showing the expression levels of fibronectin, α-SMA, phosphorylated MLC20 (pMLC20), total MLC20, and GAPDH in IMR-90 cells treated with or without TGF-β1 in the presence of DMSO or 0.5 μm rotenone. D, representative Western blot showing the effect of TFAM silencing on phosphorylated MLC20 expression in response to TGF-β1 in IMR-90cells. E, densitometry analysis of the Western blotting results described in D from three independent experiments. Values represent mean ± S.E. Error bars represent S.E. **, p < 0.005 compared with NT without TGF-β1; #, p < 0.05 compared with NT plus TGF-β1. A.U., arbitrary units.
FIGURE 7.
FIGURE 7.
Blocking of glycolysis decreases TGF-β1-induced α-SMA expression. A, IMR-90 cells were treated without or with TGF-β1 (2.5 ng/ml at 37 °C for 48 h) in serum-free medium containing 0 (vehicle), 1, or 3 mm 2-DG. Cells were then lysed, and expression levels of FN, α-SMA, and α-tubulin were assessed by Western blotting. B and C, densitometry analysis of the Western blotting results described in A from three independent experiments. Bar graphs represent mean ± S.E. Error bars represent S.E. *, p < 0.05 and **, p < 0.005 compared with control plus vehicle; #, p < 0.05 and ##, p < 0.005 compared with control plus 2-DG; †, p < 0.05 compared with TGF-β1 plus vehicle; n.s., non-significant difference between means (TGF-β1 plus 2-DG compared with TGF-β1 minus 2-DG).

References

    1. Duffield J. S., Lupher M., Thannickal V. J., Wynn T. A. (2013) Host responses in tissue repair and fibrosis. Annu. Rev. Pathol. 8, 241–276 - PMC - PubMed
    1. Radisky D. C., Kenny P. A., Bissell M. J. (2007) Fibrosis and cancer: do myofibroblasts come also from epithelial cells via EMT? J. Cell Biochem. 101, 830–839 - PMC - PubMed
    1. Thannickal V. J., Lee D. Y., White E. S., Cui Z., Larios J. M., Chacon R., Horowitz J. C., Day R. M., Thomas P. E. (2003) Myofibroblast differentiation by transforming growth factor-β1 is dependent on cell adhesion and integrin signaling via focal adhesion kinase. J. Biol. Chem. 278, 12384–12389 - PubMed
    1. Desmoulière A., Chaponnier C., Gabbiani G. (2005) Tissue repair, contraction, and the myofibroblast. Wound Repair Regen. 13, 7–12 - PubMed
    1. Phan S. H. (2003) Fibroblast phenotypes in pulmonary fibrosis. Am. J. Respir. Cell Mol. Biol. 29, S87–S92 - PubMed

Publication types

Substances

LinkOut - more resources