Review
. 2016 Feb;24(2):274-89.
doi: 10.1016/j.joca.2015.08.011. Epub 2015 Aug 28.

An illustrative overview of semi-quantitative MRI scoring of knee osteoarthritis: lessons learned from longitudinal observational studies

Affiliations
Review

An illustrative overview of semi-quantitative MRI scoring of knee osteoarthritis: lessons learned from longitudinal observational studies

F W Roemer et al. Osteoarthritis Cartilage. 2016 Feb.

Abstract

Objective: To introduce the most popular magnetic resonance imaging (MRI) osteoarthritis (OA) semi-quantitative (SQ) scoring systems to a broader audience with a focus on the most commonly applied scores, i.e., the MOAKS and WORMS system and illustrate similarities and differences.

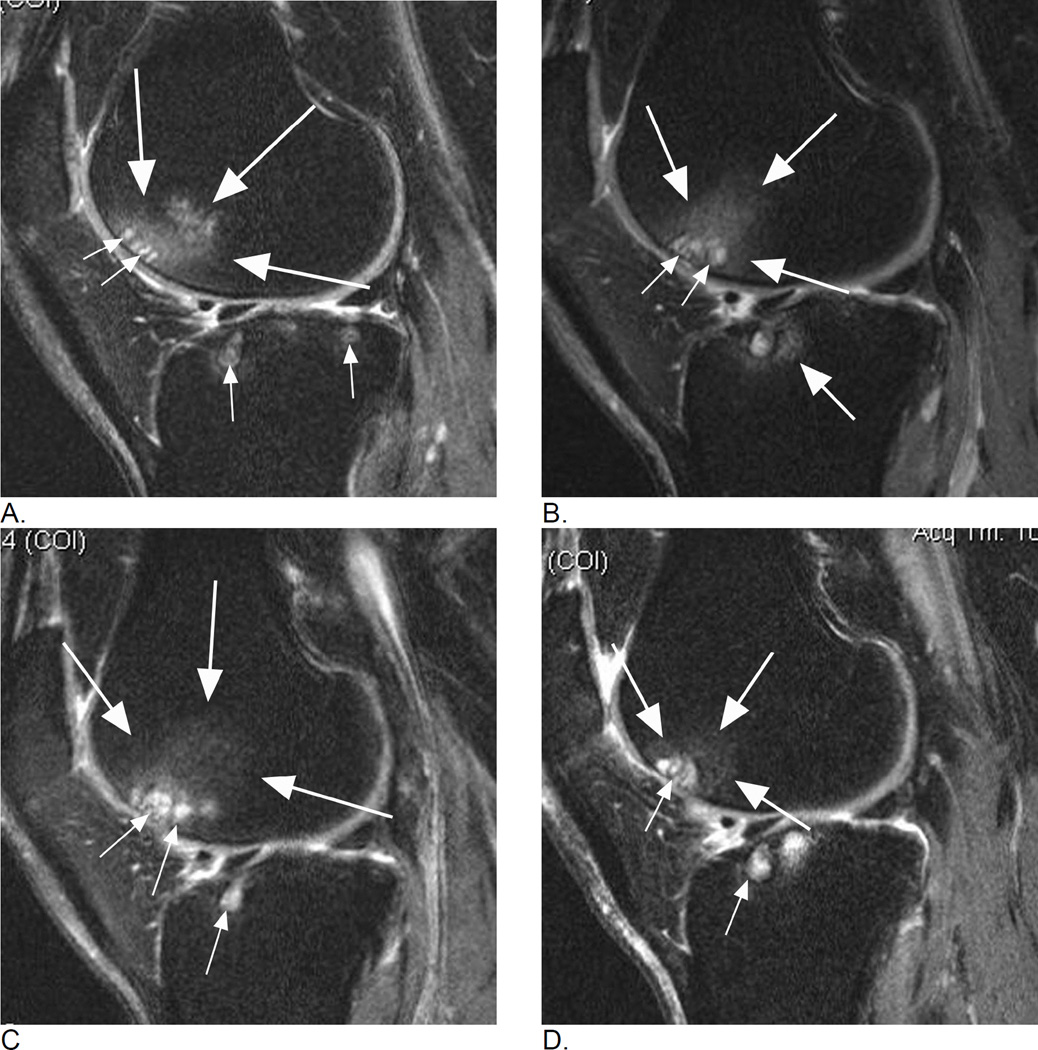
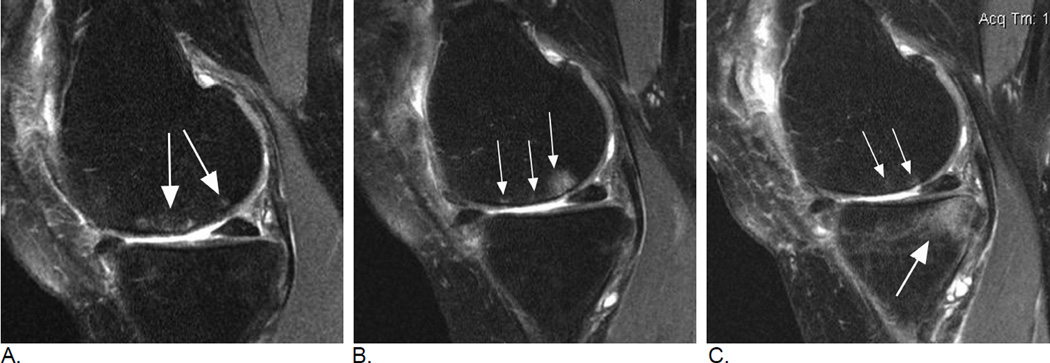
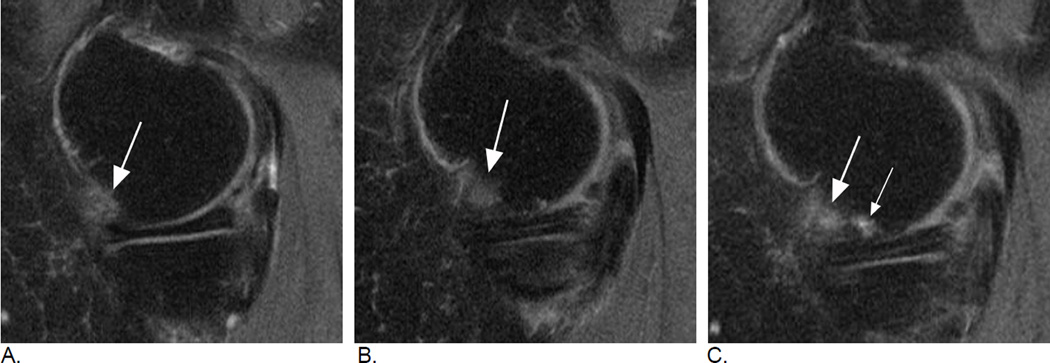
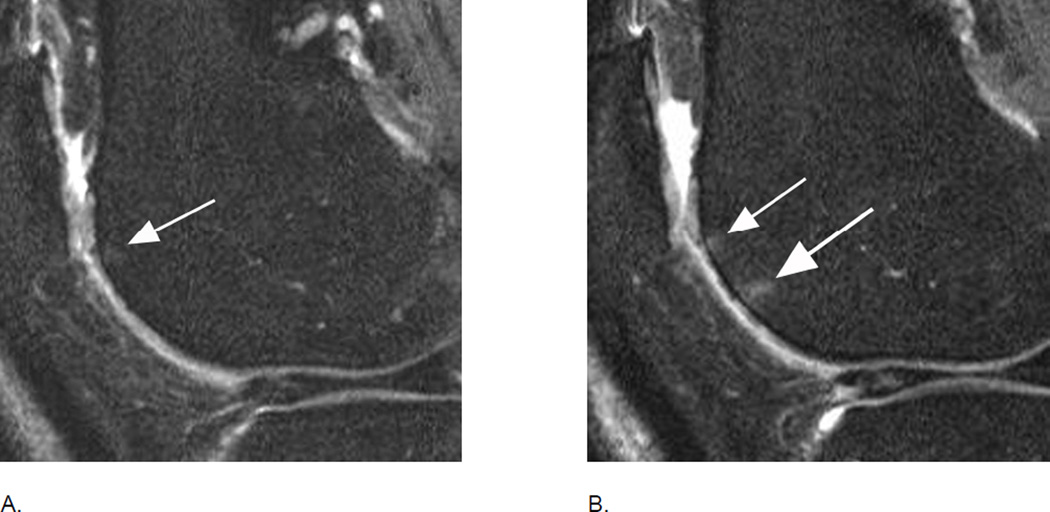
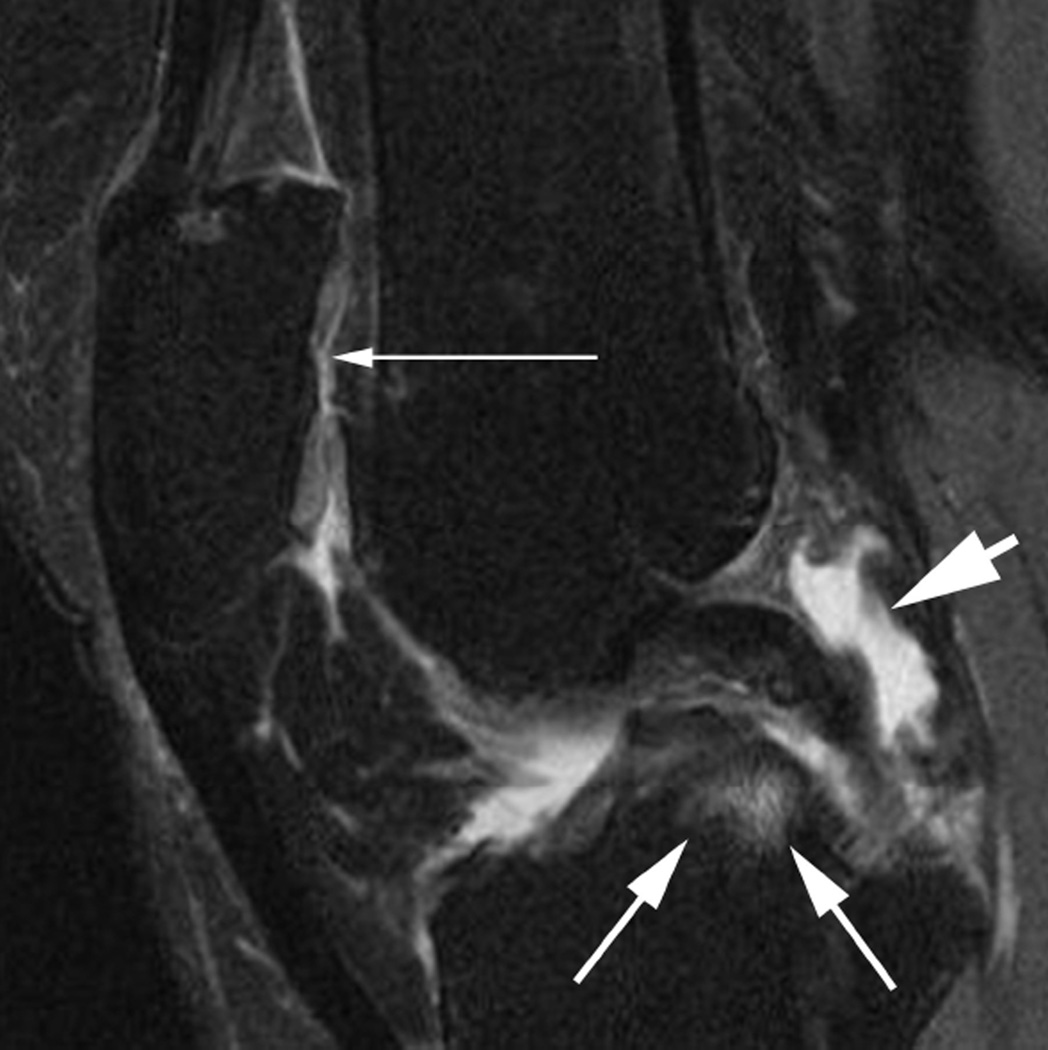
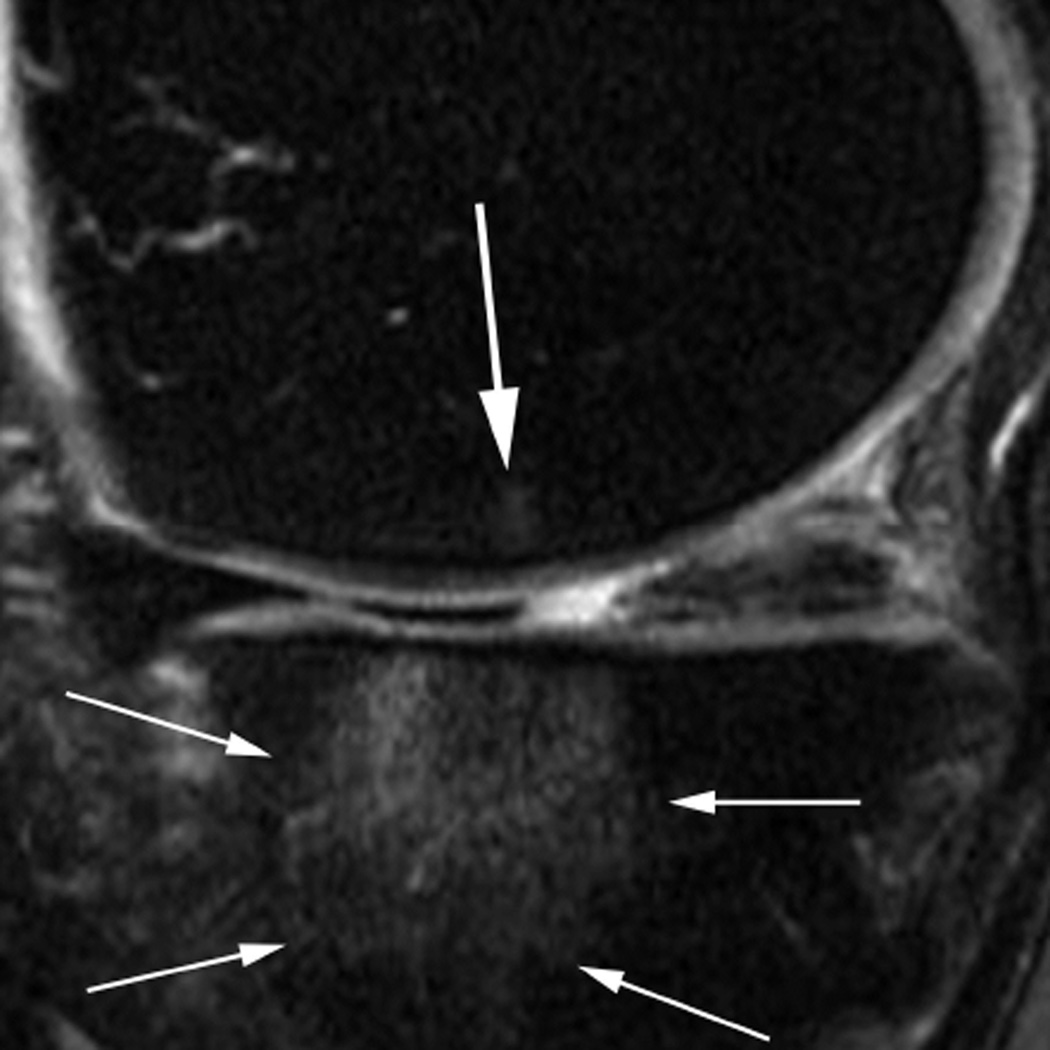
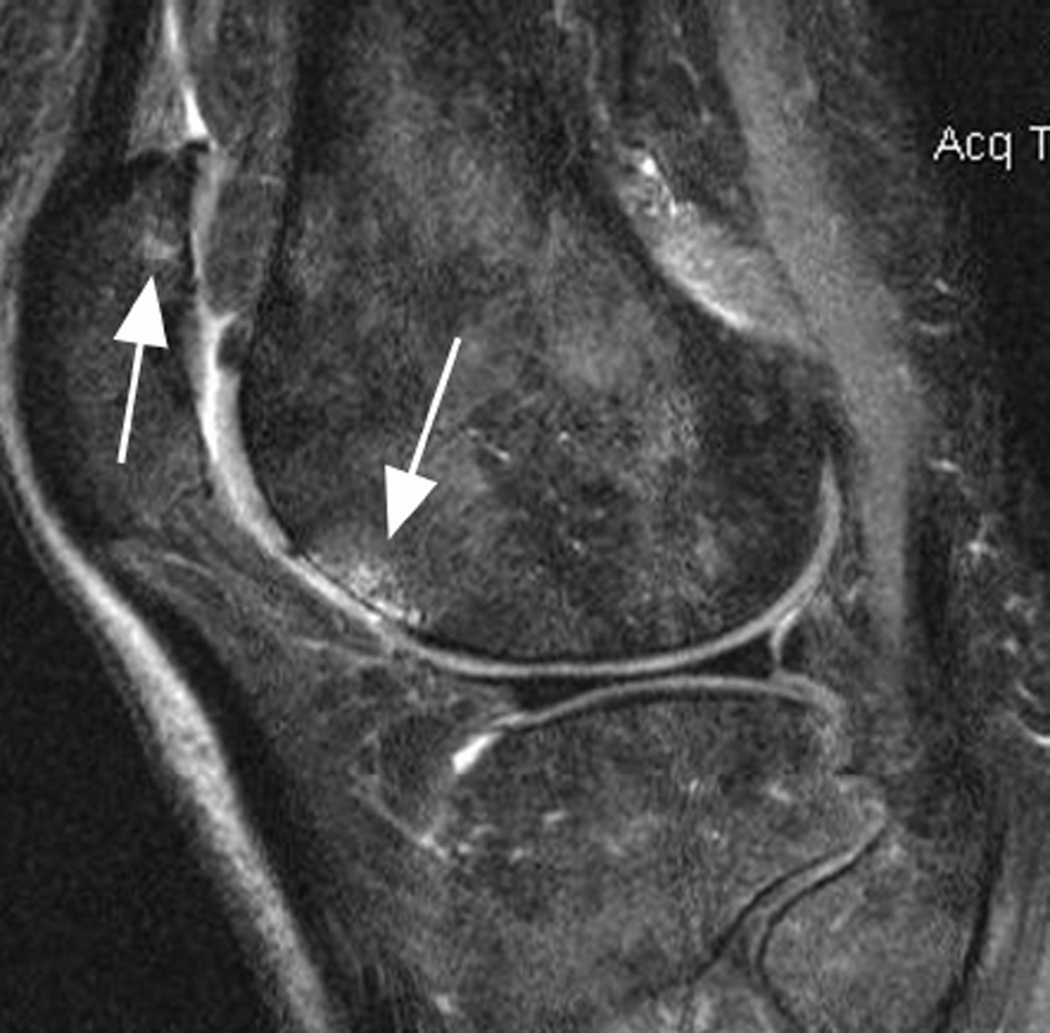
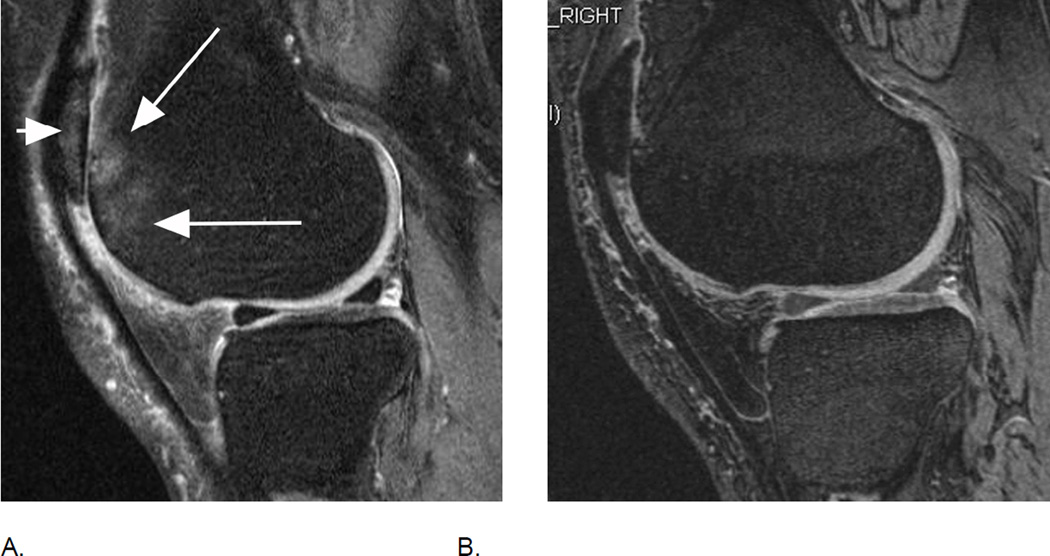
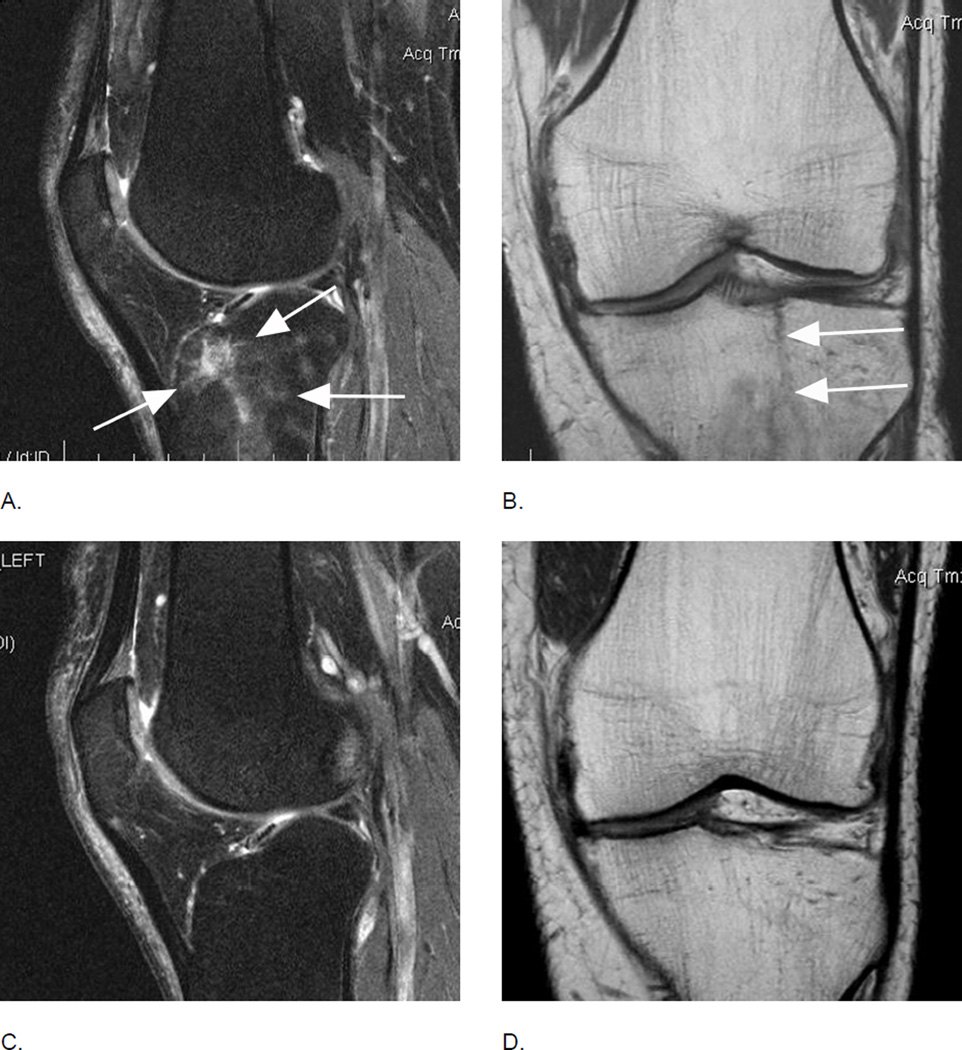
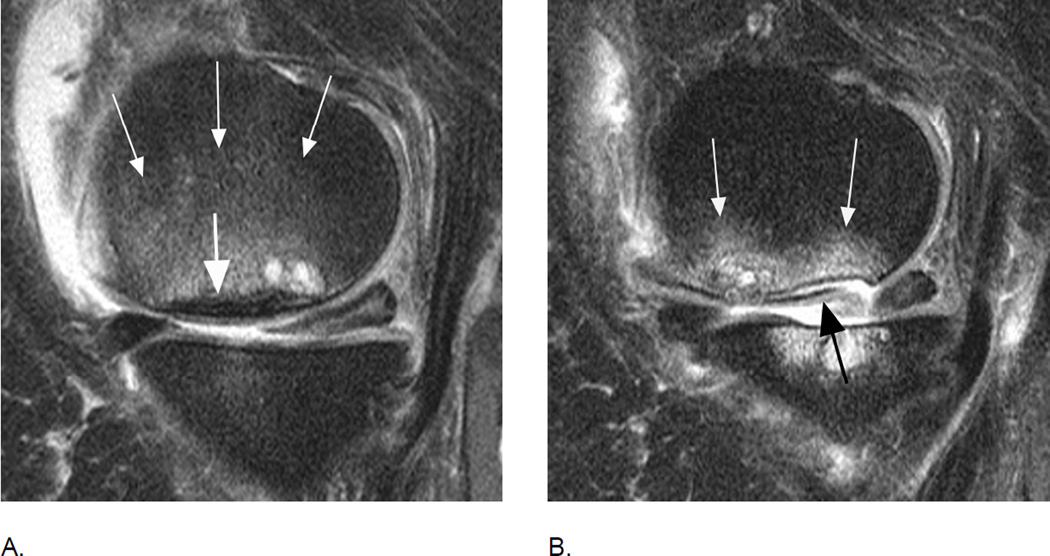
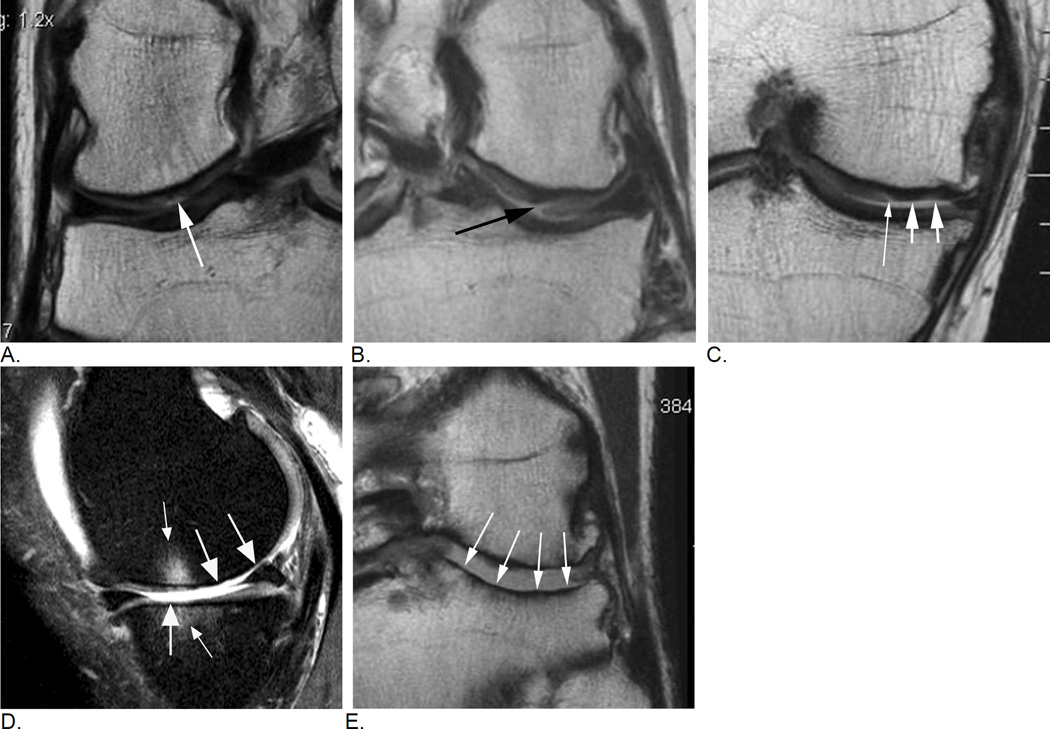
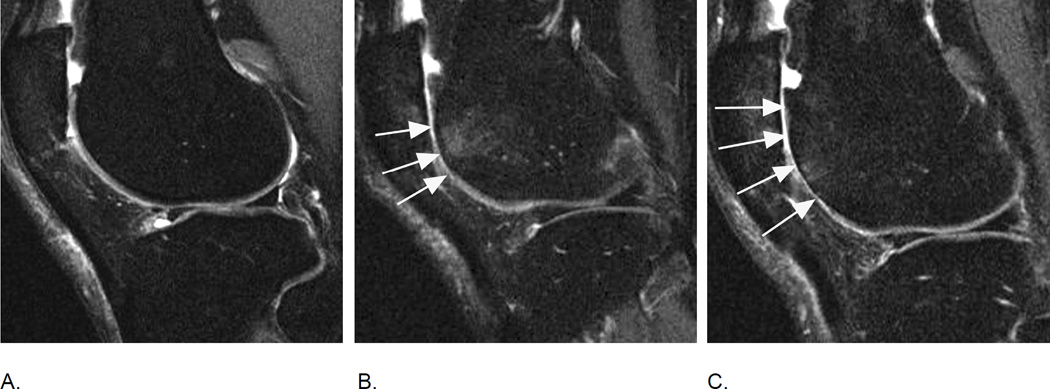
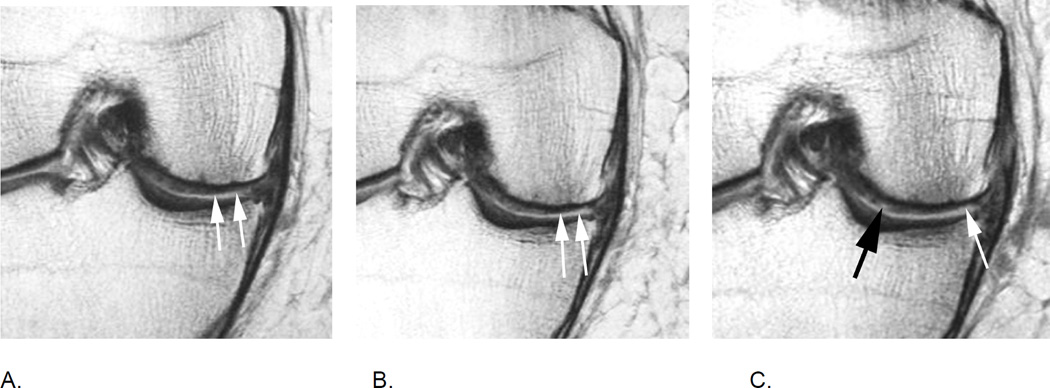
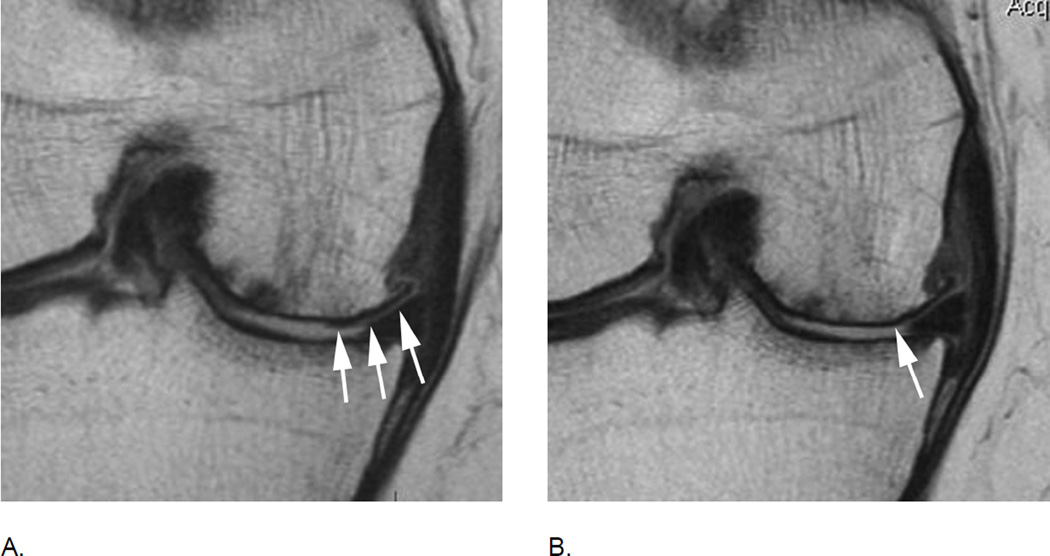
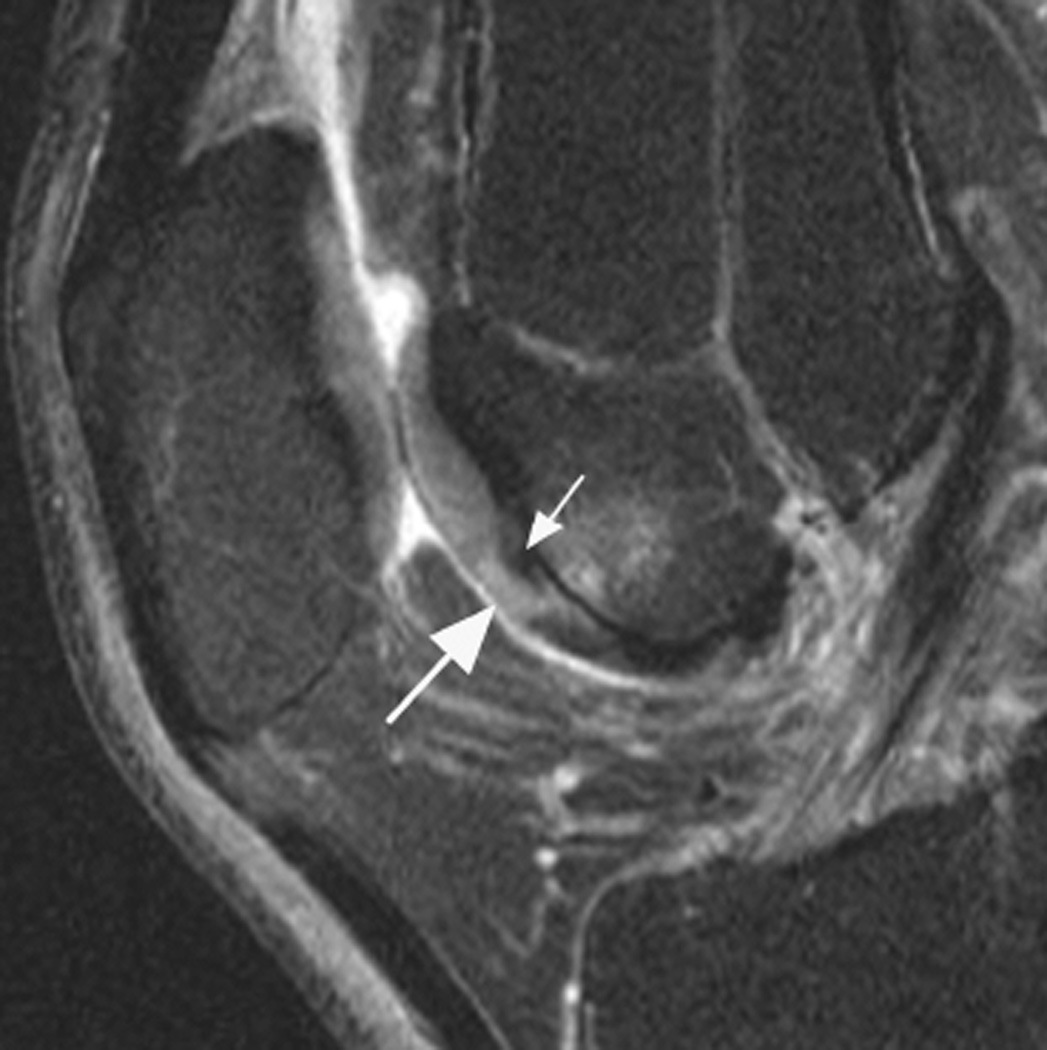
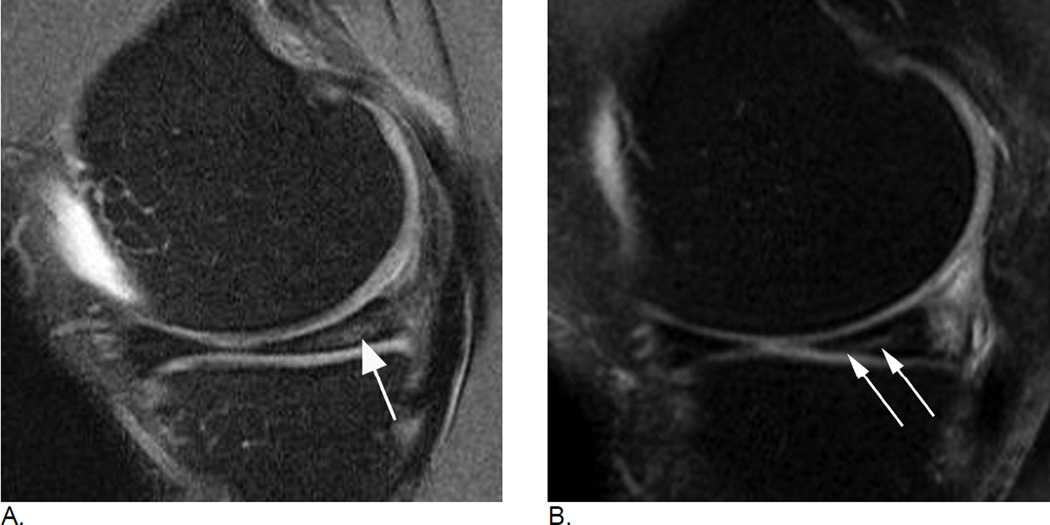
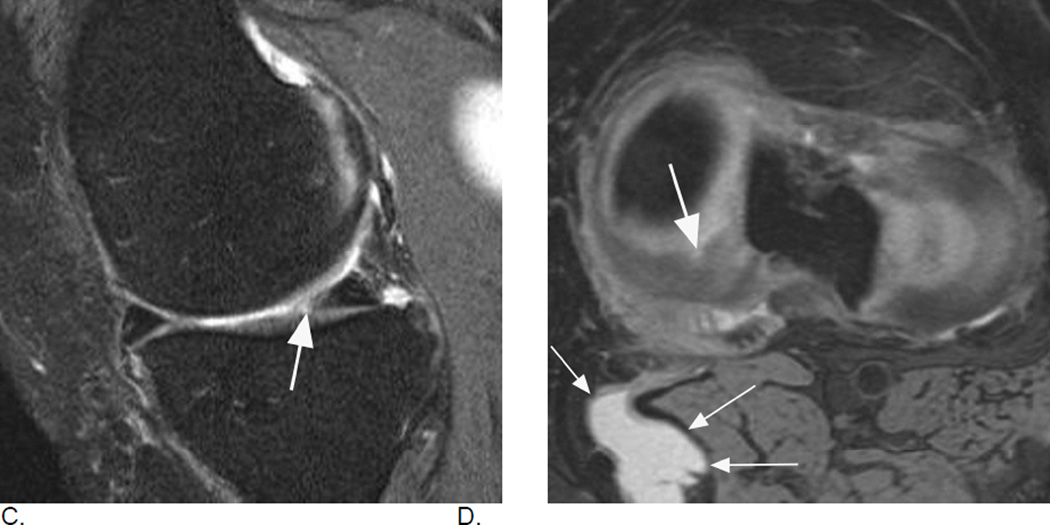
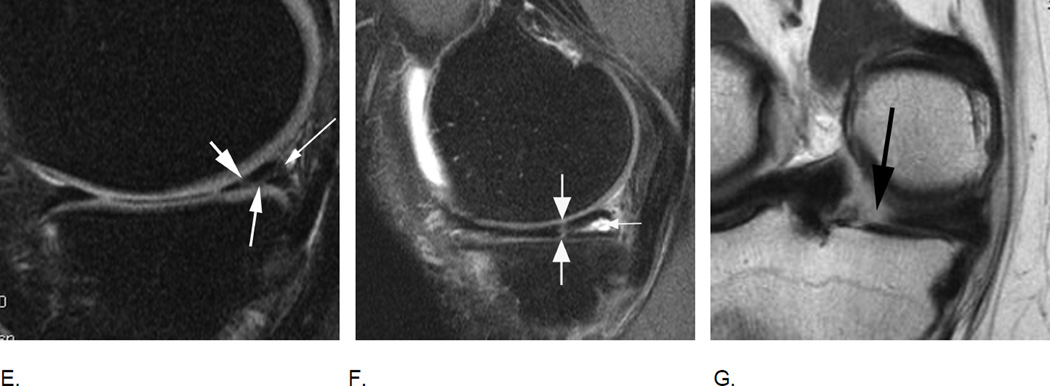
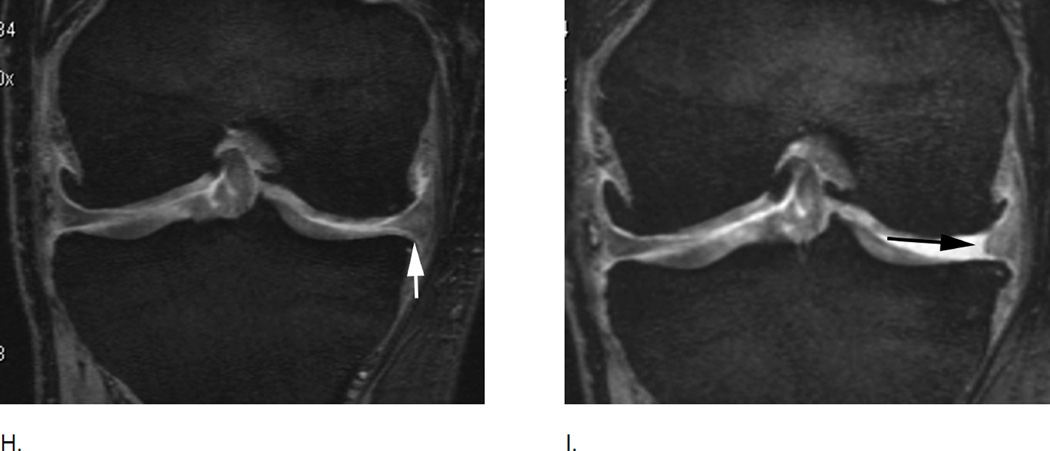
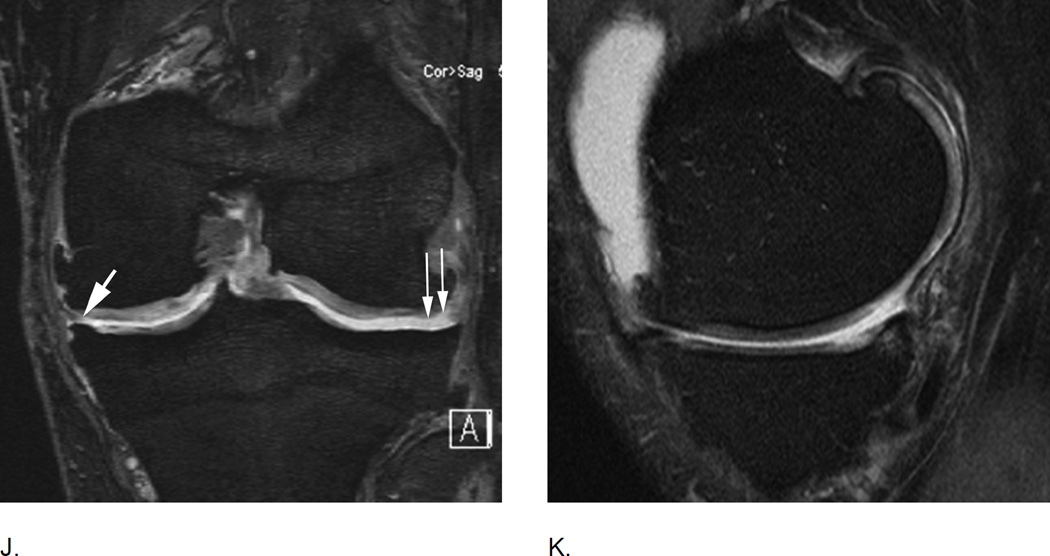
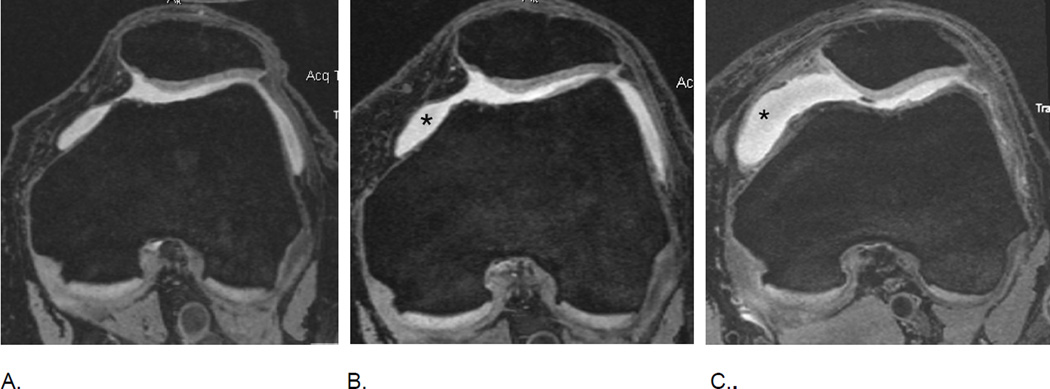
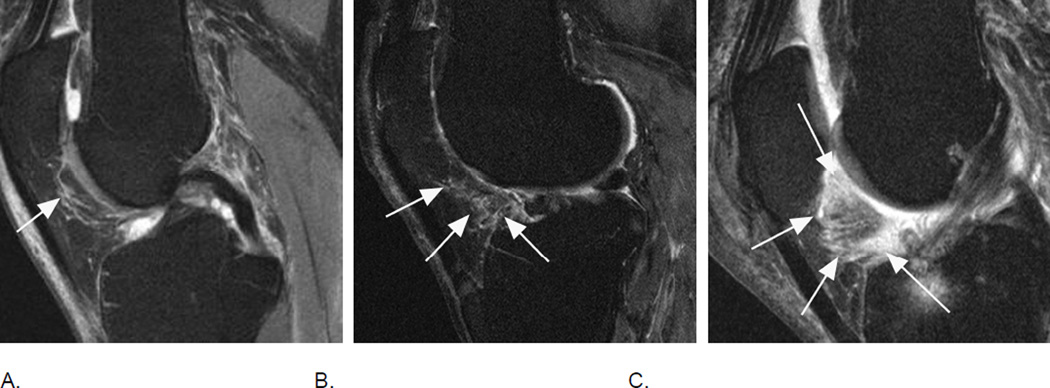
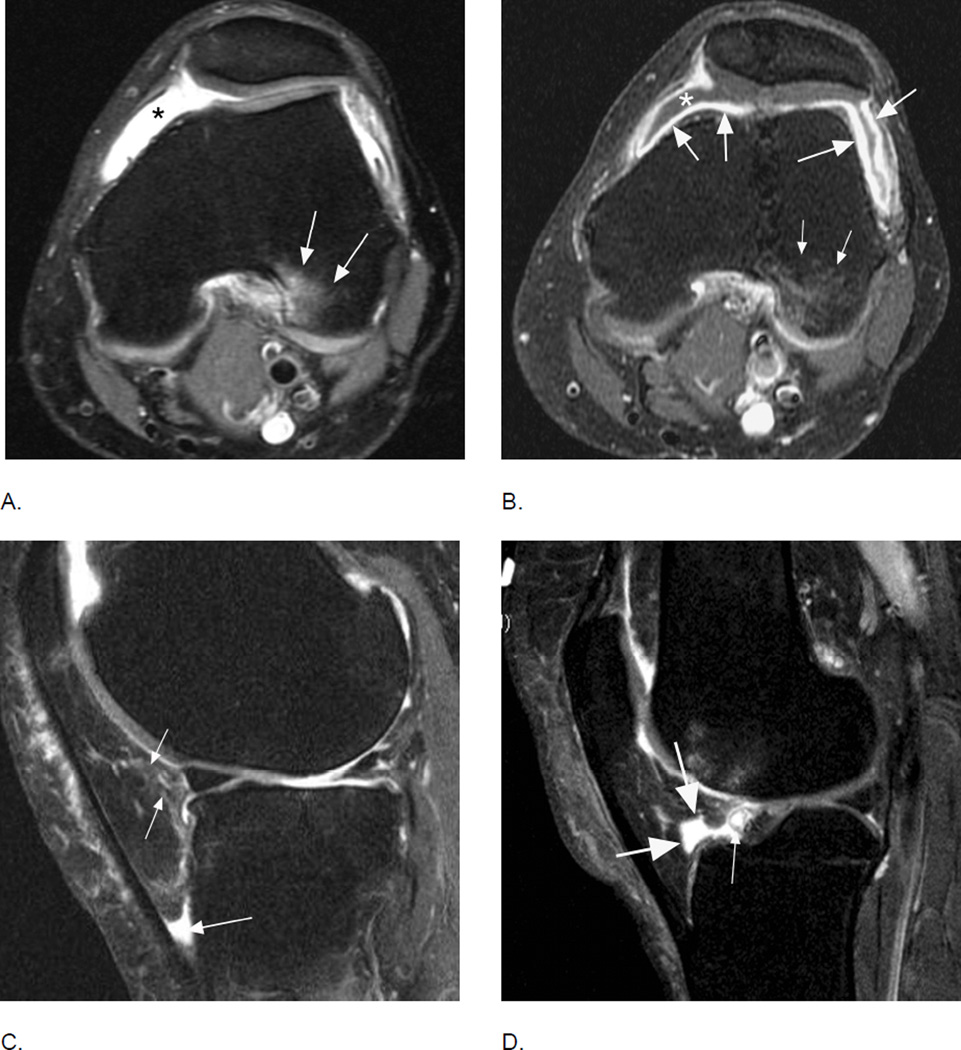
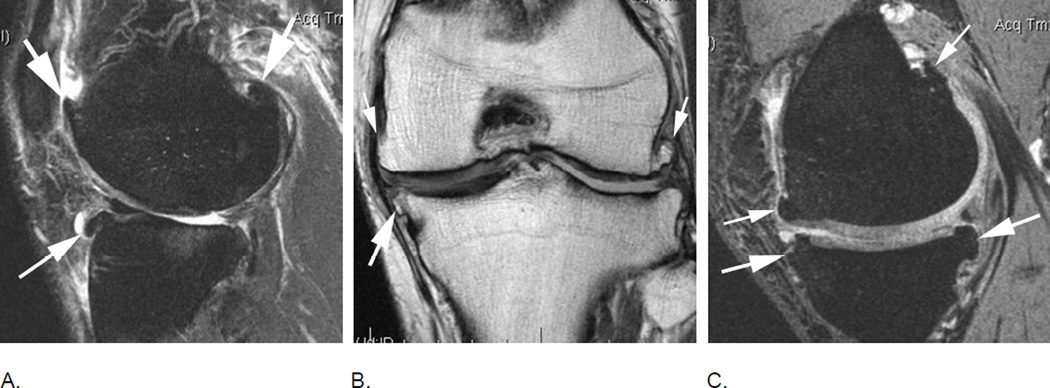
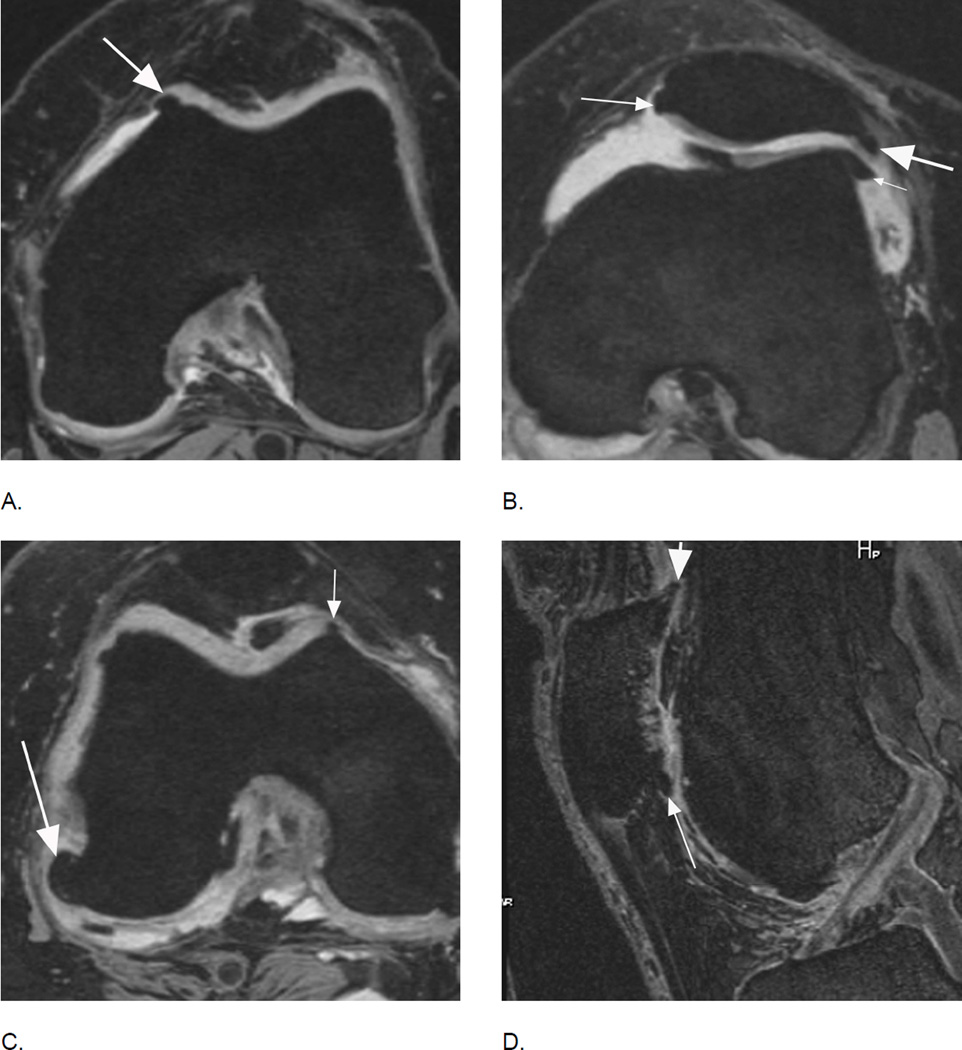
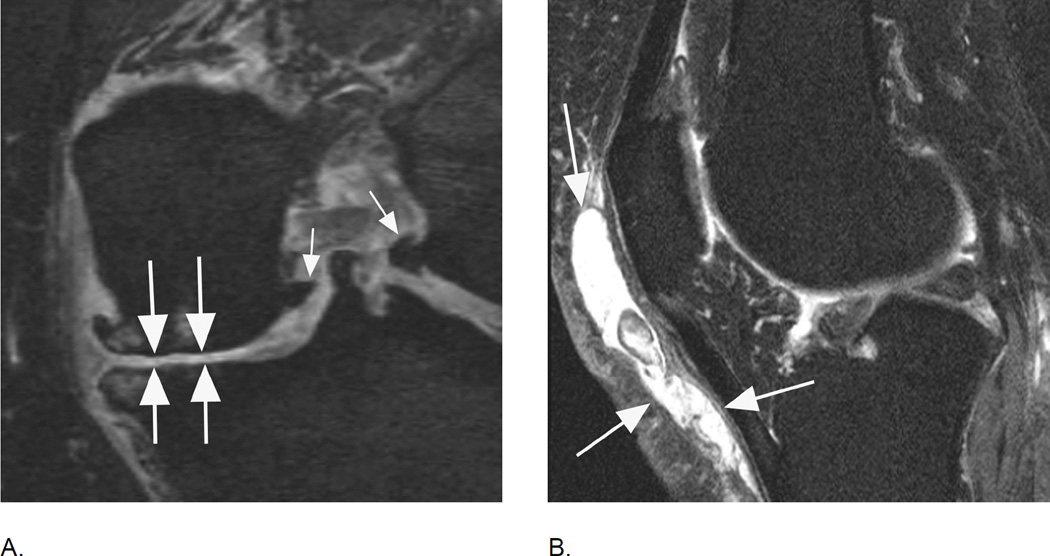
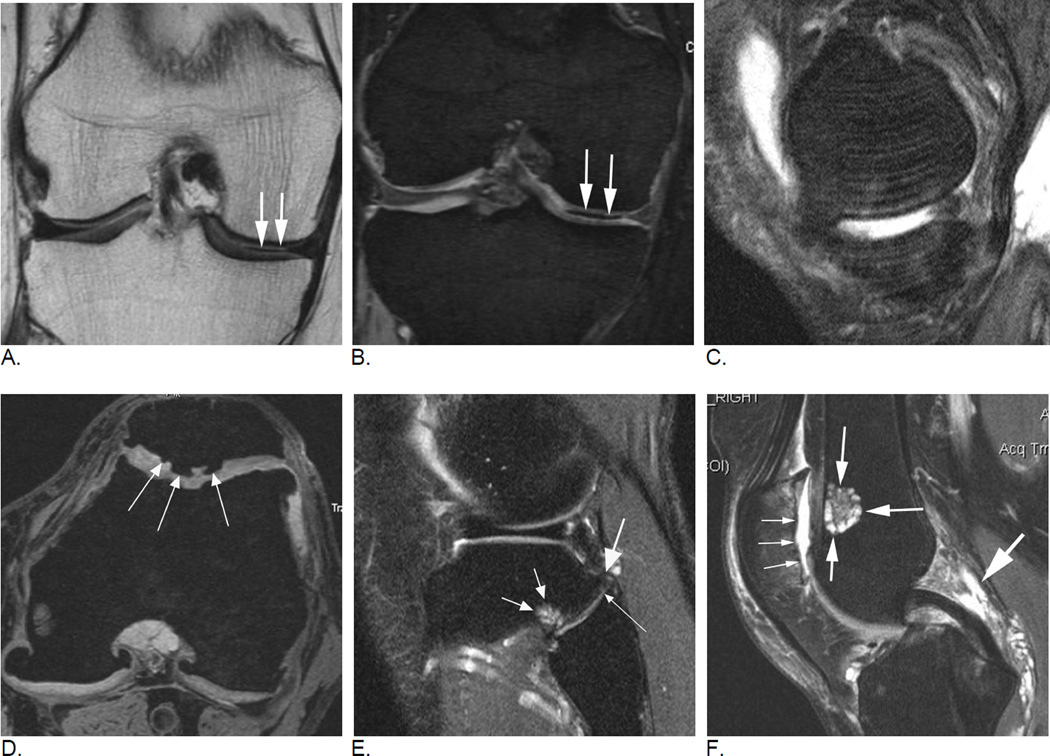
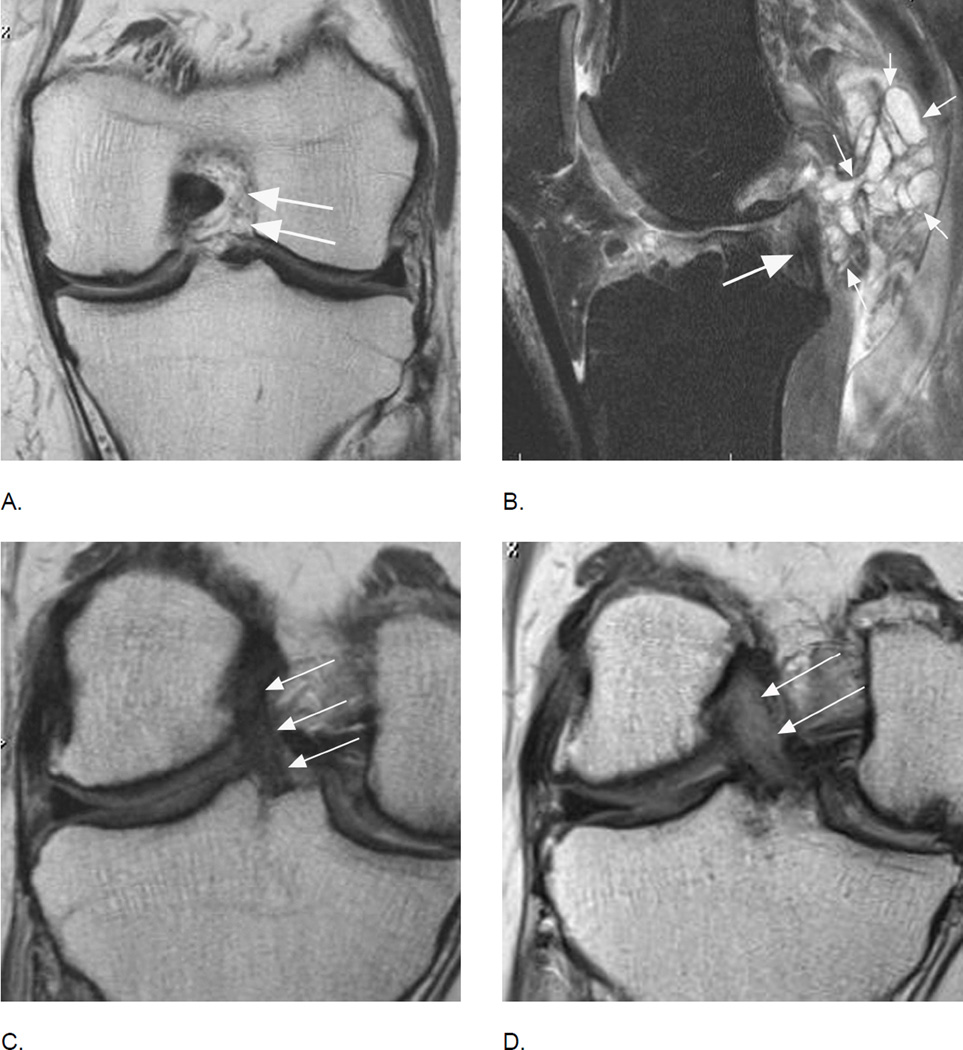
Design: While the main structure and methodology of each scoring system are publicly available, the core of this overview will be an illustrative imaging atlas section including image examples from multiple OA studies applying MRI in regard to different features assessed, show specific examples of different grades and point out pitfalls and specifics of SQ assessment including artifacts, blinding to time point of acquisition and within-grade evaluation.

Results: Similarities and differences between different scoring systems are presented. Technical considerations are followed by a brief description of the most commonly utilized SQ scoring systems including their responsiveness and reliability. The second part is comprised of the atlas section presenting illustrative image examples.

Conclusions: Evidence suggests that SQ assessment of OA by expert MRI readers is valid, reliable and responsive, which helps investigators to understand the natural history of this complex disease and to evaluate potential new drugs in OA clinical trials. Researchers have to be aware of the differences and specifics of the different systems to be able to engage in imaging assessment and interpretation of imaging-based data. SQ scoring has enabled us to explain associations of structural tissue damage with clinical manifestations of the disease and with morphological alterations thought to represent disease progression.

Keywords: Imaging; MOAKS; MRI; Osteoarthritis; Semi-quantitative scoring; WORMS.


Figures

Figure 1
Figure 1
Longitudinal assessment of bone marrow lesions (BML) in the lateral tibio-femoral and patello-femoral compartments. A. Baseline sagittal intermediate-weighted fat-suppressed MRI shows a grade 2 MOAKS / grade 3 WORMS BML in the anterior lateral femur displaying high-signal intensity, comprised of an ill-defined (edema-like) component (large arrows) and a well-defined cystic component (small arrows). In addition, there are small (MOAKS/WORMS grade 1) cystic BMLs in the subchondral anterior and posterior lateral tibia (small arrows). B. Follow-up MRI 1 year later shows slight decrease of overall lesion size (within-grade change for MOAKS, and change from grade 3 to grade 2 for WORMS) in the femur (large arrows) but increase of size of femoral cystic component (small arrows). While WORMS differentiates diffuse or ill-defined component from cystic component of BML as two distinct lesions, MOAKS takes both into account as one lesion and thus, would regard this as an overall decrease in lesion size while WORMS would score the increase in size of cystic portion as within-grade change. Note regression of cystic lesion in the posterior lateral tibia and increase of ill-defined (edema-like) portion of BML in the anterior lateral tibia now to a grade 2 lesion in MOAKS and WORMS (arrow). C. Further follow-up 1 year later, shows increase in overall lesion size in the anterior lateral femur (large arrows - now defined as grade 3 by both, MOAKS and WORMS). No relevant change in cystic portion of femoral and tibial BMLs in comparison to the previous visit is seen (small arrows). However, the ill-defined (edema-like) portion of the lesion in the anterior lateral tibia disappeared. D. 3 years after baseline, decrease in overall femoral lesion size (large arrows) is observed (now grade 2 by MOAKS and WORMS) while size of cystic portions of femoral and tibial BMLs remains stable (small arrows). However, there is progression of ill-defined portion of tibial BML (from grade 1 to grade 2 in the central lateral tibia for overall lesions size by MOAKS, and grade 0 to 1 for ill-defined BML only in WORMS).
Figure 2
Figure 2
Longitudinal BML assessment. Relevance of lesional vs. subregional scoring. A. Baseline sagittal intermediate-weighted fat-suppressed MRI shows two distinct ill-defined edema-like lesions in the central subregion of the medial femur (arrows). Overall lesion size in subregion qualifies as a grade 1 MOAKS / grade 2 WORMS lesion. B. Follow-up MRI one year later shows within-grade increase in overall subregional lesion size in the same subregion. In contrast to image A., now there are three distinct lesions (arrows). The single anterior lesion has split into two lesions with a decrease in lesion size, while the previous posterior lesion shows now an increase in lesion size. Note diffuse femoral cartilage loss in addition. C. Two-year follow-up MRI shows a decrease in overall femoral BML size with now a total subregional score of 1 using WORMS and MOAKS. There are two distinct lesions now with the most anterior lesion from image B. showing complete regression (small arrows). No cystic portion of lesions is observed. There is a large (grade 3 WORMS and MOAKS) incident lesion in the posterior medial tibia (large arrow). Without the clinical context posterior lesion can not be further characterized as traumatic bone contusions e.g. due to an anterior cruciate ligament tear may exhibit identical image morphology (reticular pattern with very diffuse borders atypical for OA-associated BMLs). Note further that articular cartilage in the posterior tibia is intact, which may further suggest a possible traumatic origin as OA-related BMLs are commonly associated with cartilage damage.
Figure 3
Figure 3
Relevance of bi-planar assessment. Some observational studies like the Osteoarthritis Initiative (OAI) obtain only one fat-suppressed sequence, which may result in challenges in regard to BML assessment. A. Sagittal fat-suppressed intermediate-weighted MRI shows a possible small (grade 1 in MOAKS / WORMS) femoral BML that is difficult to distinguish from a partial volume artifact (arrow). B. One year follow-up image shows a slight increase in lesion size that confirms the presence of a BML and qualifies as a within-grade change in both WORMS and MOAKS (arrow). C. Two year follow-up image shows a further increase in size (large arrow) with now an additional smaller lesion (small arrow). In WORMS increase in subregional overall lesion size will be coded as a grade 2, while BML is still a grade 1 lesion in MOAKS in regard to subregional lesion size. Number of lesions present is only coded in MOAKS but not WORMS.
Figure 4
Figure 4
BML incidence. A. Sagittal intermediate-weighted fat-suppressed MRI shows small MOAKS/WORMS grade 1 BML in the anterior subregion of the lateral femur (arrow).B. Follow-up image 1 year later shows incident BML in the same subregion (large arrow) with initial BML showing slight increase in size (small arrow). Overall scoring would be a within grade change of a grade 1 lesion using WORMS and MOAKS. Using MOAKS, the new BML would also be coded as increase in number of lesions from 1 to 2. Both lesions are ill-defined (edema-like) with no cystic portions.
Figure 5
Figure 5
BML in subspinous region. BMLs are scored in 15 articular subregions in both MOAKS and WORMS systems. While 14 of these subregions are in a subchondral location, one subregion is delineated by the tibial spines and is not associated with adjacent cartilage lesions but rather a result of traction to the cruciate ligaments that insert close to the tibial spines. Thus, when analyzing associations between subchondral BMLs and cartilage loss or clinical manifestations of disease, the subspinous BMLs are commonly excluded. Image example (sagittal fat-suppressed intermediate-weighted MRI) shows a grade 2 subspinous BML (intermediate sized arrows). Note additional partial thickness cartilage damage (grade 2.0 MOAKS, grade 3 WORMS) at the lateral patella (long arrow). In addition there is effusion-synovitis posterior to the posterior cruciate ligament, a common site of inflammatory disease manifestations in OA (short arrow).
Figure 6
Figure 6
Subregional BML assessment. Sagittal intermediate-weighted fat-suppressed image shows a large tibial edema-like BML that encompasses the anterior and central medial tibial subregions. Although radiologically only one lesion is observed (thin arrows), from a scoring perspective the lesion will be coded in two distinct subregions, a grade 3 (WORMS) / grade 2 (MOAKS) lesion the central tibia and a grade 2 (WORMS) / grade 1 (MOAKS and WORMS) lesion in the anterior tibia. In addition there is a small grade 1 (MOAKS and WORMS) edema-like lesion in the central medial femur (large arrow).
Figure 7
Figure 7
Differential diagnosis of BMLs. In cases of marrow infiltration or reconversion BMLs may be difficult to distinguish as the bone marrow has a hyperintense appearance that may be identical to OA-related BMLs. Cystic portions of lesions can usually be detected with adequate sensitivity but ill-defined (edema-lile) portions of lesions may not be discernible from red marrow or marrow infiltration. This example (sagittal fat-suppressed intermediate-weighted MRI) shows diffuse hyperintense marrow reconversion (due to thalassemia) and grade 1 (in MOAKS and WORMS) BMLs at the anterior lateral femur and the lateral patella (arrows). Note that only the cyst-like portion of lesion can be detected in femoral BML due to marrow reconversion.
Figure 8
Figure 8
Relevance of sequence selection for BML assessment. A. Sagittal intermediate-weighted fat-suppressed MRI shows diffuse, ill-defined BML in the anterior lateral femur (long arrows), representing a grade 3 lesion in MOAKS and WORMS. There is also a BML at the lateral patella (short arrow), also coded grade 3 in MOAKS and WORMS. B. Corresponding dual-echo at steady-state (DESS) MRI does not allow differentiation of BMLs from normal marrow due to magnetic susceptibility, although DESS is a sequence with T2-weighted image characteristics. This low sensitivity for BML detection, especially for edema-like lesions, is common for all gradient echo sequences, including DESS.
Figure 9
Figure 9
Traumatic BMLs. Differentiation between traumatic and degenerative OA-related BMLs may be challenging. This example allows a definite MRI-based diagnosis of a traumatic BML. A. Baseline sagittal fatsuppressed intermediate-weighted MRI shows a diffuse BML that is distant to the subchondral plate (arrows), which is a finding not seen in OA-related BMLs. B. Coronal proton density-weighted MRI shows a definite hypointense fracture line in the anterior tibia that confirms the traumatic origin of this finding (arrows). Follow- up images (C and D) 12 months later show complete resolution of lesion and fracture line, which is common for traumatic BMLs,.
Figure 10
Figure 10
Differential diagnosis of BMLs. A. Sagittal intermediate-weighted fat suppressed image shows a large grade 3 (MOAKS and WORMS) edema-like BML in the central medial femur (small arrows). Note diffuse subchondral hypointensity of 4 mm thickness representing a subchondral fracture in addition to the BML (large arrow). Further, there is a cystic portion adjacent to posterior aspect of the fracture line. B. 12 months later there is evidence of an osteochondral fracture with partial delamination of an osteochondral fragment (black arrow) and beginning deformity and collapse of the articular surface. Accompanying BML has decreased in size to a grade 2 (MOAKS) / grade 3 (WORMS) lesion (white arrows). In addition, at baseline there is a small central medial tibial BML (WORMS and MOAKS 1) with preserved cartilage. At follow-up, the BML increased in size (WORMS and MOAKS 3) with extensive loss of central and posterior tibial cartilage. The posterior horn of the medial meniscus showed a normal shape at baseline with linear intrameniscal signal reaching the undersurface representing a horizontal-oblique tear. At follow-up the posterior horn of the medial meniscus exhibits partial maceration. Note that effusion-synovitis decreased in size from baseline to follow-up. Thick areas of hypointensity representing subchondral fracture (also known as spontaneous osteonecrosis of the knee or SONK) have a negative prognosis in regard to structural joint preservation. SONK is not scored specifically in any of the scoring systems.
Figure 11
Figure 11
Typical image examples for different types of cartilage damage. A. A focal superficial defect not reaching the subchondral plate is shown in this coronal intermediate-weighted MRI (arrow). Lesion will be coded as a grade 1.0 lesion in MOAKS (i.e. grade 1 - less than 10% in regard to area involvement, and grade 0 in regard to % of lesion that is full thickness damage) or as grade 2 in WORMS (defined as focal superficial defect less than 1 cm in maximum diameter). B. Coronal intermediate-weighted MRI shows a focal defect that reaches the subchondral plate and is consequently defined as a grade 1.1 lesion using MOAKS (less than 10% in area involvement, less than 10% of subregion that is full thickness damage). In WORMS this lesion would be scored as a 2.5 lesion. A 2.5 lesion is not a reflection of a within-grade coding but a distinct grade by itself. C. Another coronal intermediate-weighted MRI shows an example of a MOAKS 2.1 lesion, which is defined as superficial damage involving between 10% and 75% of subregion (short arrows) plus a full thickness component involving less than 10% of subregion (thin arrow). WORMS does not allow scoring of this lesion as it does not fulfill criteria of a focal defect only (i.e. a grade 2.5 lesion in WORMS), not of superficial damage only (grade 3 in WORMS) of diffuse full thickness damage (grade 5). Readers would have to decide which one of these grades applies best, which would be grade 3 lesion while ignoring the full thickness component. Whether a small full thickness component is of relevance in regard to clinical or structural outcome needs to be shown. D. Sagittal intermediate-weighted fat-suppressed MRI depicts diffuse full thickness cartilage damage in the central subregion of the medial femur and the central medial tibia representing grade 2.2. lesion in MOAKS, and grade 5 lesions in WORMS (large arrows). There are associated subchondral bone marrow lesions visualized as ill-defined hyperintense areas (small arrows). E. Another example shows extensive full thickness cartilage damage of the central lateral tibia (arrows) qualifying as a grade 3.3. lesion in MOAKS and a grade 6 lesion in WORMS. In addition, there are marked articular surface contour alterations of the tibia termed bone attrition, a feature only assessed in WORMS but not MOAKS.
Figure 12
Figure 12
Evolution of cartilage damage over time. A. Baseline fat-suppressed intermediate-weighted MRI shows an intact articular cartilage surface in the anterior lateral femur. There is diffuse full thickness cartilage damage at the patella (WORMS 6, MOAKS 3.3). B. 12 months later areas of partial and full thickness cartilage damage in the anterior lateral femur are observed that will be graded as a MOAKS 2.2 lesion (10–75% of subregion with any cartilage loss, 10–75% of subregion with full thickness cartilage loss) and a grade 5 lesion using WORMS (arrows). C. Another 12 months later there is definite increase in area extent of lesion (arrows). Using MOAKS this lesion would now represent a grade 3.2 lesion (> 75% of subregion with any cartilage loss, 10–75% of subregions showing full thickness loss), in WORMS it would qualify as a grade 6 lesion (more than 75% of subregion affected by full thickness cartilage loss), although there is still some cartilage preserved especially towards the more central part of the subregion. Also there is an anterior lateral femoral BML at the first follow-up visit (WORMS grade 2, MOAKS grade 1) which shows decrease in size 12 month later (WORMS and MOAKS grade 1).
Figure 13
Figure 13
Within-grade cartilage assessment. A. Baseline coronal proton density-weighted MRI shows superficial cartilage damage (arrows) qualifying as a MOAKS grade 2.0 lesion (10–75% of subregion affected by any cartilage loss with 0% of subregion being affected by full thickness damage), representing a WORMS grade 3 lesion (multiple areas of partial-thickness defects intermixed with areas of normal thickness, or a defect wider than 1 cm but <75% of the region). B. 12 months later, there is subtle but definite increase in cartilage loss (arrows) defined as within-grade change in both WORMS and MOAKS. C. At 24 months follow up there is further discrete increase in superficial cartilage damage (white arrow) defined as within-grade change. In addition there is an incident small full thickness defect more centrally (black arrow), which defines the lesion as a grade 2.1 using MOAKS. In WORMS lesion cannot be specifically graded and will likely be coded as a grade 3 lesion not taking into account the full thickness component.
Figure 14
Figure 14
Progression of cartilage damage in advanced disease. A. Baseline coronal proton density-weighted MRI shows diffuse full thickness cartilage loss (grade 3.3 MOAKS, grade 6 WORMS) in the central subregion of the medial femur. There is still cartilage remaining at the periphery of the joint (arrows). B. 12 months later there is definite progression of cartilage loss qualifying as within grade change (arrow). Although counter-intuitive from a clinical perspective, knees with advanced disease including radiographic stages grade 4 according to the Kellgren-Lawrence classification show the most rapid progression of cartilage loss. Note that by the introduction of within-grade change the limitation of ceiling effects in ordinal scoring was overcome as even a grade 6 WORMS/ 3.3 MOAKS lesion may still progress and such progress may be coded as within-grade change.
Figure 15
Figure 15
Intrachondral signal change. A. Sagittal intermediate-weighted fat-suppressed MRI shows an intact cartilage surface without morphologic defects. There is an intrachondral hyperintensity signal change that is scored in WORMS as a grade 1.0 lesion but not coded in MOAKS as the clinical relevance of intrasubstance signal changes is unclear and dependent on MRI sequence applied. In addition, and particularly in the area of the femoral trochlea, so-called magic angle artifacts that occur at 55° to the main magnetic field (B0) may result in intracartilaginous signal alterations. In addition, image shows a discrete hypointense signal change that likely represents intrachondral calcification, which is not coded in either MOAKS or WORMS (small arrow). Note subchondral BML subjacent to the cartilage signal abnormality grade 1 at both WORMS and MOAKS
Figure 16
Figure 16
Different types of meniscal damage. While WORMS uses a 0 to 4 scale to grade meniscal damage, the MOAKS systems applies a more complex and more comprehensive assessment of meniscal pathology including meniscal signal, different tear types, and types of meniscal substance loss / maceration. A. Sagittal intermediate-weighted fat-suppressed MRI depicts intramensical high signal in the posterior horn of the medial meniscus that does not reach the meniscal surface (arrow). Intrameniscal signal is only scored in the MOAKS system and is considered to represent mucoid degeneration of the meniscal fibrocartilage. Clinical relevance of meniscal signal is being discussed controversially. B. Example of a horizontal-oblique tear reaching the meniscal undersurface (arrows). This tear type is part of the spectrum of structural MRI manifestations of OA. A tear is defined on MRI as linear meniscal signal that reaches the meniscal surface on at least two consecutive slices. The present example would be scored as a grade 1 lesion (parrot-beak) in the WORMS scale, while MOAKS uses a descriptive coding of meniscal pathology. C. and D. Example of a radial tear. A radial tear involves the so-called “white”, non-vascularized inner zone of the meniscus. A small substance defect is seen on the sagittal intermediate-weighted fat suppressed image (arrow in C) that is confirmed and well-visualized on the corresponding high resolution axial dual-echo at steady-state (DESS) image in D (large arrow). In addition, there is a popliteal (Baker’s) cyst in the typical medial location between the tendons of the medial gastrocnemius and semimembranosus (small arrows). E. Sagittal intermediate-weighted fat-suppressed MRI shows a complex meniscal tear of the posterior horn of the medial meniscus that reaches the posterior margin (thin arrow), the femoral (short arrow) and the tibial surfaces (intermediate arrow). Such a tear would be scored as a grade 2 lesion using the WORMS system. F. Another example of a complex tear shows a vertical tear of the medial posterior horn (large arrows) and in addition a horizontal tear communicating with an intrameniscal cyst (small arrow). Meniscal cysts are scored in MOAKS but not WORMS. G. Radial meniscal root tears are rare but clinically very relevant as these are associated with fast progression of cartilage loss. They are often associated with significant meniscal extrusion and hypertrophy. Coronal intermediate-weighted MRI shows a radial meniscal root tear of the medial posterior horn, which is visualized as a gap in the posterior central part of the meniscus (arrow). Root tears are coded in MOAKS, in WORMS these would be recorded as a grades 2 or 3 although not specifically mentioned in the scoring system. H. Meniscal maceration is commonly observed in OA knees. Baseline coronal dual echo at stead state (DESS) image shows a normal body of the medial meniscus without evidence of a tear of substance loss but little extrusion (grade 1 MOAKS) I. Two years later, there is evidence of substance loss in concerning the central part of the body region (also referred to as the “white zone”). This is finding is also termed partial meniscal maceration. J. Coronal dual echo at steady state (DESS) image shows complete missing body of the medial meniscus (small thin arrows) consistent with complete maceration. There is advanced partial maceration laterally (short thick arrow). K. Corresponding sagittal intermediate-weighted fat suppressed image confirms complete substance loss of the medial meniscus likely due to meniscectomy. Non surgically induced maceration and surgical removal of the meniscus can not be differentiated unless there are other imaging signs that give evidence of prior surgery.
Figure 16
Figure 16
Different types of meniscal damage. While WORMS uses a 0 to 4 scale to grade meniscal damage, the MOAKS systems applies a more complex and more comprehensive assessment of meniscal pathology including meniscal signal, different tear types, and types of meniscal substance loss / maceration. A. Sagittal intermediate-weighted fat-suppressed MRI depicts intramensical high signal in the posterior horn of the medial meniscus that does not reach the meniscal surface (arrow). Intrameniscal signal is only scored in the MOAKS system and is considered to represent mucoid degeneration of the meniscal fibrocartilage. Clinical relevance of meniscal signal is being discussed controversially. B. Example of a horizontal-oblique tear reaching the meniscal undersurface (arrows). This tear type is part of the spectrum of structural MRI manifestations of OA. A tear is defined on MRI as linear meniscal signal that reaches the meniscal surface on at least two consecutive slices. The present example would be scored as a grade 1 lesion (parrot-beak) in the WORMS scale, while MOAKS uses a descriptive coding of meniscal pathology. C. and D. Example of a radial tear. A radial tear involves the so-called “white”, non-vascularized inner zone of the meniscus. A small substance defect is seen on the sagittal intermediate-weighted fat suppressed image (arrow in C) that is confirmed and well-visualized on the corresponding high resolution axial dual-echo at steady-state (DESS) image in D (large arrow). In addition, there is a popliteal (Baker’s) cyst in the typical medial location between the tendons of the medial gastrocnemius and semimembranosus (small arrows). E. Sagittal intermediate-weighted fat-suppressed MRI shows a complex meniscal tear of the posterior horn of the medial meniscus that reaches the posterior margin (thin arrow), the femoral (short arrow) and the tibial surfaces (intermediate arrow). Such a tear would be scored as a grade 2 lesion using the WORMS system. F. Another example of a complex tear shows a vertical tear of the medial posterior horn (large arrows) and in addition a horizontal tear communicating with an intrameniscal cyst (small arrow). Meniscal cysts are scored in MOAKS but not WORMS. G. Radial meniscal root tears are rare but clinically very relevant as these are associated with fast progression of cartilage loss. They are often associated with significant meniscal extrusion and hypertrophy. Coronal intermediate-weighted MRI shows a radial meniscal root tear of the medial posterior horn, which is visualized as a gap in the posterior central part of the meniscus (arrow). Root tears are coded in MOAKS, in WORMS these would be recorded as a grades 2 or 3 although not specifically mentioned in the scoring system. H. Meniscal maceration is commonly observed in OA knees. Baseline coronal dual echo at stead state (DESS) image shows a normal body of the medial meniscus without evidence of a tear of substance loss but little extrusion (grade 1 MOAKS) I. Two years later, there is evidence of substance loss in concerning the central part of the body region (also referred to as the “white zone”). This is finding is also termed partial meniscal maceration. J. Coronal dual echo at steady state (DESS) image shows complete missing body of the medial meniscus (small thin arrows) consistent with complete maceration. There is advanced partial maceration laterally (short thick arrow). K. Corresponding sagittal intermediate-weighted fat suppressed image confirms complete substance loss of the medial meniscus likely due to meniscectomy. Non surgically induced maceration and surgical removal of the meniscus can not be differentiated unless there are other imaging signs that give evidence of prior surgery.
Figure 17
Figure 17
Meniscal extrusion is a common finding in knee OA and is associated with cartilage loss longitudinally. A. Baseline image shows normal meniscal alignment in regard to its position at the tibial margin. There are medial marginal osteophytes. B. Follow-up image 2 years later shows marked (grade 3 using the MOAKS system) medial extrusion (double-headed arrow). In addition there are marked tibio-femoral cartilage loss and subchondral bone changes.
Figure 18
Figure 18
MRI of markers of inflammation in OA. Fluid sensitive sequences are capable of delineating intraarticular joint fluid. However, a distinction between true joint effusion and synovial thickening is not possible as both are visualized as hyperintense signal within the joint cavity. For this reason the term effusion-synovitis has been introduced, which is scored based on the distension of the joint capsule for both systems, WORMS and MOAKS, and is graded collectively from 0 to 3 in terms of the estimated maximal distention of the synovial cavity with 0=normal, grade 1=<33% of maximum potential distention grade 2=33%–66% of maximum potential distention and grade 3=>66% of maximum potential distention. Axial dual-echo at steady-state (DESS) MR images show A. grade 1 effusion-synovitis, B. grade 2 effusion-synovitis (asterisk) with medial patellar cartilage damage and C. grade 3 effusion-synovitis (asterisk).
Figure 19
Figure 19
Signal changes in Hoffa’s fat pad are commonly used as a surrogate for synovitis on non contrast-enhanced MRI. While these structural changes have been used for a long time they have not been described in the WORMS system but have been incorporated in the MOAKS system. Although synovitis can only be visualized directly on contrast-enhanced sequences, it has been shown that Hoffa’s signal changes are a sensitive but non-specific surrogate of synovitis. A. Sagittal intermediate-weighted fat-suppressed MRI shows a discrete ill-defined hyperintense signal alteration in Hoffa’s fat pad consistent with grade 1 Hoffa-synovitis (arrow). Note diffuse cartilage loss of the patella. B. A grade 2 signal change within the fat pad is shown in this example (arrows). There is a diffuse cartilage loss at the patellofemoral joint. C. Severe, grade 3 signal alterations almost occupying the entire fat pad are seen in this image (arrows). There is a cyst as well as edema-like BML at the tibial insertion of the ACL and a grade 1 effusion-synovitis.
Figure 20
Figure 20
Comparison of inflammatory manifestations of disease using non-enhanced and contrast-enhanced sequences. A. Axial intermediate-weighted fat-suppressed MRI shows homogeneous hyperintensity within the joint cavity consistent with grade 2 effusion-synovitis by MOAKS and WORMS (asterisk). Note BML in the posterior lateral femoral condyle consistent with traction edema at the insertion of the anterior cruciate ligament (arrows). B. Corresponding T1-weighted fat-suppressed image after intravenous contrast administration clearly differentiates between intraarticular joint fluid depicted as hypointensity (asterisk) and true synovial thickening visualized as hyperintense contrast enhancement of the synovial membrane (large arrows). Note that BMLs are similarly depicted on T2-weighted fat-suppressed and T1-weighted contrast-enhanced fat-suppressed MRI (small arrows). C. Sagittal fat-suppressed proton density-weighted MRI shows a grade 1 hyperintensity in Hoffa’s fat pad (small arrows). In addition there is fluid-equivalent joint fluid in the deep infrapatellar bursa (large arrow) consistent with bursitis. Hoffa’s fat pad pathology is common and several differential diagnoses have to be considered to correctly interpret imaging findings. D. Example of physiologic cleft in Hoffa’s fat pad, which communicates with the intraarticular cavity (large arrows). Clefts are common and must not be mistaken for cystic lesions. Clefts should be excluded whenever applying segmentation approaches to quantify Hoffa’s volume. In addition there is a small Hoffa-cyst likely originating from the anterior horn of the lateral meniscus not to be mistaken as being part of the cleft (thin arrow).
Figure 21
Figure 21
Osteophytes are one of the hallmark features of OA on imaging and part of the disease definition on X-rays. While WORMS uses a complex approach of osteophytes scoring on a 0–7 scale at 16 articular anatomical locations, MOAKS applies a somewhat simplified scheme on a 0–3 scale at only 12 different locations omitting the scores of the anterior and posterior medial and lateral tibia. A. Sagittal fat-suppressed intermediate-weighted image of the lateral tibio-femoral compartment shows a moderate sized MOAKS grade 2 / WORMS grade 4 osteophyte at the anterior femur, a MOAKS grade 3 / WORMS grade 5 osteophyte at the posterior femur (short arrows) and a WORMS grade 5 osteophyte (long arrow) at the anterior lateral tibia (location not considered in MOAKS). Note diffuse cartilage loss at the central and posterior lateral tibia and femur and subchondral BML of the lateral tibial plateau, with moderate bone remodeling (attrition grade 2 in WORMS). B. Marginal osteophytes in the coronal plane are similarly considered in MOAKS and WORMS. Example shows femoral osteophytes (small arrows – MOAKS grade 2 / WORMS grade 4 medial; MOAKS grade 3 / WORMS grade 6 lateral) and a moderate osteophyte at the medial tibia (large arrow – MOAKS grade 2 / WORMS grade 4). There is diffuse cartilage loss at the central lateral tibial and femur with moderate lateral tibial plateau remodeling (attrition). C. Sagittal dual-echo at steady-state (DESS) MRI of the medial tibio-femoral compartment shows moderate-sized (MOAKS grade 2 / WORMS grade 3) osteophytes at the anterior and posterior medial femur (small arrows). At the tibia there is a tiny anterior osteophyte (WORMS grade 1) and a moderate-to-large sized posterior osteophyte (WORMS grade 5). Tibial locations are not scored in the sagittal plane using MOAKS.
Figure 22
Figure 22
Both scoring systems may assess patellar osteophytes at the medial, lateral, superior and inferior locations, while anterior femoral osteophytes also scored in both systems. A. Axial dual-echo at steady-state (DESS) MRI shows a small (grade 1 MOAKS / grade 2 WORMS) osteophyte at the anterior medial femur (arrow). B. Another axial image shows a small (grade 1 MOAKS / grade 2 WORMS) osteophyte at the medial patella (small arrow) and a moderate-sized (grade 2 MOAKS / Grade 4 WORMS) osteophyte at the anterior lateral patella (large arrow). In addition there is a moderate-sized osteophyte (grade 2 MOAKS / grade 3 WORMS) at the anterior lateral femur (very small arrow). In addition there is cartilage loss at the lateral patello-femoral joint. C. A large posterior lateral femoral osteophyte (large arrow - grade 3 MOAKS / grade 6 WORMS) and a small intrachondral osteophytes (small arrow) is seen in this example. Note that intrachondral osteophytes are not scored in either system. D. Sagitttal DESS image shows a moderate-sized osteophyte at the superior patella (large arrow – grade 2 MOAKS / grade 4 WORMS) and the inferior patella pole (small arrow - grade 2 MOAKS / grade 3 WORMS). In addition, there is severe cartilage loss at the patello-femoral compartment with subchondral cystic changes at the patella
Figure 23
Figure 23
Several other features besides the core OA structures are being assessed that differ in the MOAKS and WORMS scoring system. For example MOAKS does not encompass scoring of bone attrition, a measure of deformity/remodeling of the articular surface while WORMS does assess attrition on a 0–3 scale in multiple subregions,. Both systems score periarticular features including synovial cysts and bursal collections with WORMS assessing these from 0 to 3 while MOAKS uses a dichotomized approach. A. Coronal DESS MRI shows medial tibio-femoral bone attrition grade 1 of the tibial and grade 2 of the central femoral subregions (arrows). The articular surfaces are flattened but there is no increased concavity of the tibia, a sign of advanced bone attrition. B. Sagittal intermediate-weighted fat-suppressed MRI shows a large (grade 3 in WORMS) subcutaneous, pre-patellar heterogeneous fluid collection consistent with prepatellar bursitis that may be a cause of clinical symptoms (arrows).
Figure 24
Figure 24
Readers will encounter incidental findings and artifacts that either are not covered by the scoring systems or may impair image assessment. Any reader should have profound knowledge of MRI artifacts in order to distinguish these artifacts from potentially clinically relevant findings. A. Coronal intermediate-weighted (spin echo) MRI shows a hypointense line within the medial tibio-femoral joint space extending to and not to be differentiated from the body of the medial meniscus (arrows). B. Coronal DESS (gradient echo) MRI shows that hypointensity is a distinct structure not in relation to the meniscus (arrows). Finding represents a susceptibility artifact due to vacuum phenomenon, a common finding in knee OA that potentially may impair especially quantitative image assessment. C. Motion. Sagittal intermediate-weighted fat-suppressed image shows repetitive hyperintense lines through the femoral and tibial subchondral bone mirroring the articular surface contour (arrows). Finding represents a motion artifact (also called zebra artifact) due to knee movement during the MRI acquisition. This artifact primarily impairs assessment of the cartilage and subchondral bone but may also mimic a meniscal tear. D. Axial DESS MRI depicts hypointense changes within the patellar cartilage that represent intrachondral osteophytes of unknown clinical relevance (arrows). These osteophytes commonly do not alter the cartilage surface and may only be detected on imaging but not arthroscopy. Neither scoring system assesses intrachondral osteophytes. E. Tibio-fibular OA is not scored in MOAKS or WORMS. Sagittal intermediate-weighted fat suppressed image shows characteristic signs of OA in this example including a tibial osteophyte (large arrow), joint space narrowing (long thin arrow) and a tibial subchondral bone marrow lesion (short small arrows). Especially in the absence of features of tibio-femoral OA, tibio-fibular OA may explain clinical symptoms such as lateral knee pain. F. An ovoid, lobulated hyperintense lesion is seen in the anterior aspect of the metaphyseal femur (intermediate-sized arrows). The chondroid matrix (salt and pepper-appearance on MRI) of the lesion is characteristic for a typical enchondroma, a finding of no or only little clinical relevance. Note additional features of OA such as diffuse full thickness cartilage loss of the lateral patella (small arrows), and marked effusion-synovitis posterior to the posterior cruciate ligament (large arrow), the commonest location of synovitis in the OA joint.
Figure 25
Figure 25
Anterior cruciate ligament tears are associated with osteoarthritis longitudinally but may also be part of the disease process without a history of trauma. A. Coronal intermediate-weighted MRI shows absence of the ACL. Only intraarticular, extrasynovial fat and no ligamentous fibers are seen at the typical location of the ACL (arrows). B. Another example shows a partial tear of the posterior cruciate ligament (PCL) with hyperintense signal changes and thinning of the ligament (large arrow). In addition there is a large multi-lobulated ganglion cyst adjacent to the PCL (small arrows) that may be a source of symptoms. Further, note diffuse fissuring of the cartilage of the anterior lateral femur. C. Baseline coronal image shows a normal course, signal intensity and thickness of the ACL (arrows). D. Corresponding follow-up image 24 months later shows marked thickening and diffuse hyperintensity of the ligament representing mucoid degeneration, a finding not covered by either scoring system that may potentially be of clinical relevance. In addition, note diffuse cartilage loss at the medial central femur and tibia, which has progressed at follow-up with an incident subchondral femoral cyst.

References

    1. Peterfy CG, Guermazi A, Zaim S, Tirman PF, Miaux Y, White D, et al. Whole-Organ Magnetic Resonance Imaging Score (WORMS) of the knee in osteoarthritis. Osteoarthritis Cartilage. 2004;12:177–190. - PubMed
    1. Guermazi A, Roemer FW, Haugen IK, Crema MD, Hayashi D. MRI-based semiquantitative scoring of joint pathology in osteoarthritis. Nat Rev Rheumatol. 2013;9:236–251. - PubMed
    1. Kornaat PR, Ceulemans RY, Kroon HM, Riyazi N, Kloppenburg M, Carter WO, et al. MRI assessment of knee osteoarthritis: Knee Osteoarthritis Scoring System (KOSS)--inter-observer and intra-observer reproducibility of a compartment-based scoring system. Skeletal Radiol. 2005;34:95–102. - PubMed
    1. Hunter DJ, Lo GH, Gale D, Grainger AJ, Guermazi A, Conaghan PG. The reliability of a new scoring system for knee osteoarthritis MRI and the validity of bone marrow lesion assessment: BLOKS (Boston Leeds Osteoarthritis Knee Score) Ann Rheum Dis. 2008;67:206–211. - PubMed
    1. Hunter DJ, Guermazi A, Lo GH, Grainger AJ, Conaghan PG, Boudreau RM, et al. Evolution of semi-quantitative whole joint assessment of knee OA: MOAKS (MRI Osteoarthritis Knee Score) Osteoarthritis Cartilage. 2011;19:990–1002. - PMC - PubMed

Publication types