. 2015 Sep;15(2):365-75.
doi: 10.1016/j.scr.2015.08.002. Epub 2015 Aug 13.

Development of a scalable suspension culture for cardiac differentiation from human pluripotent stem cells

Affiliations

Development of a scalable suspension culture for cardiac differentiation from human pluripotent stem cells

Vincent C Chen et al. Stem Cell Res. 2015 Sep.

Abstract

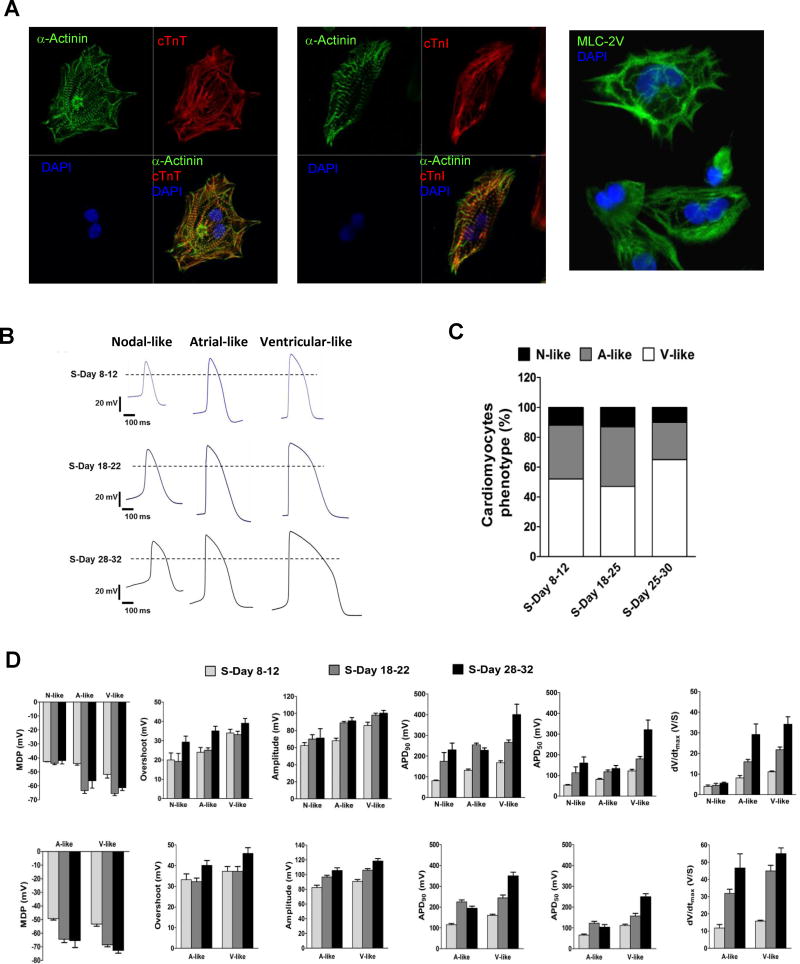
To meet the need of a large quantity of hPSC-derived cardiomyocytes (CM) for pre-clinical and clinical studies, a robust and scalable differentiation system for CM production is essential. With a human pluripotent stem cells (hPSC) aggregate suspension culture system we established previously, we developed a matrix-free, scalable, and GMP-compliant process for directing hPSC differentiation to CM in suspension culture by modulating Wnt pathways with small molecules. By optimizing critical process parameters including: cell aggregate size, small molecule concentrations, induction timing, and agitation rate, we were able to consistently differentiate hPSCs to >90% CM purity with an average yield of 1.5 to 2×10(9) CM/L at scales up to 1L spinner flasks. CM generated from the suspension culture displayed typical genetic, morphological, and electrophysiological cardiac cell characteristics. This suspension culture system allows seamless transition from hPSC expansion to CM differentiation in a continuous suspension culture. It not only provides a cost and labor effective scalable process for large scale CM production, but also provides a bioreactor prototype for automation of cell manufacturing, which will accelerate the advance of hPSC research towards therapeutic applications.

Keywords: Cardiomyocyte differentiation; GMP; Human pluripotent stem cells; Suspension cell cultures.


Figures

Figure 1
Figure 1
Analysis of H7 cell aggregates generated from suspension culture. (a) H7 cell expansion in suspension culture was calculated for 10 passages. (b) H7 cells formed different aggregate sizes in day 1, 2, and 3 suspension cultures. Scale bar, 200 μm. (c) Cell aggregates from the day 1, 2, and 3 suspension cultures were evaluated for their sizes. Aggregate sizes were analyzed by taking pictures of cell aggregates from culture aliquots and measuring aggregate sizes from the pictures using ImagePro software. The plot shows the distribution of aggregate sizes. n=3 independent experiments. Error bars, s.e.m. (d) Average size of day 1, 2, and 3 cell aggregates were calculated. n=3 independent experiments. Cells from dissociated aggregates were analyzed by flow cytometry for pluripotency markers, Tra-1-60, SSEA-4, and Oct-4.
Figure 2
Figure 2
Titration of CHIR and IWP-4 for different aggregate size ranges of H7 suspension cultures seeded in 6-well plates for cardiac differentiation. (a,b) H7 cell aggregates with different size ranges from day 1, 2, and 3 suspension cultures, as indicated, in 125mL spinner flask were plated in static suspension in low-attachment 6-well plates for cardiac differentiation. CHIR concentrations of 0, 6, 12, 18, and 24 μM were added for 24 hr to induce differentiation. ROR2+ and PDGFRα+ cell populations were measured by flow cytometry 2 days post CHIR induction. One representative result is shown in (a). Results of three independent experiments are shown in (b), Error bars, s.e.m. (c) With 2 days of IWP-4 induction on differentiation day 3–5, population sizes of cTnT+ cells were analyzed by flow cytometry on day 18 of differentiation. n=3 independent experiments, Error bars, s.e.m. (d) IWP-4 at concentrations 0, 1, 5, and 15 μM were added on day 3–5 after induction of 12 and 18 μM CHIR on cell aggregates with size range of day 2 suspension culture. Percentage of cTnT+ cells was analyzed by flow cytometry on day 18 of differentiation. n=3 independent experiments, Error bars, s.e.m.
Figure 3
Figure 3
Optimization of stirring rate for cardiac differentiation in 125mL spinner flasks. Undifferentiated H7 cell aggregates of day 2 suspension cultures were induced for cardiac differentiation in 125 mL spinner flasks with stirring rates of 35, 45, and 55 rpm. IWP-4 addition on day 2 (D2-IWP) and day 3 (D3-IWP) were compared in this setup. (a,b) The population sizes of ROR2+ and PDGFRα+ cells were measured by flow cytometry on day 2, 3, and 4 of differentiation. The results for IWP addition on day 2 is shown in (a) and addition on day 3 is shown in (b). n=3 independent experiments, Error bars, s.e.m. (c,d) Percentage of cTnT+ cells was measured by flow cytometry on day 8 (c) and 18 (d) to compare cardiac differentiation efficiency. n=3 independent experiments, Error bars, s.e.m. (e) Sizes of EBs formed in different agitation rates were compared on day 18 of differentiation.
Figure 4
Figure 4
Titration of CHIR and IWP-4 induction timing for cardiac differentiation in spinner flasks. CHIR concentrations of 6, 12, and 18 μM, with IWP-4 addition on day 2 (D2-IWP) or day 3 (D3-IWP) were compared for their cardiac induction efficiency in stirred suspension cultures using 125mL spinner flasks. (a) The population sizes of ROR2+ and PDGFRα+ cells were analyzed by flow cytometry on day 2 and 3 of differentiation to compare induction efficiency. The result of day 3 differentiation with IWP-4 addition on day 2 is labeled as Day 3/D2-IWP. n=3–5 experiments, Error bars, s.e.m. (b) Percentage of cTnT+ cells on day 18 was measured to evaluate cardiac differentiation. CHIR concentrations and IWP-4 addition timing are indicated in the figures. n=3–4 independent experiments, Error bars, s.e.m. (c) Population sizes of cTnT+ cells were compared on day 8 (D8) and 18 (D18) for cardiac differentiation performed in parallel in 1L and 125mL spinner flasks and 6-well plates with optimal induction conditions of 1L spinner flask culture, which was induced with 18 μM CHIR. The culture vessel and day of analysis are indicated. n=3 independent experiments, Error bars, s.e.m. (d) Cardiac differentiation efficiencies of H7, ESI-017, and the iPSC lines in 125 mL spinner flask cultures induced by 6 and 12 μM CHIR were compared by measuring cTnT+ cell population. CHIR concentrations and cell lines are indicated. n=2–4 independent experiments, Error bars, s.e.m.
Figure 5
Figure 5
Kinetics of cardiac differentiation in suspension culture. Samples from different time points were collected from the cardiac differentiation suspension culture. (a) Derivation of ROR2+ and PDGFRα+ cells was monitored by flow cytometry from day 0 to 5. (b) Percentages of CD90+ and cTnT+ cell populations were measured from day 6 to 25. n=3 independent experiments, Error bars, s.e.m. (c) Marker gene expression for pluripotency, mesoderm, cardiac mesoderm, cardiac progenitor, CM, and selected non-cardiac cells were analyzed by RNA-sequencing of samples from day 0 to 25. Gene expression levels (y-axis) were shown as RPKM (Reads Per Kilobase of transcript per Million mapped reads).
Figure 5
Figure 5
Kinetics of cardiac differentiation in suspension culture. Samples from different time points were collected from the cardiac differentiation suspension culture. (a) Derivation of ROR2+ and PDGFRα+ cells was monitored by flow cytometry from day 0 to 5. (b) Percentages of CD90+ and cTnT+ cell populations were measured from day 6 to 25. n=3 independent experiments, Error bars, s.e.m. (c) Marker gene expression for pluripotency, mesoderm, cardiac mesoderm, cardiac progenitor, CM, and selected non-cardiac cells were analyzed by RNA-sequencing of samples from day 0 to 25. Gene expression levels (y-axis) were shown as RPKM (Reads Per Kilobase of transcript per Million mapped reads).
Figure 6
Figure 6
Characterization of CM differentiated in suspension culture. (a) Cells differentiated in suspension culture were plated in adherent culture and stained with α-actinin, cTnT, cTnI, and MLC-2v antibodies, and DAPI. The immunofluorescent staining was acquired by confocal imaging. (b–d) Electrophysiological characterization of hESC-cardiomyocytes (hESC-CM) differentiated in suspension culture. (b) Representative action potential (AP) recordings using whole cell patch clamp of three cardiomyocyte subtypes produced at days 8–12, days 18–22, and days 28–32 of differentiation. Cells exhibit AP morphologies that can be categorized as atrial-, nodal-, or ventricular-like. (c) Subtype distribution of cardiomyocyte at days 8–12, n = 25, days 18–22, n = 30, and days 28–32, n = 20. (d) Patch clamp recordings of either spontaneously beating (top row) or paced (bottom row) hESC-CM at different time points differentiated in suspension culture, demonstrating MDP, maximum diastolic potential; peak voltage; APA, action potential amplitude; AP duration at different levels of repolarization (i.e., 90 or 50%); and dV/dtmax (maximal rate of depolarization).

References

    1. Arnold SJ, Robertson EJ. Making a commitment: cell lineage allocation and axis patterning in the early mouse embryo. Nature reviews Molecular cell biology. 2009;10:91–103. - PubMed
    1. Buckingham M, Meilhac S, Zaffran S. Building the mammalian heart from two sources of myocardial cells. Nature reviews Genetics. 2005;6:826–835. - PubMed
    1. Tam PP, Loebel DA. Gene function in mouse embryogenesis: get set for gastrulation. Nature reviews Genetics. 2007;8:368–381. - PubMed
    1. David R, et al. MesP1 drives vertebrate cardiovascular differentiation through Dkk-1-mediated blockade of Wnt-signalling. Nature cell biology. 2008;10:338–345. - PubMed
    1. Naito AT, et al. Developmental stage-specific biphasic roles of Wnt/beta-catenin signaling in cardiomyogenesis and hematopoiesis. Proceedings of the National Academy of Sciences of the United States of America. 2006;103:19812–19817. - PMC - PubMed

Publication types