. 2015 Dec:71:58-70.
doi: 10.1016/j.biomaterials.2015.08.030. Epub 2015 Aug 20.

Biological and MRI characterization of biomimetic ECM scaffolds for cartilage tissue regeneration

Affiliations

Biological and MRI characterization of biomimetic ECM scaffolds for cartilage tissue regeneration

Sriram Ravindran et al. Biomaterials. 2015 Dec.

Abstract

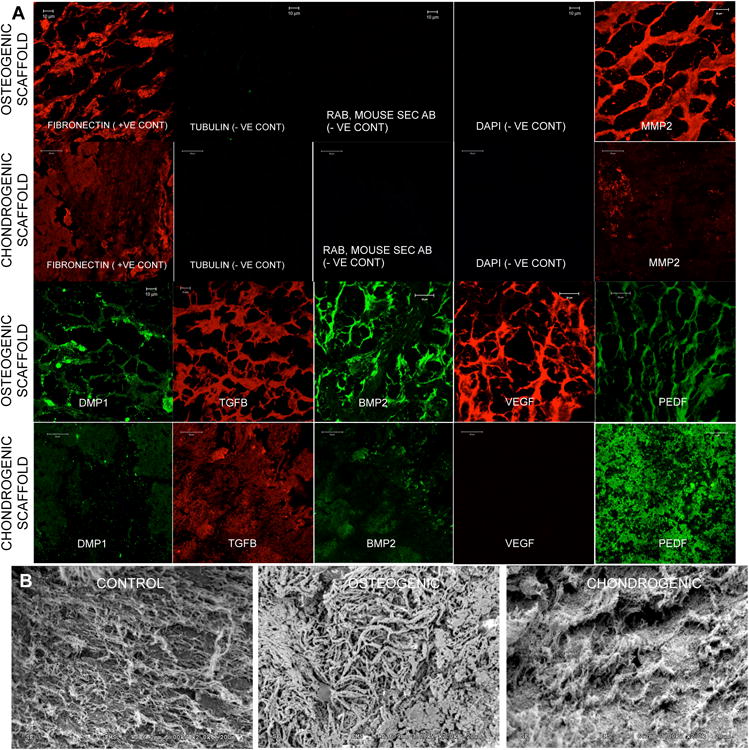
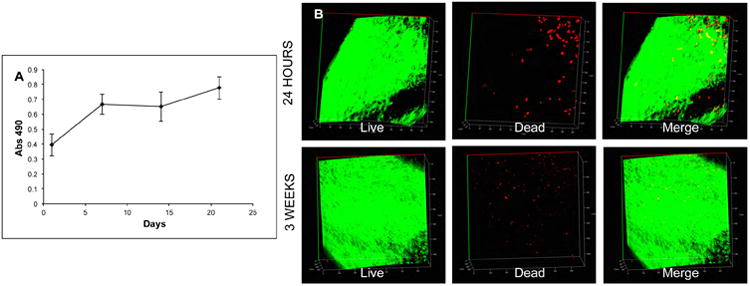
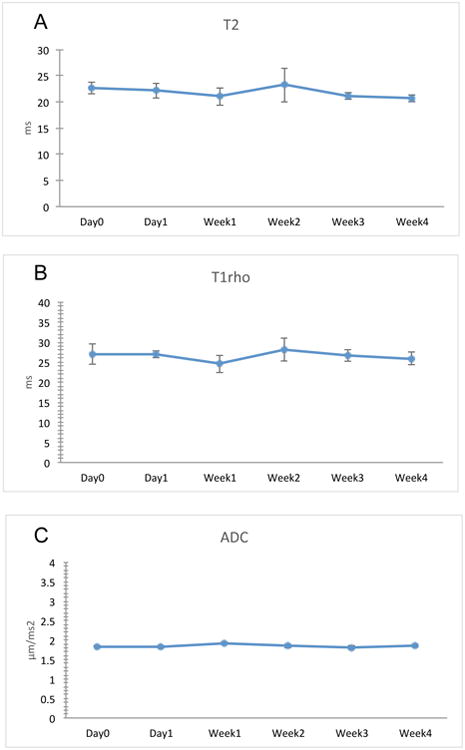
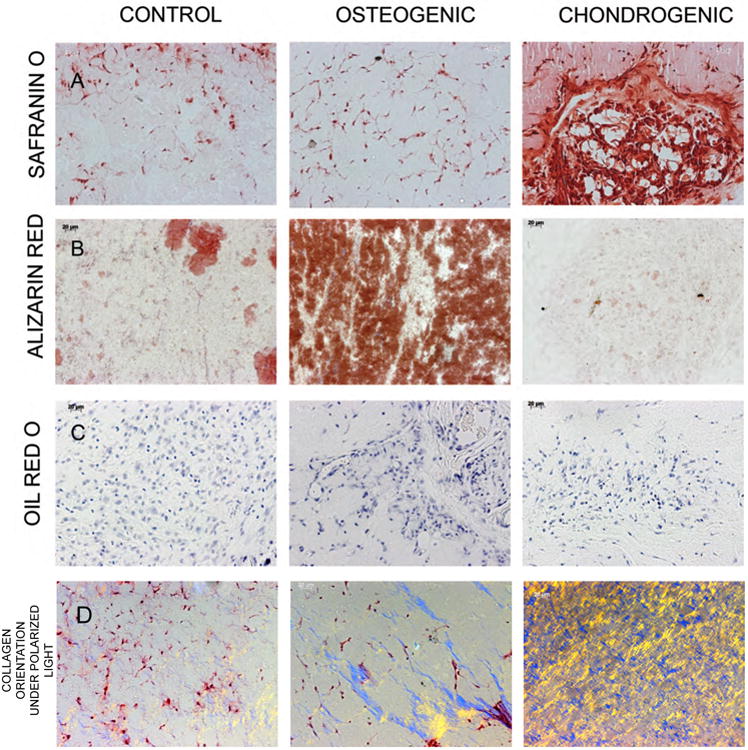
Osteoarthritis is the most common joint disorder affecting millions of people. Most scaffolds developed for cartilage regeneration fail due to vascularization and matrix mineralization. In this study we present a chondrogenic extracellular matrix (ECM) incorporated collagen/chitosan scaffold (chondrogenic ECM scaffold) for potential use in cartilage regenerative therapy. Biochemical characterization showed that these scaffolds possess key pro-chondrogenic ECM components and growth factors. MRI characterization showed that the scaffolds possess mechanical properties and diffusion characteristics important for cartilage tissue regeneration. In vivo implantation of the chondrogenic ECM scaffolds with bone marrow derived mesenchymal stem cells (MSCs) triggered chondrogenic differentiation of the MSCs without the need for external stimulus. Finally, results from in vivo MRI experiments indicate that the chondrogenic ECM scaffolds are stable and possess MR properties on par with native cartilage. Based on our results, we envision that such ECM incorporated scaffolds have great potential in cartilage regenerative therapy. Additionally, our validation of MR parameters with histology and biochemical analysis indicates the ability of MRI techniques to track the progress of our ECM scaffolds non-invasively in vivo; highlighting the translatory potential of this technology.

Keywords: Biomimetic scaffold; Cartilage tissue engineering; Extracellular matrix scaffold and MRI of tissue-engineered cartilage; MSC differentiation.


Figures

Figure 1
Figure 1. Characterization of osteogenic and chondrogenic ECM scaffolds
(A) Images are representative confocal micrographs showing expression of different ECM proteins in the osteogenic and chondrogenic ECM scaffolds. Fibronectin was used as a positive control and tubulin was used as a negative control for intracellular proteins. DAPI staining was performed to ensure absence of residual DNA from the cells. Note the difference in expression of different ECM proteins. (B) SEM images of control, osteogenic and chondrogenic ECM scaffolds. Note the difference in morphology of the 3 scaffolds.
Figure 2
Figure 2. MRI characterization of osteogenic and chondrogenic ECM scaffolds
Images are MRI heat maps of T2 and ADC (apparent diffusion coefficient of water) of control, osteogenic and chondrogenic ECM scaffolds. The table below shows the quantitation of the MRI data.
Figure 3
Figure 3. Proliferation of HMSCs in the chondrogenic ECM scaffolds
(A) A graphical representation of the proliferation of HMSCs in the chondrogenic ECM scaffolds over 3 weeks of culture in vitro. Note the initial burst in proliferation at week1 followed by slower rate of proliferation up to 3 weeks. (B) Live/Dead cell assay of HMSCs in the chondrogenic ECM scaffolds 24 hours post seeding and after 3 weeks of culture in vitro.
Figure 4
Figure 4. MRI evaluation of chondrogenic ECM scaffolds with HMSCs over time
The graphs show quantitation of MRI data representing changes in T2 (A), T1rho (B) and ADC (C) over a period of 4 weeks. Data are represented a mean +/- SD (n=3). Student's t-test was used to assess the statistical difference between the data obtained from different time points to the data obtained at day 0. No statistically significant change could be observed for all parameters.
Figure 5
Figure 5. Macroscopic evaluation and H&E staining of scaffold explants
(A) The figure shows representative control, osteogenic and chondrogenic scaffolds after extraction from their subcutaneous pockets. Black arrows in the image point to blood vessels that can be seen using the naked eye. Note the absence of visible blood vessels in the chondrogenic ECM scaffolds. Scale bar represents 2mm. Images are representative micrographs of H&E stained control (B), osteogenic (C) and chondrogenic (D) scaffold explants. The fluorescence micrographs represent auto fluorescence from the sections in the red channel to observe RBC auto fluorescence. White arrows in the images show positive identification of RBCs. Note the absence of RBCs in the chondrogenic scaffolds. Scale bar represents 2μm in all images. The diffused background red fluorescence observed in the images is auto fluorescence from chitosan.
Figure 6
Figure 6. Histological evaluation of osteogenic and chondrogenic differentiation in vivo
Images are representative micrographs of safranin O (A), alizarin red (B) and oil red O (C) stains of control, osteogenic and chondrogenic ECM scaffolds. The sections for oil red O stains were counter stained with hematoxylin. Note positive alizarin red staining for calcium in the osteogenic scaffolds and the positive safranin O proteoglycan staining in the chondrogenic scaffolds. (D) Images were obtained by polarized light microscopy to observe collagen orientation. Distinct differences in collagen fibril arrangement were observed in the three scaffolds.
Figure 7
Figure 7. Fluorescence IHC of scaffold explants
Images are representative confocal micrographs of control, osteogenic and chondrogenic scaffold explants immunostained for osteogenic marker proteins. Note the absence of positive staining in the chondrogenic scaffold explant sections showing absence of osteogenic differentiation of HMSCs in vivo.
Figure 8
Figure 8. Live animal MRI of chondrogenic scaffolds
(A) Shows a representative mouse carrying chondrogenic ECM scaffold alone on the left and chondrogenic ECM scaffold containing HMSCs on the right. The MRI image below shows the presence of both scaffolds in the subcutaneous pocket (2 scaffolds were implanted in each mouse). Graphs B and C show quantitative T2 and T1rho measurements of the implants (n=4 for each group) in the animals measured at different time points up to 8 weeks. The red and blue asterisks represent statistically significant differences between the chondrogenic ECM scaffolds alone and chondrogenic ECM scaffolds containing HMSCs as measured by student's t-test at the different time points with respect to each other. No significant differences were seen within each of the groups at all time points with respect to week 1. The graph in C represents the change in T2 relaxation times of the chondrogenic ECM scaffolds containing HMSCs and control (collagen/chitosan scaffold) scaffolds containing HMSCs after removal of the scaffold T2 relaxation time contribution. * Represents a statistically significant difference (p< 0.01) between the control group and the chondrogenic ECM scaffold group at the specific time point as measured by student's t-test. Note the significant difference between the ECM production within the chondrogenic scaffolds and the control scaffolds over 4 weeks. (E, E1, F, F1, G, G1 and H, H1) Representative images of 8-week explant sections of control (E, F, G and H) and chondrogenic ECM scaffolds (E1, F1, G1, H1) containing HMSCs stained using safranin O (E, E1), alizarin red (F, F1) histological stains and immunostained for aggrecan (G, G1) and Type II collagen (H, H1)

References

    1. Mow VC, Ratcliffe A, Poole AR. Cartilage and diarthrodial joints as paradigms for hierarchical materials and structures. Biomaterials. 1992;13:67–97. - PubMed
    1. George A, Ravindran S. Protein Templates in Hard Tissue Engineering. Nano Today. 2010;5:254–66. - PMC - PubMed
    1. Hwang NS, Varghese S, Li H, Elisseeff J. Regulation of osteogenic and chondrogenic differentiation of mesenchymal stem cells in PEG-ECM hydrogels. Cell Tissue Res. 2011;344:499–509. - PubMed
    1. Solchaga LA, Penick KJ, Welter JF. Chondrogenic differentiation of bone marrow-derived mesenchymal stem cells: tips and tricks. Methods Mol Biol. 2011;698:253–78. - PMC - PubMed
    1. Singh P, Schwarzbauer JE. Fibronectin and stem cell differentiation - lessons from chondrogenesis. J Cell Sci. 2012;125:3703–12. - PMC - PubMed

Publication types