. 2015 Oct;37(5):91.
doi: 10.1007/s11357-015-9833-6. Epub 2015 Aug 29.

Brain oxygenation responses to an autonomic challenge: a quantitative fMRI investigation of the Valsalva manoeuvre

Affiliations

Brain oxygenation responses to an autonomic challenge: a quantitative fMRI investigation of the Valsalva manoeuvre

Iwo Bohr et al. Age (Dordr). 2015 Oct.

Abstract

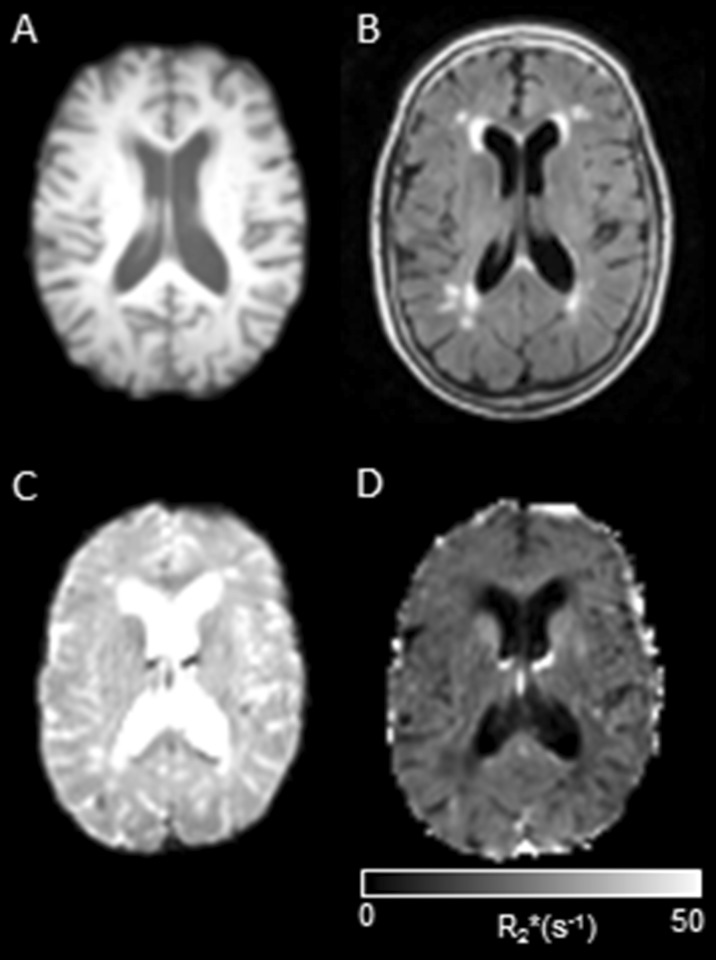
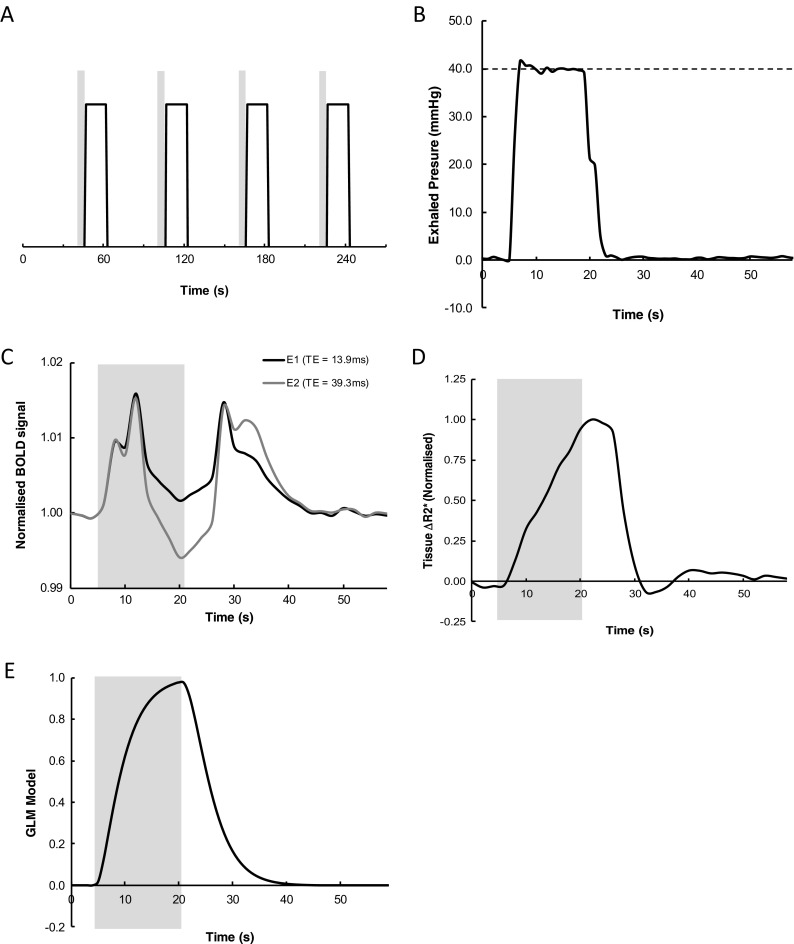
In late age, the autonomic nervous system (ANS) has diminished ability to maintain physiological homeostasis in the brain in response to challenges such as to systemic blood pressure changes caused by standing. We devised an fMRI experiment aiming to map the cerebral effects of an ANS challenge (Valsalva manoeuvre (VM)). We used dual-echo fMRI to measure the effective transverse relaxation rate (R2*, which is inversely proportional to brain tissue oxygenation levels) in 45 elderly subjects (median age 80 years old, total range 75-89) during performance of the VM. In addition, we collected fluid-attenuated inversion recovery (FLAIR) data from which we quantified white matter hyperintensity (WMH) volumes. We conducted voxelwise analysis of the dynamic changes in R2* during the VM to determine the distribution of oxygenation changes due to the autonomic stressor. In white matter, we observed significant decreases in oxygenation levels. These effects were predominantly located in posterior white matter and to a lesser degree in the right anterior brain, both concentrated around the border zones (watersheds) between cerebral perfusion territories. These areas are known to be particularly vulnerable to hypoxia and are prone to formation of white matter hyperintensities. Although we observed overlap between localisation of WMH and triggered deoxygenation on the group level, we did not find significant association between these independent variables using subjectwise statistics. This could suggest other than recurrent transient hypoxia mechanisms causing/contributing to the formation of WMH.


Figures

Fig. 1
Fig. 1
Examples of four modalities of images used in the study from the same subject (middle axial slice); a T1 weighted, b FLAIR (note the presence of WMH, especially around the horns of the lateral ventricles); c fMRI; echo 2; d R2*
Fig. 2
Fig. 2
a Diagram illustrating the timing of Valsalva manoeuvre (VM) performance within the fMRI time series acquisition. Gray bars indicate the 5-s period during which subjects were instructed to prepare to perform the VM, while the solid line indicates the timing of each of the 16 s periods of VM. b Representative pressure trace of exhaled air during one of the VM periods. The dashed horizontal line depicts required level of pressure. c Group-averaged (n = 45) time series of the BOLD signal change for the two echo times averaged across the four VM periods. Black line, echo 1; gray line, echo 2. The gray box indicates the period of the VM. d Time series of the mean normalized R2* signal (n = 45) extracted from the whole brain (WM + GM, but excluding CSF). e Time course of models of response for ‘strain’ during the VM
Fig. 3
Fig. 3
a Group deoxygenation maps overlaid on study-specific template registered to the MNI space for contrast between ‘strain’ phase and baseline showing highly significant areas of tissue deoxygenation confined to posterior and left anterior white matter. Numbers beneath each slice denote z coordinates (mm). b Deoxygenation map (z = 16) overlaid on outlines of ideal major arterial territories. ACA anterior cerebral artery perfusion territory, MCA middle cerebral artery perfusion territory, PCA posterior cerebral artery perfusion territory; note a strong overlap of deoxygenation maps and watersheds between arterial territories. c Slices presenting theoretical outlines of perfusion territories—green, ACA; red, MCA; and blue, PCA (z-coordinates as on b). Note radiological orientation. Note radiological orientation (colour figure online)

Similar articles

Cited by

References

    1. Ashburner J, Friston KJ (2005) Unified segmentation NeuroImage 26:839–851. doi:10.1016/j.neuroimage.2005.02.018 - PubMed
    1. Caine D, Watson JD. Neuropsychological and neuropathological sequelae of cerebral anoxia: a critical review. J Int Neuropsychological Soc: JINS. 2000;6:86–99. doi: 10.1017/S1355617700611116. - DOI - PubMed
    1. Dawson SL, Panerai RB, Potter JF. Critical closing pressure explains cerebral hemodynamics during the Valsalva maneuver. J Appl Physiol. 1999;86:675–680. - PubMed
    1. Debette S, Markus HS. The clinical importance of white matter hyperintensities on brain magnetic resonance imaging: systematic review and meta-analysis. BMJ. 2010;341:c3666. doi: 10.1136/bmj.c3666. - DOI - PMC - PubMed
    1. Feihl F, Liaudet L, Levy BI, Waeber B. Hypertension and microvascular remodelling. Cardiovasc Res. 2008;78:274–285. doi: 10.1093/cvr/cvn022. - DOI - PubMed

Publication types

LinkOut - more resources