

Comparison of subset selection methods in linear regression in the context of health-related quality of life and substance abuse in Russia
- PMID: 26319135
- PMCID: PMC4553217
- DOI: 10.1186/s12874-015-0066-2
Comparison of subset selection methods in linear regression in the context of health-related quality of life and substance abuse in Russia
Abstract
Background: Automatic stepwise subset selection methods in linear regression often perform poorly, both in terms of variable selection and estimation of coefficients and standard errors, especially when number of independent variables is large and multicollinearity is present. Yet, stepwise algorithms remain the dominant method in medical and epidemiological research.
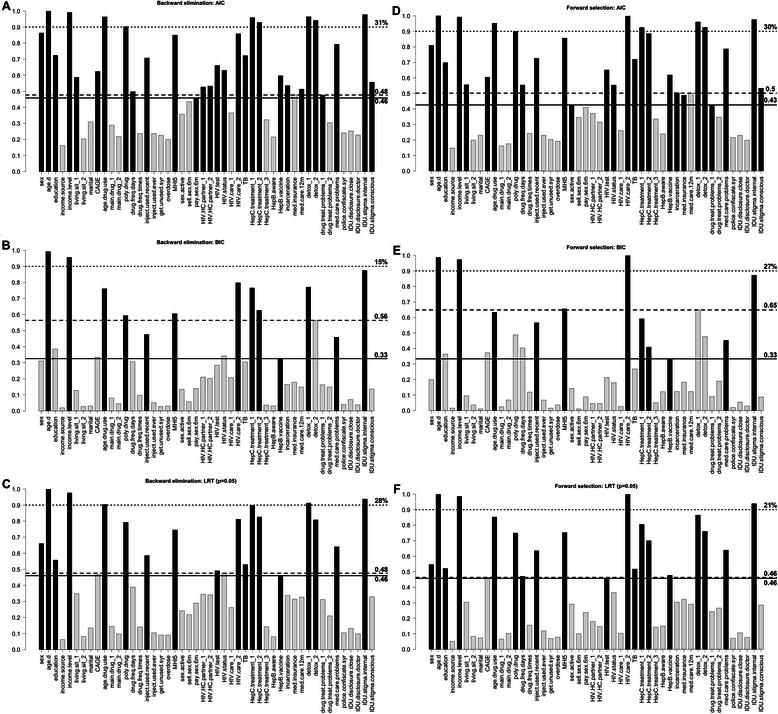
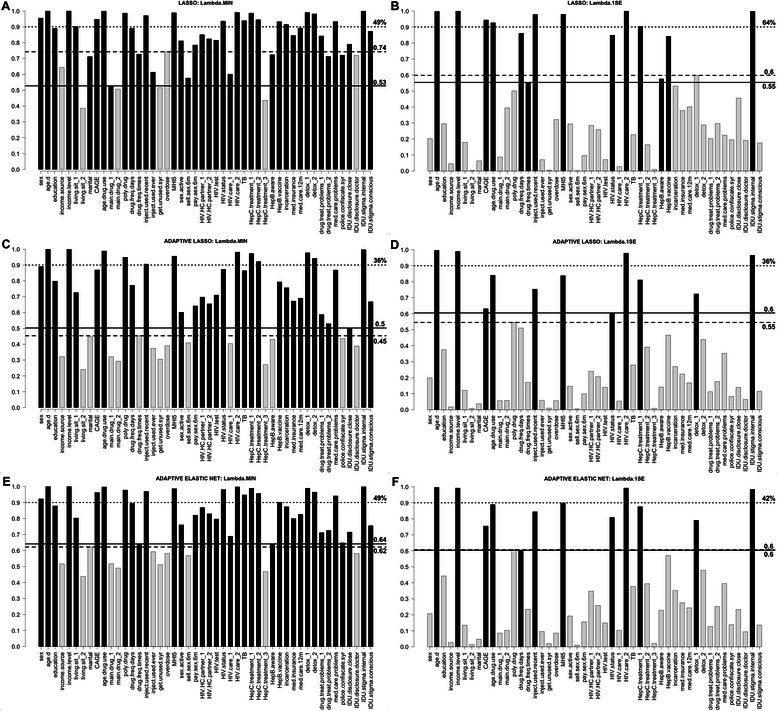
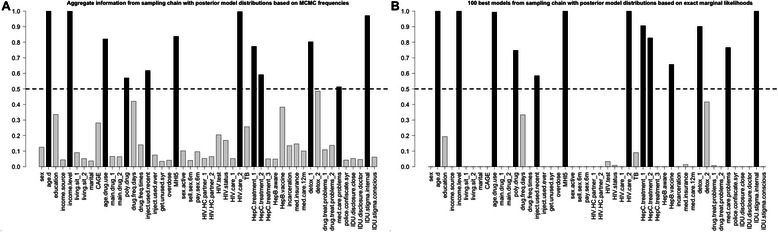
Methods: Performance of stepwise (backward elimination and forward selection algorithms using AIC, BIC, and Likelihood Ratio Test, p = 0.05 (LRT)) and alternative subset selection methods in linear regression, including Bayesian model averaging (BMA) and penalized regression (lasso, adaptive lasso, and adaptive elastic net) was investigated in a dataset from a cross-sectional study of drug users in St. Petersburg, Russia in 2012-2013. Dependent variable measured health-related quality of life, and independent correlates included 44 variables measuring demographics, behavioral, and structural factors.
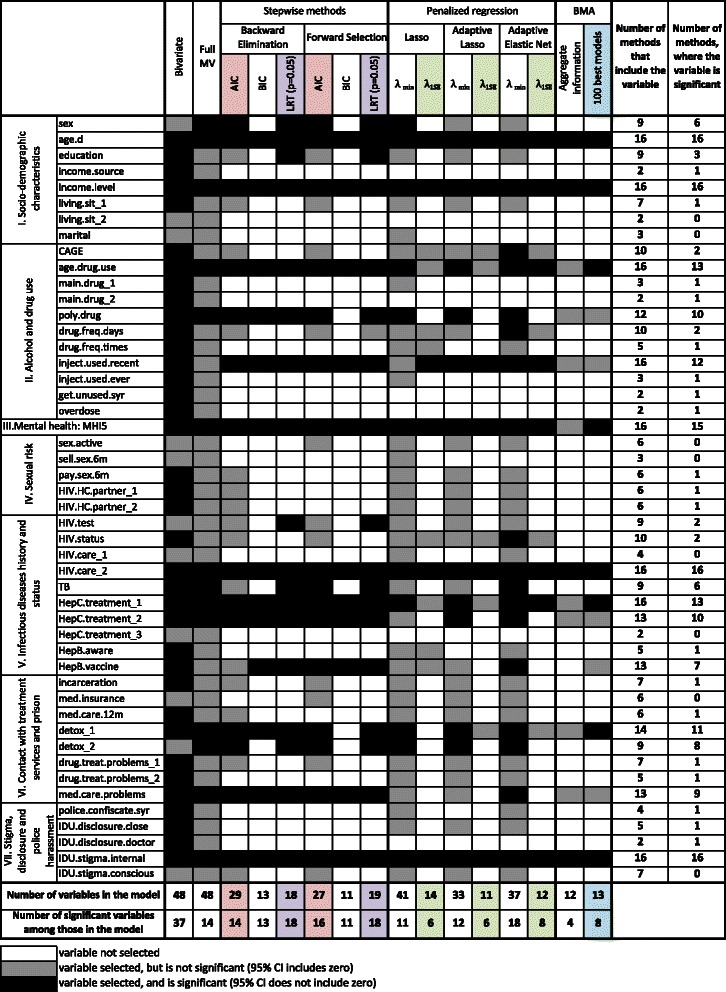
Results: In our case study all methods returned models of different size and composition varying from 41 to 11 variables. The percentage of significant variables among those selected in final model varied from 100 % to 27 %. Model selection with stepwise methods was highly unstable, with most (and all in case of backward elimination: BIC, forward selection: BIC, and backward elimination: LRT) of the selected variables being significant (95 % confidence interval for coefficient did not include zero). Adaptive elastic net demonstrated improved stability and more conservative estimates of coefficients and standard errors compared to stepwise. By incorporating model uncertainty into subset selection and estimation of coefficients and their standard deviations, BMA returned a parsimonious model with the most conservative results in terms of covariates significance.
Conclusions: BMA and adaptive elastic net performed best in our analysis. Based on our results and previous theoretical studies the use of stepwise methods in medical and epidemiological research may be outperformed by alternative methods in cases such as ours. In situations of high uncertainty it is beneficial to apply different methodologically sound subset selection methods, and explore where their outputs do and do not agree. We recommend that researchers, at a minimum, should explore model uncertainty and stability as part of their analyses, and report these details in epidemiological papers.
Figures
References
-
- George EI. The Variable Selection Problem. J Am Stat Assoc. 2000;95(452):1304–1308. doi: 10.1080/01621459.2000.10474336. - DOI
-
- Rothman KJ, Greenland S, Lash TL. Modern Epidemiology. Philadelphia: Wolters Kluwer Health/Lippincott Williams & Wilkins; 2008.
-
- Miller A. Subset Selection in Regression. Boca Raton: Taylor & Francis; 2002.
-
- Burnham KP, Anderson DR. Model Selection and Multimodel Inference: A Practical Information-Theoretic Approach. New York: Springer; 2002.
Publication types
MeSH terms
Grants and funding
LinkOut - more resources
Full Text Sources
Other Literature Sources
Medical
