. 2015 Dec 1;369(1):175-83.
doi: 10.1016/j.canlet.2015.08.012. Epub 2015 Aug 28.

Suppression of the GTPase-activating protein RGS10 increases Rheb-GTP and mTOR signaling in ovarian cancer cells

Affiliations

Suppression of the GTPase-activating protein RGS10 increases Rheb-GTP and mTOR signaling in ovarian cancer cells

Molly K Altman et al. Cancer Lett. .

Abstract

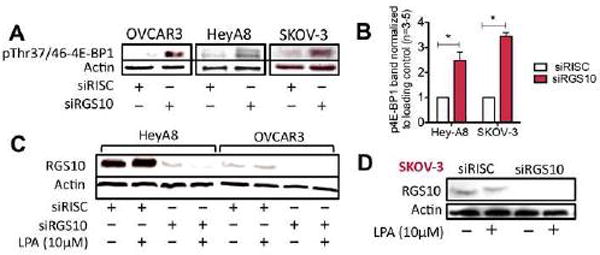
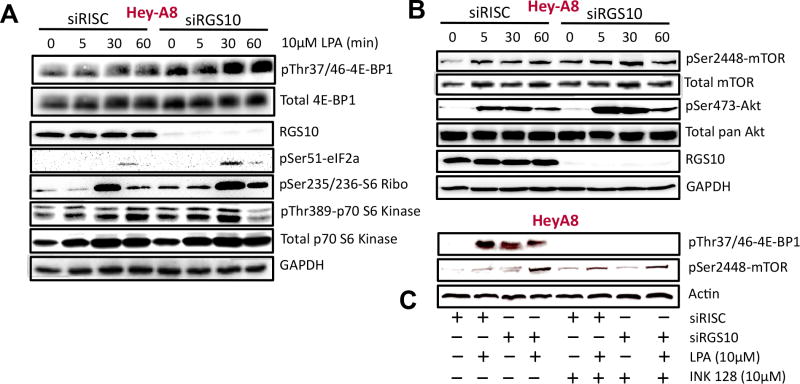
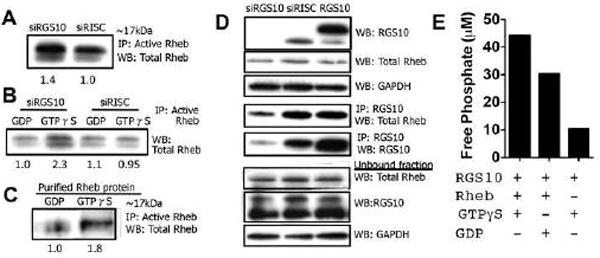
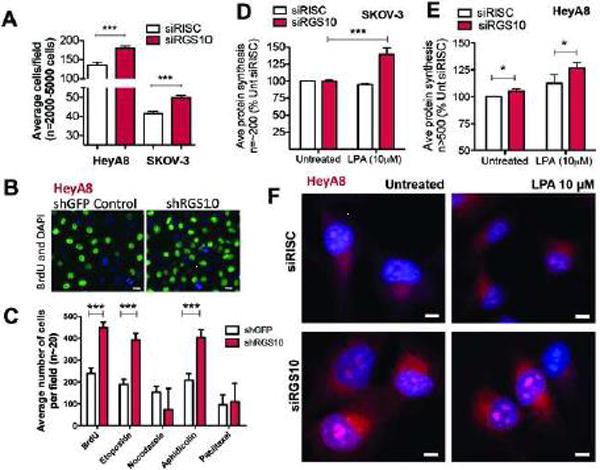
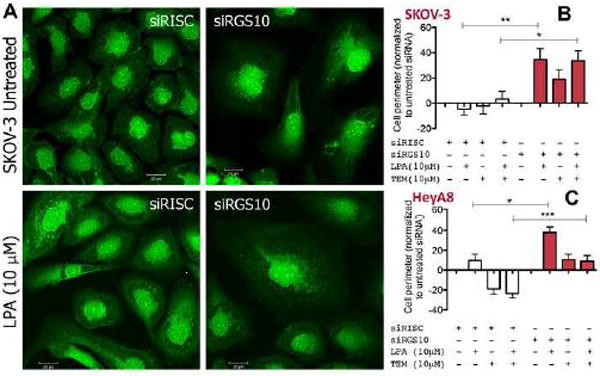
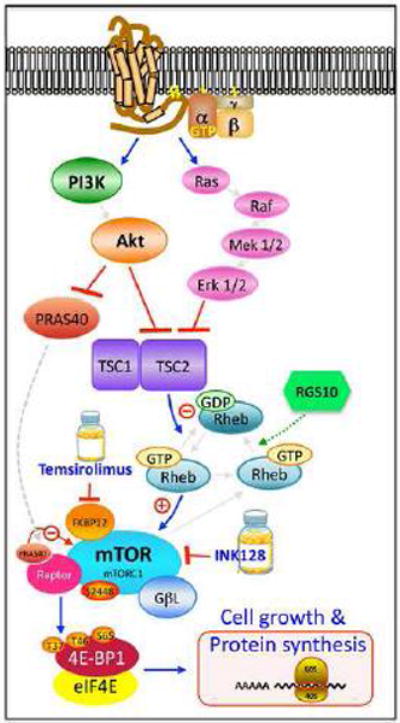
The regulator of G protein signaling 10 (RGS10) protein is a GTPase activating protein that accelerates the hydrolysis of GTP and therefore canonically inactivates G proteins, ultimately terminating signaling. Rheb is a small GTPase protein that shuttles between its GDP- and GTP-bound forms to activate mTOR. Since RGS10 suppression augments ovarian cancer cell viability, we sought to elucidate the molecular mechanism. Following RGS10 suppression in serum-free conditions, phosphorylation of mTOR, the eukaryotic translation initiation factor 4E binding protein 1 (4E-BP1), p70S6K and S6 Ribosomal Protein appear. Furthermore, suppressing RGS10 increases activated Rheb, suggesting RGS10 antagonizes mTOR signaling via the small G-protein. The effects of RGS10 suppression are enhanced after stimulating cells with the growth factor, lysophosphatidic acid, and reduced with mTOR inhibitors, temsirolimus and INK-128. Suppression of RGS10 leads to an increase in cell proliferation, even in the presence of etoposide. In summary, the RGS10 suppression increases Rheb-GTP and mTOR signaling in ovarian cancer cells. Our results suggest that RGS10 could serve in a novel, and previously unknown, role by accelerating the hydrolysis of GTP from Rheb in ovarian cancer cells.

Keywords: 4E-BP1; Lysophosphatidic acid; Regulator of G protein Signaling 10 protein (RGS10); Rheb; mTOR.


Conflict of interest statement

The authors declare no conflicts of interest

Figures

Figure 1
Figure 1. RGS10 suppression induces the phosphorylation of 4E-BP1 in ovarian cancer cells under low nutrient conditions
(A) OVCAR-3, HeyA8 and SKOV-3 cells were transfected with the siGENOME RISC-Free control siRNA (siRISC) or siRGS10 and kept in serum-free medium prior to immunoblotting detection for phospho-4E-BP1 at Thr37/46 and actin. (B) Repeated experiments (n=3–5) of phospho-4E-BP1 in HeyA8 and SKOV-3 cells were quantified using ImageJ. A significant increase in the phosphorylation among siRGS10 cells (*p<0.05 vs siRISC) is observed. (C) HeyA8, OVCAR-3 or (D) SKOV-3 cells were processed for detection of RGS10 protein expression and actin.
Figure 2
Figure 2. Lysophosphatidic acid activates the mTOR signaling pathway, enhancing the effects of RGS10 suppression-induced phosphorylation changes
(A and B) Hey-A8 cells transfected with siRISC or siRGS10 were treated with 10 μM of lysophosphatidic acid (LPA) for 0, 5, 30 or 60 min prior to immunoblotting of total and phospho-4E-BP1(Thr37/46), RGS10, phospho-eIF2a(Ser51), phospho-S6 ribosomal (S6 Ribo) protein(Ser235/236), total and phospho-p70S6K(Thr389), total and phospho-mTOR(Ser2448), total and phospho-Akt(Ser473), or GAPDH. (C) Hey-A8 cells were transfected with siRISC or siRGS10 and treated with LPA (10 μM, 30 min) or pre-treated with INK-128 (10 μM, 18 h) prior to immunoblotting analysis for phospho-4E-BP1(Thr37/46), phospho-mTOR(Ser2448) or actin.
Figure 3
Figure 3. Evaluation of the GAP activity of RGS10
(A) SKOV-3 cells were transfected with either siRISC or siRGS10 prior to immunoprecipitation with an active Rheb monoclonal antibody and immunoblotting with total Rheb rabbit polyclonal antibody. (B) In a separate experiment, cells were treated as indicated above, but GTPγS and GDP were added to the cell extracts in vitro and incubated for 30 min prior to the pull-down of active Rheb and blot for total Rheb (for details see Methods). (C) In the reciprocal experiment, purified, full-length Rheb protein was incubated with GTPγS or GDP prior to immunoprecipitation with active Rheb and immunoblot for total Rheb. (D) Cells were treated as previously described and also transiently transfected with an RGS10 expression vector prior to immunoprecipitation. Following transfection, cell extracts were probed for RGS10, total Rheb and Rheb. Other extracts were immunoprecipitated with anti-RGS10 goat polyclonal antibody and blotted with anti-total Rheb rabbit polyclonal antibody. Unbound fraction is also shown. (E) A non-radioactive method using a malachite green reagent kit was utilized to measure inorganic free phosphate in a cell-free, aqueous solution and assess the GAP activity of RGS10. Purified proteins RGS10 and Rheb were incubated in the presence of GTPγS or GDP, where indicated, for 120 min. When RGS10 induces the hydrolysis of GTP to GDP, free phosphate is released into the solution, which is detected by the formation of a green molybdophosphoric acid complex and measured in a 96-well plate using absorbance that is directly related to the free phosphate release (17).
Figure 4
Figure 4. RGS10 suppression enhances ovarian cancer cell proliferation and protein synthesis
(A) HeyA8 and SKOV-3 cells were transfected with either siRISC or siRGS10 and stained with DAPI. Cells were automatically counted using a high-throughput fluorescence imager and results are quantified as the average number of cells per field. The number of cells (n=2,000 – 5,000) observed among fields (n=15–100) across multiple experiments (n=3–6) were pooled together and displayed as a bar graph using GraphPad Prism. (B) Representative shGFP and shRGS10 HeyA8 cells were pulse-treated for one hour with a BrdU analog. Cells were fixed and then stained with DAPI and an anti-BrdU antibody prior to high-throughput imaging. The representative image shown here visualizes the fluorescence from HeyA8 cells and the difference between active proliferation among control cells and suppression of RGS10. (C) In other experiments, shGFP or shRGS10 stably-expressing HeyA8 cells were treated with different drugs or a BrdU analog prior to fixation, immunofluorescence staining and automatic cell counting. The average number of cells per field is shown and represents ~20 fields and thousands of total cells. ***p<0.001. Approximately (D) 2000 SKOV-3 cells or (E) 3000 HeyA8 were plated in complete media prior to siRNA transfection. The Click-iT® Plus OPP Alexa Fluor® 647 Protein Synthesis Assay Kit was used to measure protein synthesis. Cells were treated with LPA (10μM) for 60 min or left utreated. Approximately 200 (SKOV-3) or >500 (HeyA8) total cells were automatically quantified for fluorescence intensity, which corresponds to protein synthesis, and the data is presented as bar graphs normalized to siRISC untreated conditions (100%). *p<0.05, ***p<0.001. (F) Representative images from the previous experiment to measure protein synthesis are shown in HeyA8 cells.
Figure 5
Figure 5. RGS10 suppression alters morphology in lysophosphatidic acid-stimulated ovarian cancer cells
(A) SKOV-3 cells plated on glass coverslips were transfected with either siRISC or siRGS10 and treated with lysophosphatidic acid (10μM) for 30 min prior to preparation for confocal microscopy using the Whole Cell Stain Solution (ThermoFisher Scientific). (B) SKOV-3 or (C) HeyA8 cells were transfected with either siRISC or siRGS10 prior to the automated computer assessment of cell perimeter. Cells were treated with lysophosphatidic acid (LPA, 10 μM, 30 min) or temsirolimus (10 μM, ~16 h) where indicated. Cells were prepared for immunofluorescence using the Whole Cell Stain Solution and automatically scanned with high-throughput software to calculate cell perimeter. Data shows the average from 62–146 different fields per condition, which measures thousands of cells, from a series of replicate experiments and is normalized to each untreated condition (i.e. siRISC-white bars or siRGS10-shaded bars). ***p<0.001, **p<0.01 and *p<0.05 where indicated.
Figure 6
Figure 6. Model integrating RGS10 into the mTOR signaling pathway
A G protein-coupled receptor initiates a signaling cascade upon activation at the cell surface. The signal is transmitted through the G proteins to initiate ERK/MAPK and PI3K/Akt/mTOR, in the case of growth factor signaling. Activation affects the inhibition of the TSC1/TSC2 complex, which regulates Rheb activation. Rheb-GTP relieves mTORC1 inhibition. Phosphorylated mTOR phosphorylates 4E-BP1, which regulates cell growth and nascent protein synthesis. We propose that RGS10 binds and accelerates the hydrolysis of GTP from Rheb, which is especially apparent under low nutrient conditions and minimized upon treatment with the lipid growth factor, lysophosphatidic acid. The data shown herein supports this since RGS10 suppression increases the amount of Rheb-GTP in agonist-free cell systems as well as increasing the phosphorylation of 4E-BP1 and mTOR. RGS10 is depicted in green with a dashed line.

References

    1. Hunt TW, Fields TA, Casey PJ, Peralta EG. RGS10 is a selective activator of G alpha i GTPase activity. Nature. 1996;383:175–177. - PubMed
    1. Siderovski DP, Willard FS. The GAPs, GEFs, and GDIs of heterotrimeric G-protein alpha subunits. Int J Biol Sci. 2005;1:51–66. - PMC - PubMed
    1. Sethakorn N, Yau DM, Dulin NO. Non-canonical functions of RGS proteins. Cell Signal. 2010;22:1274–1281. - PMC - PubMed
    1. Long X, Lin Y, Ortiz-Vega S, Yonezawa K, Avruch J. Rheb binds and regulates the mTOR kinase. Current biology: CB. 2005;15:702–713. - PubMed
    1. Efeyan A, Sabatini DM. mTOR and cancer: many loops in one pathway. Curr Opin Cell Biol. 2010;22:169–176. - PMC - PubMed

Publication types