. 2015 Oct;309(7):H1186-97.
doi: 10.1152/ajpheart.00283.2015. Epub 2015 Aug 28.

Macrophage depletion lowers blood pressure and restores sympathetic nerve α2-adrenergic receptor function in mesenteric arteries of DOCA-salt hypertensive rats

Affiliations

Macrophage depletion lowers blood pressure and restores sympathetic nerve α2-adrenergic receptor function in mesenteric arteries of DOCA-salt hypertensive rats

Loc V Thang et al. Am J Physiol Heart Circ Physiol. 2015 Oct.

Abstract

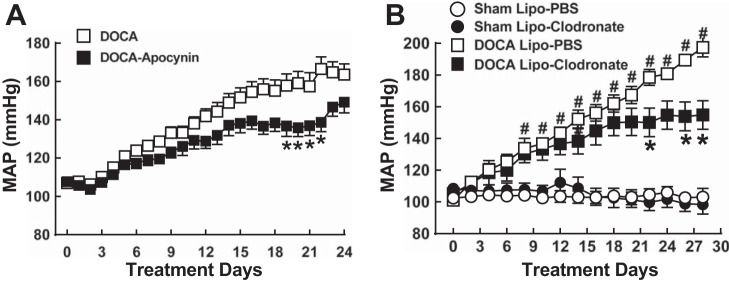
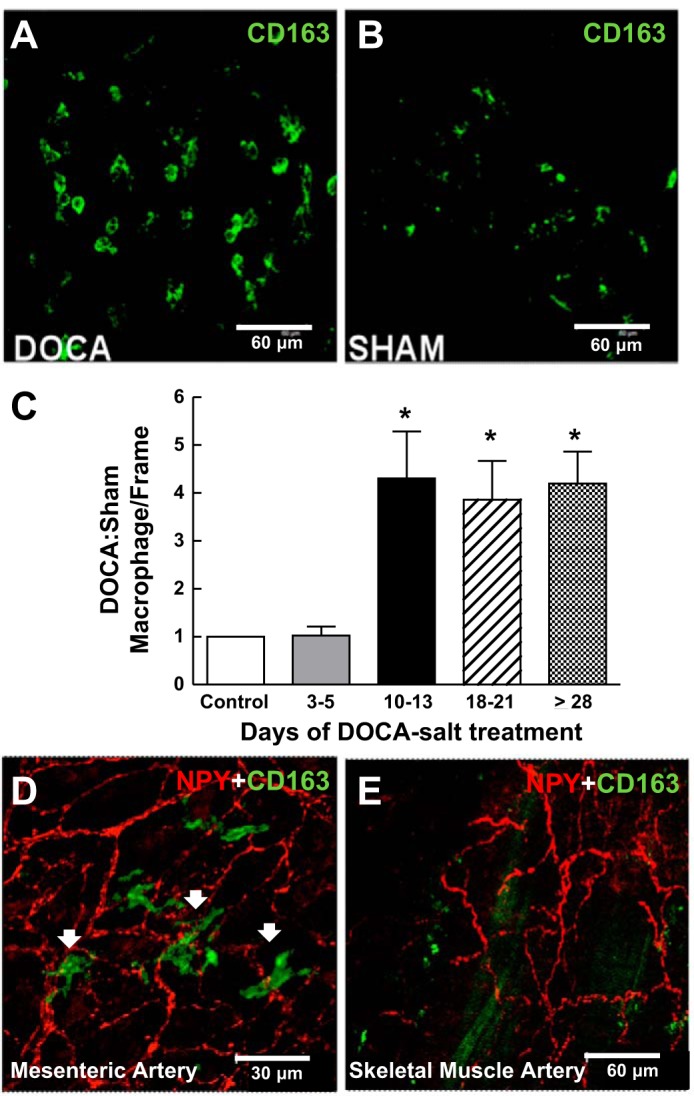
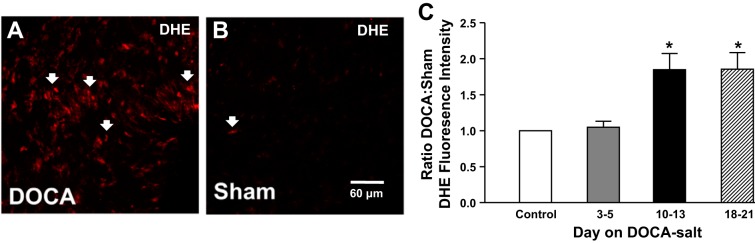
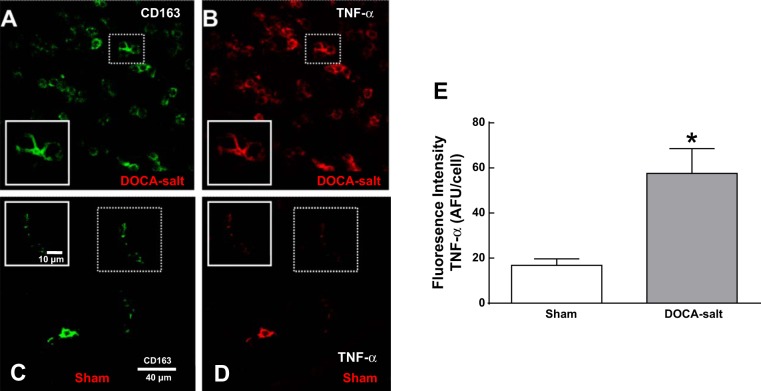
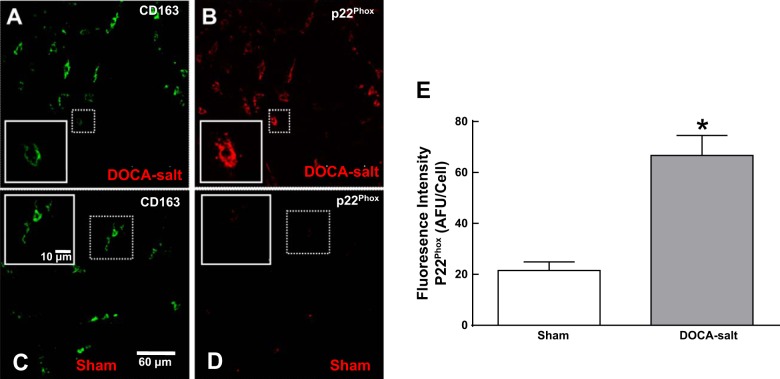
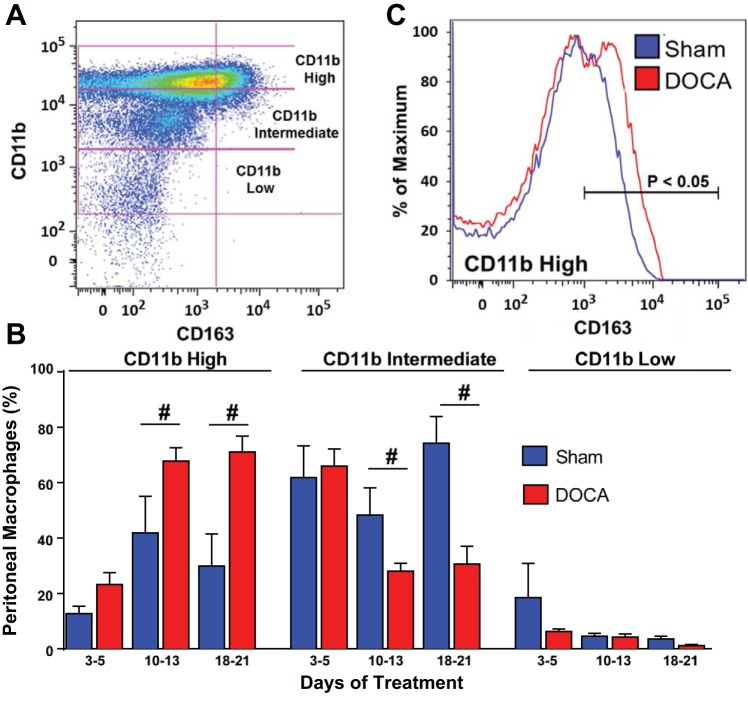
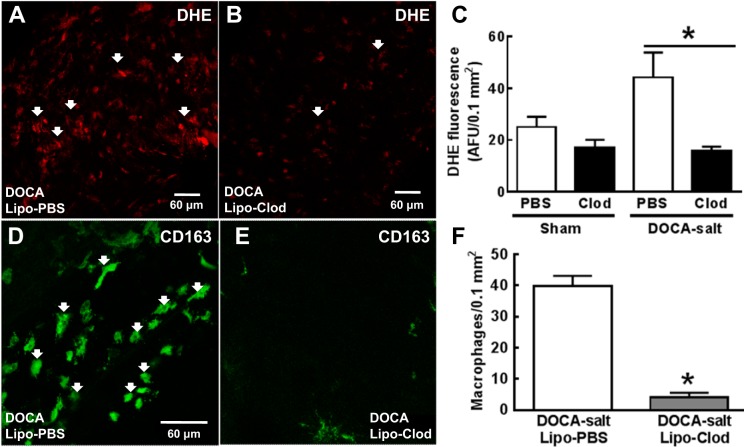
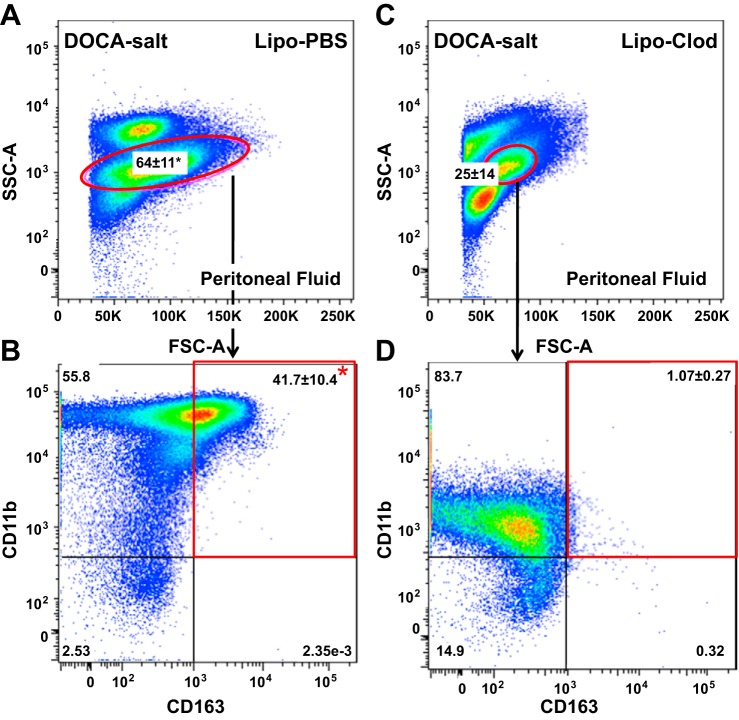
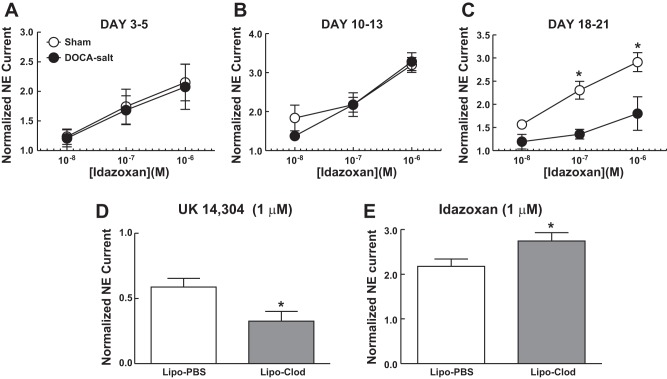
We tested the hypothesis that vascular macrophage infiltration and O2 (-) release impairs sympathetic nerve α2-adrenergic autoreceptor (α2AR) function in mesenteric arteries (MAs) of DOCA-salt hypertensive rats. Male rats were uninephrectomized or sham operated (sham). DOCA pellets were implanted subcutaneously in uninephrectomized rats who were provided high-salt drinking water or high-salt water with apocynin. Sham rats received tap water. Blood pressure was measured using radiotelemetry. Treatment of sham and DOCA-salt rats with liposome-encapsulated clodronate was used to deplete macrophages. After 3-5, 10-13, and 18-21 days of DOCA-salt treatment, MAs and peritoneal fluid were harvested from euthanized rats. Norepinephrine (NE) release from periarterial sympathetic nerves was measured in vitro using amperometry with microelectrodes. Macrophage infiltration into MAs as well as TNF-α and p22(phox) were measured using immunohistochemistry. Peritoneal macrophage activation was measured by flow cytometry. O2 (-) was measured using dihydroethidium staining. Hypertension developed over 28 days, and apocynin reduced blood pressure on days 18-21. O2 (-) and macrophage infiltration were greater in DOCA-salt MAs compared with sham MAs after day 10. Peritoneal macrophage activation occurred after day 10 in DOCA-salt rats. Macrophages expressing TNF-α and p22(phox) were localized near sympathetic nerves. Impaired α2AR function and increased NE release from sympathetic nerves occurred in MAs from DOCA-salt rats after day 18. Macrophage depletion reduced blood pressure and vascular O2 (-) while restoring α2AR function in DOCA-salt rats. Macrophage infiltration into the vascular adventitia contributes to increased blood pressure in DOCA-salt rats by releasing O2 (-), which disrupts α2AR function, causing enhanced NE release from sympathetic nerves.

Keywords: amperometry; immune activation; salt-sensitive hypertension; sympathetic nervous system; α2-adrenergic autoreceptors.


Figures

Fig. 1.
Fig. 1.
Time course of DOCA-salt hypertension development and effects of apocynin (A) and liposome-embedded clodronate (Lipo-Clod; B) treatment. A: DOCA-salt hypertension developed with a biphasic time course. Mean arterial pressure (MAP) rose steadily through day 13 (∼20-mmHg increase) and reached a plateau near day 16. MAP rose again after day 21. DOCA-salt treatment began on day 2 of the protocol. The NADPH oxidase inhibitor apocynin (2 mM in drinking water) reduced blood pressure between days 15 and 21. B: MAP of sham-operated (sham) normotensive and DOCA-salt hypertensive rats treated with liposome-embedded PBS (Lipo-PBS) or Lipo-Clod. Lipo-Clod reduced blood pressure during days 23–28 compared with DOCA-salt rats treated with Lipo-PBS. Lipo-Clod treatment did not affect MAP in sham groups. Data are means ± SEM and were analyzed by two-way ANOVA and a Bonferonni's post hoc test; n = 6–8 for all groups. *,#P < 0.05 vs. DOCA alone (A) or vs. DOCA Lipo-PBS (B).
Fig. 2.
Fig. 2.
Time-dependent macrophage infiltration into the adventitia of mesenteric arteries (MAs) but not skeletal muscle arteries of DOCA-salt hypertensive rats. A and B: whole mount immunohistochemical labeling of CD163-positive macrophages in the adventitia of MAs from DOCA-salt (A) and sham control rats (day 21; B). C: normalized number of macrophages per region. Macrophage numbers were four to five times higher in arteries from DOCA-salt rats compared with those from sham control rats beginning on days 10–13. Data are means ± SE and were analyzed by one-way ANOVA and a Bonferonni's post hoc test; n = 5. *P < 0.05 vs. control and days 3–5. D and E: whole mount immunohistochemical labeling of MA (D) and skeletal muscle (E) perivascular sympathetic nerves labeled by neuropeptide Y (NPY) immunoreactivity along with macrophage labeling with anti-CD163. Macrophages were found in close proximity to periarterial sympathetic nerves in MAs but not skeletal muscle arteries from DOCA-salt rats.
Fig. 3.
Fig. 3.
Detection of O2 in the adventitia of MAs. A and B: photomicrographs showing dihydroethidium (DHE; arrows) fluorescence in MAs from DOCA-salt (A) and sham control (B) rats. C: normalized mean DHE fluorescence intensity showing twofold higher DHE labeling in DOCA-salt compared with sham control MAs beginning after day 10 of DOCA-salt hypertension. Data are means ± SE and were analyzed by one-way ANOVA and a Bonferonni's post hoc test; n = 5. *P < 0.05 vs. control and days 3–5.
Fig. 4.
Fig. 4.
Macrophages in the adventitia of MAs of DOCA-salt rats express high levels of TNF-α. A–D: whole mount immunohistochemical labeling of CD163-positive and TNF-α in MAs from DOCA-salt (A and B) and sham control (C and D) rats on day 21. E: mean macrophage TNF-α fluorescence intensity was three times higher in DOCA-salt MA adventitial macrophages compared with that in MAs from sham control rats. AFU, arbitrary fluorescence units. Data are means ± SE; n = 5 rats/group. *P < 0.05 vs. sham rats.
Fig. 5.
Fig. 5.
Macrophages in the adventitia of MAs of DOCA-salt rats express elevated levels of p22phox. A–D: whole mount immunohistochemical labeling of macrophages positive for CD163 and p22phox in MAs from a DOCA-salt hypertensive rat (A and B) and a sham control rat (C and D) on day 21. E: mean macrophage p22phox fluorescence intensity showing three times higher levels in DOCA-salt MAs compared with those from control rats. Data are means ± SE; n = 5 rats/group. *P < 0.05 vs. sham rats.
Fig. 6.
Fig. 6.
Flow cytometry analysis of the time course of peritoneal macrophage activation in DOCA-salt hypertensive rats. A: dot plot of DOCA-salt hypertensive peritoneal macrophages showing three populations of macrophages: CD11b low, intermediate, and high on day 21 of DOCA-salt hypertension. B: the percentage of CD11b high macrophages was significantly higher in DOCA-salt MAs beginning on days 10–13. The percentage of CD11b intermediate macrophages was lower in DOCA-salt compared with sham MAs during the same time period. There were no changes in the CD11b low macrophage population. Data are means ± SE and were analyzed using a Kruskal-Wallis test; n = 5. #P < 0.05 vs. sham rats. C: CD163 fluorescence intensity histogram of the CD11b high macrophage population showing the higher expression of CD163 in DOCA-salt compared with sham control MAs.
Fig. 7.
Fig. 7.
Lipo-Clod treatment reduces adventitial O2 and macrophage infiltration in MAs from DOCA-salt rats. A: photomicrograph showing DHE fluorescence in a MA from a DOCA-salt rat treated with Lipo-PBS. B: photomicrograph showing DHE fluorescence in a MA from a DOCA-salt rat treated with Lipo-Clod. C: semiquantitative measurement of DHE fluorescence intensity in MAs of DOCA-salt rats treated with Lipo-PBS or Lipo-Clod. Data are means ± SE; n = 5 rats/group. *P < 0.05. D: whole mount immunohistochemical labeling of CD163-positive marcrophages in the adventitia of DOCA-salt rats treated with Lipo-PBS. E: there were fewer CD163-positive macrophages in the adventitial of MAs from DOCA-salt rats treated with Lipo-Clod. F: the mean number of adventitial macrophages in MAs from Lipo-Clod-treated DOCA-salt rats was lower than that in MAs from Lipo-PBS-treated DOCA-salt rats. Data are means ± SEM and were analyzed by a Mann-Whitney test; n = 5. *P < 0.05.
Fig. 8.
Fig. 8.
Flow cytometry dot plots of peritoneal macrophages from DOCA-salt rats treated with Lipo-PBS or Lipo-Clod. A: macrophages isolated from the peritoneal fluid from DOCA-salt rats treated with Lipo-PBS. B: CD11b/CD163 expression by macrophages from DOCA-salt rats treated with Lipo-PBS. C: macrophages isolated from the peritoneal fluid from DOCA-salt rats treated with Lipo-Clod. There were significantly fewer macrophages compared with DOCA-salt rats treated with Lipo-PBS. D: the percentage of activated (CD11b-positive/CD163-positive) peritoneal marcrophages was significantly lower in DOCA-salt rats treated with Lipo-Clod. Data are means ± SE and were analyzed by a Kruskal-Wallis' test; n = 5 rats/group. *P < 0.05. Dot plots are a concatenated analysis of 5 rats/group.
Fig. 9.
Fig. 9.
Time-dependent impairment of α2-adrenergic autoreceptor (α2AR) function and restoration by Lipo-Clod treatment of DOCA-salt hypertensive rats. Idazoxan, an α2AR antagonist, increased norepinephrine (NE) oxidation currents equally well in MAs from sham control and DOCA-salt rats on days 3–5 (A) and days 10–13 (B). Idazoxan-induced enhancement of the oxidation current was significantly reduced in MAs from DOCA-salt rats on days 18–21 (C). Data are means ± SE and were analyzed by two-way ANOVA and a Bonferonni's post hoc test; n = 5 rats/group. *P < 0.05 vs. DOCA-salt MAs. D: on days 23–25, UK-14304 (1 μM), an α2AR agonist, decreased NE oxidation current in DOCA-salt rats treated with Lipo-PBS and Lipo-Clod, but this effect was larger in treated rats. E: idazoxan (1 μM) induced an increase in normalized NE oxidation current in DOCA-salt rats treated with Lipo-PBS and Lipo-Clod, but this effect was significantly greater Lipo-Clod-treated DOCA-salt rats. Data are means ± SE and were analyzed by a Student's t-test; n = 5 rats/group. *P < 0.05 vs. Lipo-PBS. Nerve stimulation: 10 Hz, 5 s, 80V.

Similar articles

Cited by

References

    1. Asghar M, Banday AA, Fardoun RZ, Lokhandwala MF. Hydrogen peroxide causes uncoupling of dopamine D1-like receptors from G proteins via a mechanism involving protein kinase C and G-protein-coupled receptor kinase 2. Free Radic Biol Med 40: 13–20, 2006. - PubMed
    1. Averina VA, Othmer HG, Fink GD, Osborn JW. A new conceptual paradigm for the haemodynamics of salt-sensitive hypertension: a mathematical modelling approach. J Physiol 590: 5975–5992, 2012. - PMC - PubMed
    1. Barin JG, Rose NR, Cihakova D. Macrophage diversity in cardiac inflammation: a review. Immunobiology 217: 468–475, 2012. - PMC - PubMed
    1. Bouvier M, de Champlain J. Increased basal and reactive plasma norepinephrine and epinephrine levels in awake DOCA-salt hypertensive rats. J Auton Nerv Syst 15: 191–195, 1986. - PubMed
    1. Chan CT, Moore JP, Budzyn K, Guida E, Diep H, Vinh A, Jones ES, Widdop RE, Armitage JA, Sakkal S, Ricardo SD, Sobey CG, Drummond GR. Reversal of vascular macrophage accumulation and hypertension by a CCR2 antagonist in deoxycorticosterone/salt-treated mice. Hypertension 60: 1207–1212, 2012. - PubMed

Publication types

MeSH terms

LinkOut - more resources