. 2016 Jan;55(1):120-32.
doi: 10.1093/rheumatology/kev245. Epub 2015 Aug 28.

Ankylosing spondylitis patients display altered dendritic cell and T cell populations that implicate pathogenic roles for the IL-23 cytokine axis and intestinal inflammation

Affiliations

Ankylosing spondylitis patients display altered dendritic cell and T cell populations that implicate pathogenic roles for the IL-23 cytokine axis and intestinal inflammation

Pamela B Wright et al. Rheumatology (Oxford). 2016 Jan.

Abstract

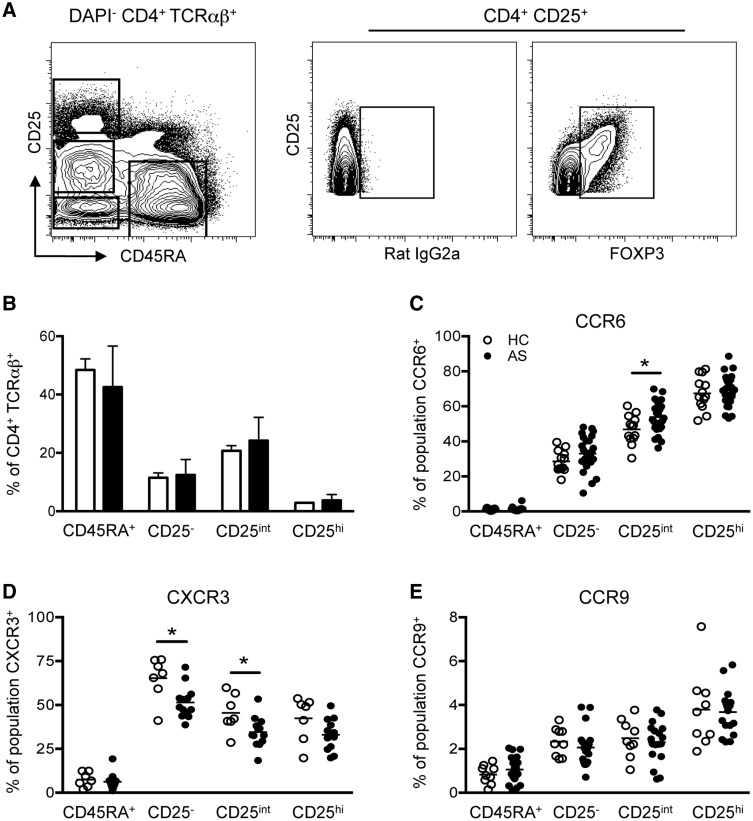
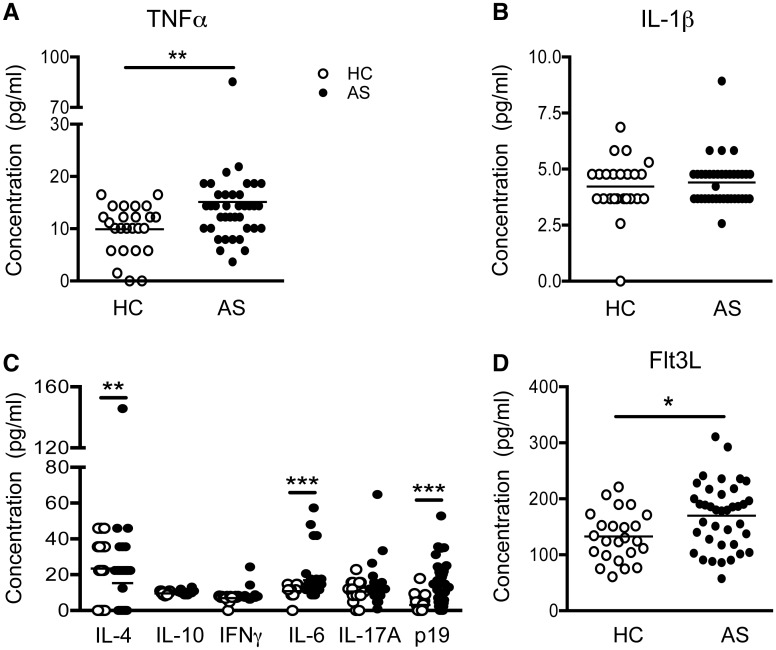
Objective: AS is a systemic inflammatory disease of the SpA family. Polymorphisms at loci including HLA-B27, IL-23R and ERAP-1 directly implicate immune mechanisms in AS pathogenesis. Previously, in an SpA model, we identified HLA-B27-mediated effects on dendritic cells that promoted disease-associated Th17 cells. Here we extend these studies to AS patients using deep immunophenotyping of candidate pathogenic cell populations. The aim of our study was to functionally characterize the immune populations mediating AS pathology.

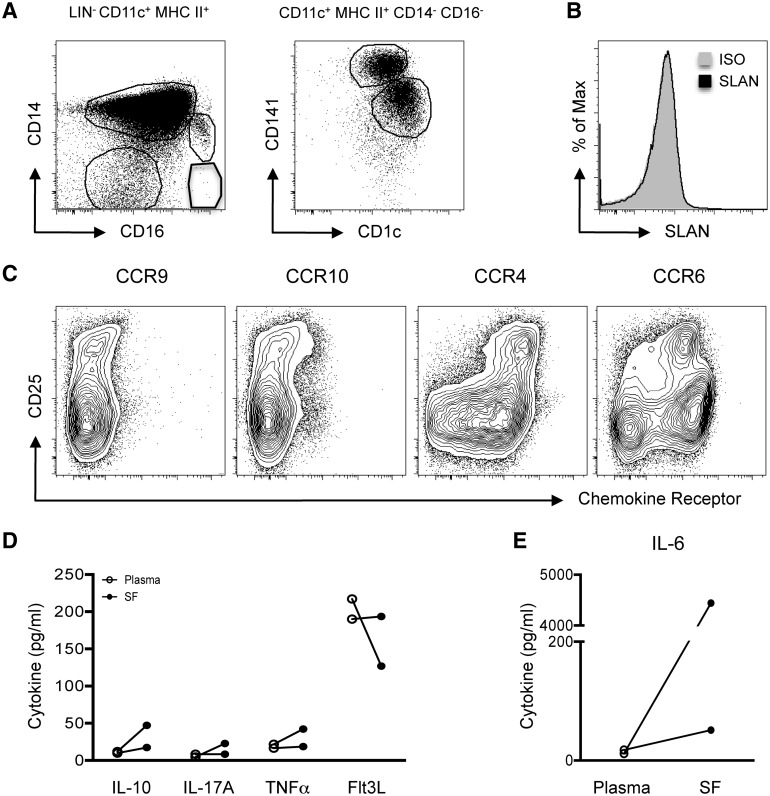
Methods: Using 11-parameter flow cytometry, we characterized the phenotype and functions of lymphocyte and myeloid cells from peripheral blood, and the synovial phenotype of AS patients and age-matched healthy controls.

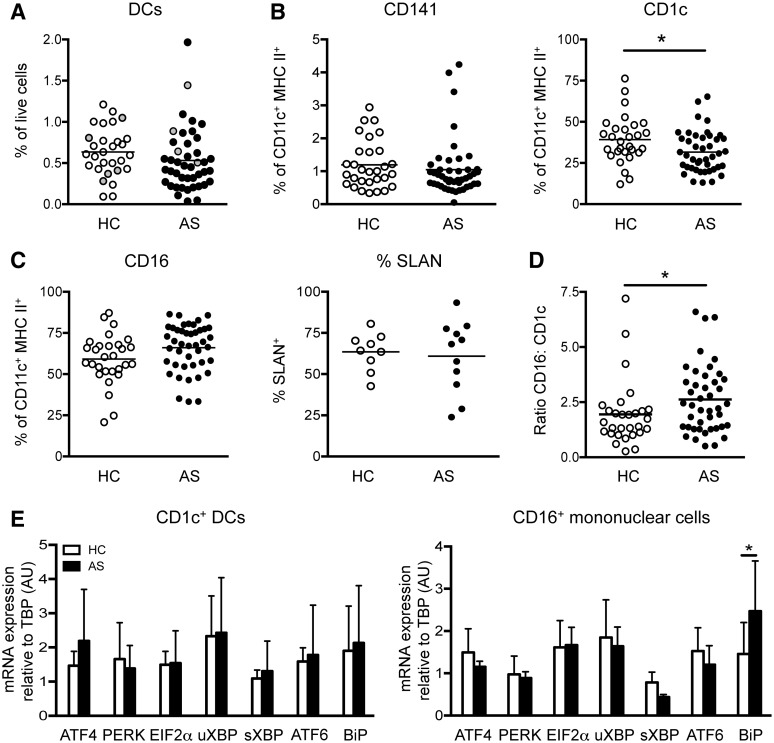
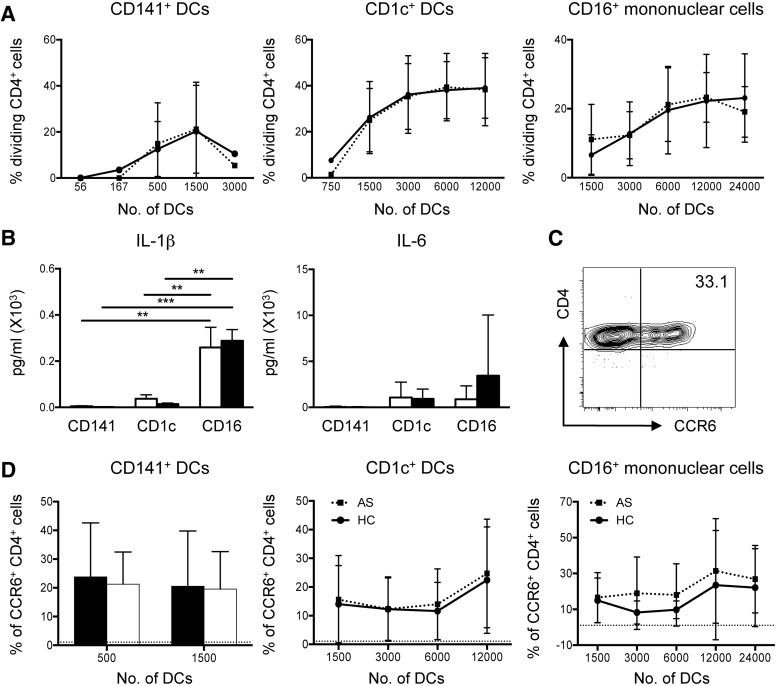
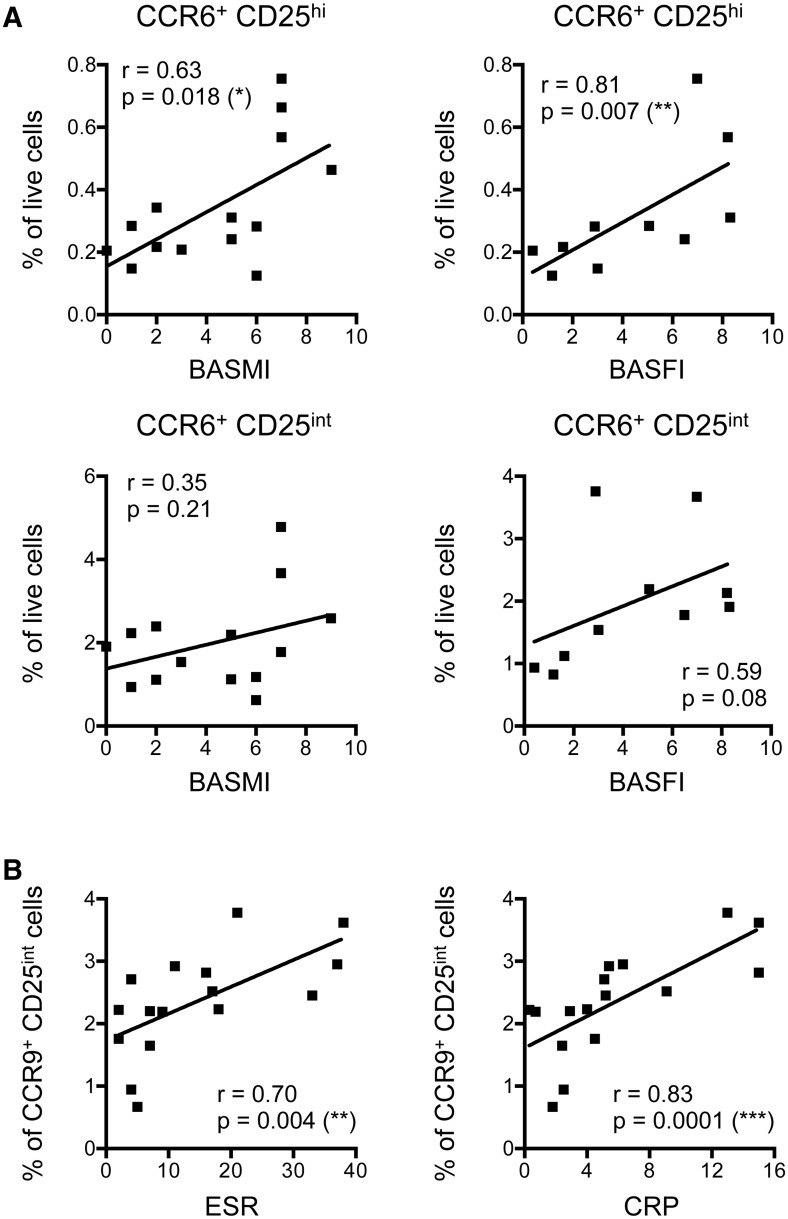
Results: Significantly fewer circulating CD1c-expressing dendritic cells were observed in AS patients, offset by an increase in CD14(-) CD16(+) mononuclear cells. Ex vivo functional analysis revealed that this latter population induced CCR6 expression and promoted secretion of IL-1β and IL-6 when co-cultured with naive CD4(+) T cells. Additionally, systemic inflammation in AS patients significantly correlated with increased proportions of activated CCR9(+) CD4(+) T cells.

Conclusion: CD14(-) CD16(+) mononuclear cells may contribute to AS by promoting Th17 responses, and antigen-presenting cells of mucosal origin are likely to contribute to systemic inflammation in AS.

Keywords: CD14− CD16+ mononuclear cells; CD4+ T cells; ankylosing spondylitis; dendritic cells; inflammation.


Figures

F<sc>ig</sc>. 1
Fig. 1
Expression of CCR6 and CXCR3 on circulating CD4+ T cell subsets (A) CD25 and CD45RA define four circulating CD4+ T cell populations. FOXP3 expression on total CD25+ cells. (B) Quantification of naive (CD45RA+), memory (CD25), activated (CD25int) and regulatory (CD25hi) T cells in HCs (n = 14, empty bars) and AS patients (n = 27, filled bars). CCR6 (C), CXCR3 (D) and CCR9 (E) expression on CD4+ T cell subsets [HCs (empty circles), n = 7–13; AS patients (filled circles), n = 13–26]. Each dot represents one individual. *P < 0.05, Mann–Whitney test performed for CXCR3 expression on CD25 T cells, otherwise unpaired Student’s tests were performed. Error bars show mean + s.d.
F<sc>ig</sc>. 2
Fig. 2
Systemic cytokine profile of AS patients Cytokine and growth factor levels were determined by Luminex or ELISA for HCs (empty circles) and AS patients (filled circles). Levels of TNFα (A) and IL-1β (B) in HC (n = 24–25) and AS patient (n = 38) plasma. (C) Detection of Th cell-associated cytokines IL-4, IL-10, IFNγ, IL-6, IL-17A and IL-23p19 within HC (n = 23–24) and AS patient (n = 38) plasma. (D) Amount of plasma Flt3L in HCs (n = 24) and AS patients (n = 38). Statistical analyses were performed between HCs and AS patients for each parameter. *P < 0.05, **P < 0.01, ***P < 0.001 using Mann–Whitney tests.
F<sc>ig</sc>. 3
Fig. 3
Circulating myeloid profile of AS patients (A) Enumeration of total circulating HC (n = 29) and AS patient (n = 43) DCs. Grey dots indicate HLA-B27+ HCs and HLA-B27 AS patients where appropriate. CD141+ and CD1c+ DCs (B), total CD16+ and SLAN+ CD16+ mononuclear cells (C) as a proportion of LIN (CD3/CD15/CD19/CD56) CD14 CD11c+ HLA-DR+ cells in HCs (n = 9–30) and AS patients (n = 11–43). (D) Ratio of CD16+ mononuclear cells:CD1c+ DCs in HCs (n = 29) and AS patients (n = 43). (E) ER stress gene expression in FACS-purified HC (n = 4) and AS patient (n = 3) myeloid cells, relative to TATA-binding protein (TBP) using the 2−ΔΔCt method with the HC population equal to 1 (arbitrary units. *P < 0.05, Mann–Whitney test or two-way ANOVA. Error bars show ± s.d.
F<sc>ig</sc>. 4
Fig. 4
Immunological milieu of AS SF (A) Live, single LIN (CD3/CD15/CD19/CD56) CD11c+ HLA-DR+ cells were divided into three myeloid subsets: CD14+ CD16 monocytes, CD14+ CD16+ monocytes and CD14 CD16 cells. The CD14 CD16 subset contained SF DCs—CD141+ and CD1c+ populations. (B) SLAN expression on total live LIN CD14 CD11c+ HLA-DR+ cells, compared with isotype (shaded grey). (C) CCR9, CCR10, CCR4 and CCR6 expression on AS patient (n = 1) CD3+ CD4+ SF T cells. AS patient (n = 2) concentrations of IL-10, IL-17A, TNFα, Flt3L (D) and IL-6 (E) in matched plasma (empty) and SF (filled).
F<sc>ig</sc>. 5
Fig. 5
Functional assessment of DC : T cell interactions in AS (A) CD4+ T cell proliferation assessed by mixed leucocyte reaction (MLR) with indicated myeloid populations. (B) IL-1β and IL-6 secretion following MLR. (C) Representative plot depicting CCR6 induction on proliferating CD4+ T cells following HC CD1c+ DC co-culture. (D) Quantification of CCR6 expression on proliferating CD4+ T cells following MLR with individual myeloid subsets. For analysis, 4–10 HCs and 6–15 AS patients were used. Dotted line at 1.078 equates to level of CCR6 expression on naive CD4+ T cells. **P < 0.01 and ***P < 0.001. Mann–Whitney test or two-way ANOVA (B) were performed. Error bars show ± s.d.
F<sc>ig</sc>. 6
Fig. 6
Immunological parameter correlations with disease progression and inflammation in AS (A) Correlations between AS patient (n = 14) CCR6-expressing CD4 + CD25hi T cells (Tregs; Top) and CCR6+ CD25int T cells (activated; bottom) with BASMI (left) and BASFI (right) clinical scores. (B) ESR and CRP correlations with AS patient (n = 16) CCR9+ CD4+ CD25int (activated) cell frequencies. Each dot represents one individual. Analyses were performed and assessed using linear regression and the Kruskal–Wallis Spearman correlative statistical tests (r), using the Dunn multiple comparisons post-test. *P < 0.05, **P < 0.01 and ***P < 0.001.

Similar articles

Cited by

References

    1. Australo-Anglo-American Spondyloarthritis Consortium (TASC): Reveille JD, Sims A-M, Danoy P, Evans DM, Leo P, et al. Genome-wide association study of ankylosing spondylitis identifies non-MHC susceptibility loci. Nat Genet 2010;42:123–7. - PMC - PubMed
    1. Wellcome Trust Case Control Consortium, Australo-Anglo-American Spondylitis Consortium [TASC]: Burton PR, Clayton DG, Cardon LR, Craddock N, Deloukas P, et al. Association scan of 14,500 nonsynonymous SNPs in four diseases identifies autoimmunity variants. Nat Genet 2007;39:1329–37. - PMC - PubMed
    1. Danoy P, Pryce K, Hadler J, et al. Association of variants at 1q32 and STAT3 with ankylosing spondylitis suggests genetic overlap with Crohn’s disease. PLoS Genet 2010;6:e1001195. - PMC - PubMed
    1. Baeten D, Baraliakos X, Braun J, et al. Anti-interleukin-17A monoclonal antibody secukinumab in treatment of ankylosing spondylitis: a randomised, double-blind, placebo-controlled trial. Lancet 2013;382:1705–13. - PubMed
    1. Breban M, Fernández-Sueiro JL, Richardson JA, et al. T cells, but not thymic exposure to HLA-B27, are required for the inflammatory disease of HLA-B27 transgenic rats. J Immunol 1996;156:794–803. - PubMed

Publication types

MeSH terms