. 2015 Nov;14(11):3056-71.
doi: 10.1074/mcp.M115.048850. Epub 2015 Aug 28.

Proteomic and Biochemical Studies of Lysine Malonylation Suggest Its Malonic Aciduria-associated Regulatory Role in Mitochondrial Function and Fatty Acid Oxidation

Affiliations

Proteomic and Biochemical Studies of Lysine Malonylation Suggest Its Malonic Aciduria-associated Regulatory Role in Mitochondrial Function and Fatty Acid Oxidation

Gozde Colak et al. Mol Cell Proteomics. 2015 Nov.

Abstract

The protein substrates of sirtuin 5-regulated lysine malonylation (Kmal) remain unknown, hindering its functional analysis. In this study, we carried out proteomic screening, which identified 4042 Kmal sites on 1426 proteins in mouse liver and 4943 Kmal sites on 1822 proteins in human fibroblasts. Increased malonyl-CoA levels in malonyl-CoA decarboxylase (MCD)-deficient cells induces Kmal levels in substrate proteins. We identified 461 Kmal sites showing more than a 2-fold increase in response to MCD deficiency as well as 1452 Kmal sites detected only in MCD-/- fibroblast but not MCD+/+ cells, suggesting a pathogenic role of Kmal in MCD deficiency. Cells with increased lysine malonylation displayed impaired mitochondrial function and fatty acid oxidation, suggesting that lysine malonylation plays a role in pathophysiology of malonic aciduria. Our study establishes an association between Kmal and a genetic disease and offers a rich resource for elucidating the contribution of the Kmal pathway and malonyl-CoA to cellular physiology and human diseases.


Figures

Fig. 1.
Fig. 1.
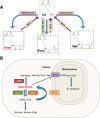
Lysine malonylation and biosynthesis of malonyl-CoA. A, structures of malonyllysine (Kmal), succinyllysine (Ksucc), and glutaryllysine (Kglu). SIRT5 is an enzyme with demalonylation, desuccinylation, and deglutarylation activities. B, illustration of malonyl-CoA metabolism. FAS, fatty-acid synthase; ACC1 and ACC2, acetyl-CoA carboxylases 1 and 2.
Fig. 2.
Fig. 2.
Dynamic changes of lysine malonylation versus other lysine acylations. A, lysine acylation levels in hepatocytes from (Sirt5+/+) and Sirt5 knock-out (Sirt5−/−) mice. Four pairs of mice were used. From top to bottom, anti-acetyllysine blot, anti-succinyllysine blot, anti-malonyllysine blot, and Coomassie Blue loading control. B, MCD+/+ cells treated with 5 and 15 μm orlistat for 48 h. Top, anti-malonyllysine blot; bottom, Ponceau loading control. C, dynamics of lysine acylation in response to orlistat, a fatty acid synthase inhibitor. The MCD+/+ and MCD−/− cells were both treated with 15 μm orlistat for 48 h. From left to right, anti-malonyllysine blot, anti-acetyllysine blot, anti-succinyllysine blot, and Coomassie Blue loading control. D, relative malonyl-CoA levels of MCD+/+ and MCD−/− cells with and without 24-h orlistat treatment. Bars represent S.E. See also supplemental Fig. S1.
Fig. 3.
Fig. 3.
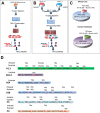
Schematic representation of experimental workflow. A, profiling of lysine malonylation substrates in Sirt5 KO mouse liver. B, identification and quantification of lysine malonylation substrates using SILAC and mass spectrometry in MCD+/+ (heavy) and MCD−/− (light) cell lines. C, pie charts showing the total numbers of identified lysine malonylated sites in mouse liver (top) and MCD+/+ and MCD−/− human cells (bottom). The number of Kmal sites with their corresponding MaxQuant Andromeda score ranges and percentiles are indicated. D, representation of lysine malonylated (Ma) histone sites in mouse and human histones. A1 and S1 represent the first alanine and serine residues of the protein, respectively.
Fig. 4.
Fig. 4.
Stoichiometry analysis of lysine malonylome. A, scatter plot showing the peptide intensities (i.e. the summed precursor ion intensities of each peptide derived from MaxQuant software) of the quantifiable lysine malonylated peptides in relation to their dynamic change in response to MCD knock-out. Kmal ratio (MCD+/+:MCD−/−), MS signal intensity from MCD+/+ divided by that from MCD−/−. Red, log2 ratio (MCD+/+:MCD−/−) ≤ −1; green, −1 ≤ log2 ratio (MCD+/+:MCD−/−) ≤ 1; purple, log2 ratio (MCD+/+:MCD−/−) ≥ 1. B, histogram showing the distribution of the log2 ratio (MCD+/+:MCD−/−) SILAC ratios of Kmal sites in MCD+/+ cells over MCD−/− cells. The y axis represents the number of Kmal peptides in each category before (green) and after (red) normalization to the protein amount. C, stoichiometry analysis of lysine malonylation sites in MCD+/+ and MCD−/− human fibroblasts. The x axis represents individual Kmal sites, and the y axis represents the stoichiometry percentage. D, three-dimensional protein structure of acetyl-CoA acetyltransferase 1 (ACAT1) shown with lysine malonylation sites (Lys190, Lys243, Lys251, Lys263, Lys268, and Lys273) and the coenzyme A binding site. Dashed black lines represent hydrogen bonds.
Fig. 5.
Fig. 5.
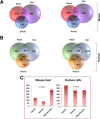
Analysis of Kmal substrates versus Kac and Ksucc substrates. A, Venn diagrams showing the numbers of overlapping and non-overlapping Kmal, Ksucc, and Kac proteins (left) and modification sites (right) in the mouse proteome. The mouse Kac and Ksucc data sets were obtained from two previous publications (10, 43). B, Venn diagrams showing the numbers of overlapping and non-overlapping Kmal, Ksucc, and Kac proteins (left) and modification sites (right) in the human proteome. All identified Kmal sites in MCD+/+ and MCD−/− cells were combined for this comparison. The human Kac and Ksucc data sets were from two previous works (41, 47). C, graphical representation of subcellular localization of lysine malonylated proteins. In each panel, bar diagrams show the numbers of modified proteins that are exclusively located in the cytosol, nuclei, and mitochondria in mouse liver (left) and human cells (right). See also supplemental Figs. S2, S6, and Table S7.
Fig. 6.
Fig. 6.
Immunocytochemistry imaging of MCD+/+ (A) and MCD−/− (B) cells. Top to bottom, Kmal, Kac, and Ksucc staining, and second antibody (Ab) only (negative) control. Left to right, Hoechst nuclear stain, corresponding PTM, MitoTracker Red (Mito), and overlapped channels.
Fig. 7.
Fig. 7.
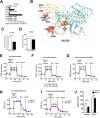
Lysine malonylation impacts mitochondrial function and fatty acid oxidation. A, the SILAC ratios of lysine malonylation sites of VLCAD determined by quantitative proteomics between MCD+/+ and MCD−/− fibroblast cells, respectively. A number of malonylated lysines were only detected in MCD−/− cells. B, VLCAD protein structure with mapped lysine malonylation sites (Protein Data Bank codes 2UXW and 3B96). C, palmitoyl-CoA dehydrogenase activity of the VLCAD enzyme in cell lysates from MCD+/+ and MCD−/− cells. Bars represent means ± S.E. (n = 3–6). D, 3-keto-palmitoyl-CoA dehydrogenase activity of the LCHAD enzyme in cell lysates from MCD+/+ and MCD−/− cells. Bars represent means ± S.E. (n = 3). E–G, respiration analysis of digitonin-permeabilized Fao hepatoma cells that were exposed to 50 mm malonate for 1 day followed by overnight incubation in malonate-free medium (see text for details). Respiration analysis was performed with pyruvate/malate (E), succinate/rotenone (F), or octanoylcarnitine/malate (G). H–J, respiration analysis of digitonin-permeabilized MCD+/+ and MCD−/− fibroblasts similar to F and G. OM, oligomycin; AM/rot, antimycin/rotenone; octcar, octanoylcarnitine; succ, succinate. *, p value <0.05; ***, p value <0.001. Bars represent mean +/− S.E. See also supplemental Fig. S7.
Fig. 8.
Fig. 8.
Graphical abstract: schematic illustration of hypothetical mechanisms of how Kmal and Kglu may contribute to disease phenotype. MCD and glutaryl-CoA dehydrogenase (GCDH) deficiencies lead to elevated malonate/malonyl-CoA (top) and glutarate/glutaryl CoA (bottom) levels, respectively. This can cause dynamic changes in Kmal (top) and Kglu (bottom), which may contribute to disease phenotypes of patients with MCD deficiency and glutaryl-CoA dehydrogenase deficiency.

References

    1. Roth S. Y., Denu J. M., and Allis C. D. (2001) Histone acetyltransferases. Annu. Rev. Biochem. 70, 81–120 - PubMed
    1. Yang X. J., and Seto E. (2007) HATs and HDACs: from structure, function and regulation to novel strategies for therapy and prevention. Oncogene 26, 5310–5318 - PubMed
    1. Chang H. C., and Guarente L. (2014) SIRT1 and other sirtuins in metabolism. Trends Endocrinol. Metab. 25, 138–145 - PMC - PubMed
    1. Wagner G. R., and Hirschey M. D. (2014) Nonenzymatic protein acylation as a carbon stress regulated by sirtuin deacylases. Mol. Cell 54, 5–16 - PMC - PubMed
    1. Giblin W., Skinner M. E., and Lombard D. B. (2014) Sirtuins: guardians of mammalian healthspan. Trends Genet. 30, 271–286 - PMC - PubMed

Publication types

MeSH terms

Supplementary concepts

LinkOut - more resources