. 2015 Oct 13;5(4):597-608.
doi: 10.1016/j.stemcr.2015.07.011. Epub 2015 Aug 28.

A Safeguard System for Induced Pluripotent Stem Cell-Derived Rejuvenated T Cell Therapy

Affiliations

A Safeguard System for Induced Pluripotent Stem Cell-Derived Rejuvenated T Cell Therapy

Miki Ando et al. Stem Cell Reports. .

Abstract

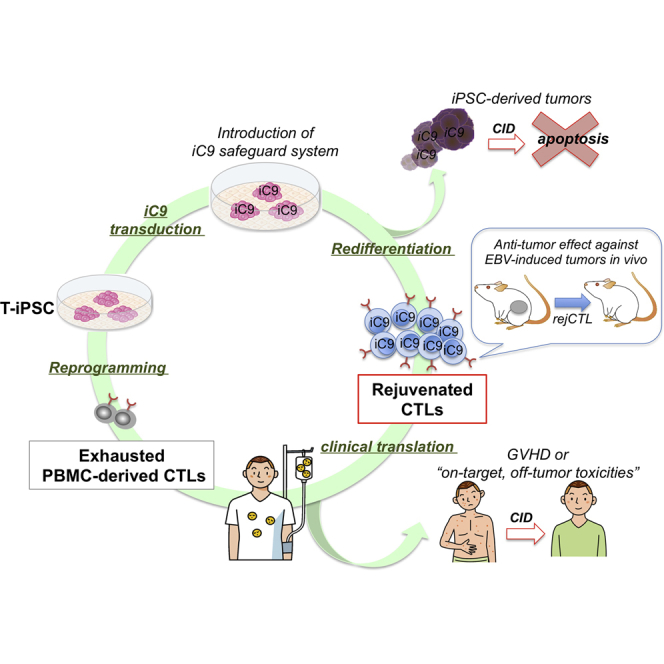
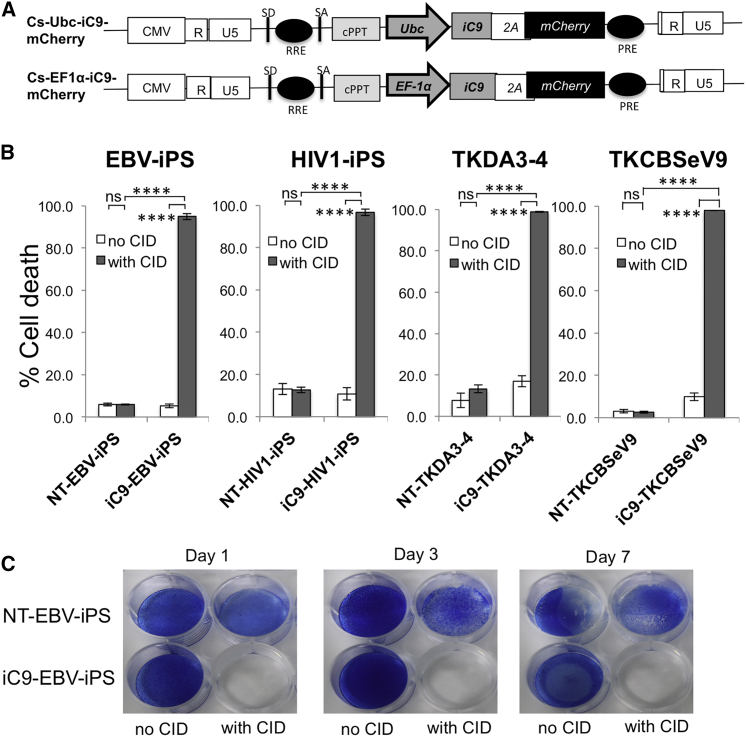
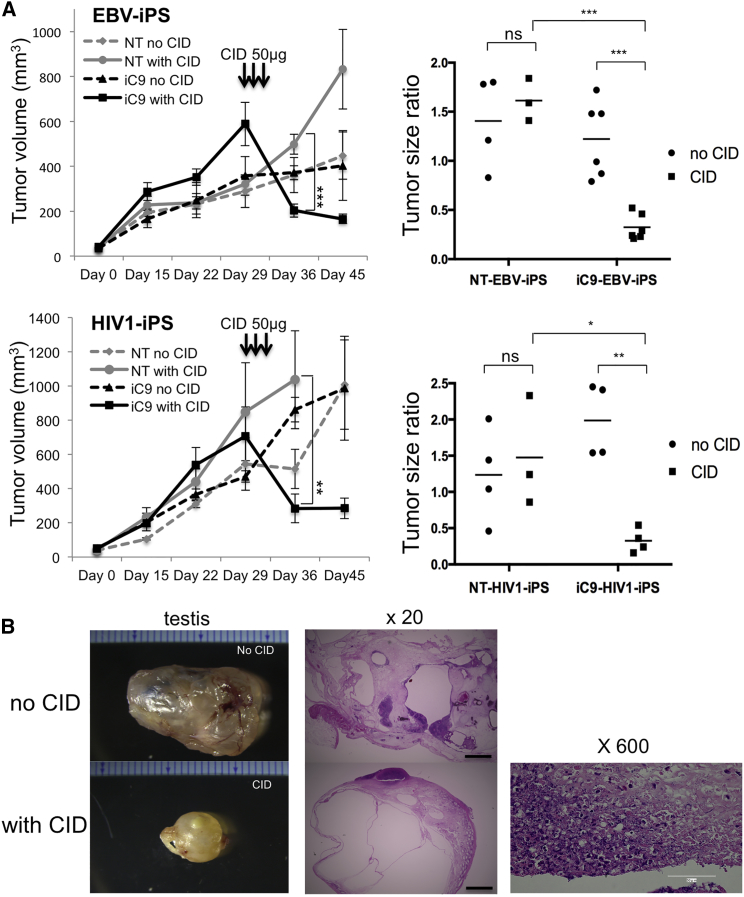
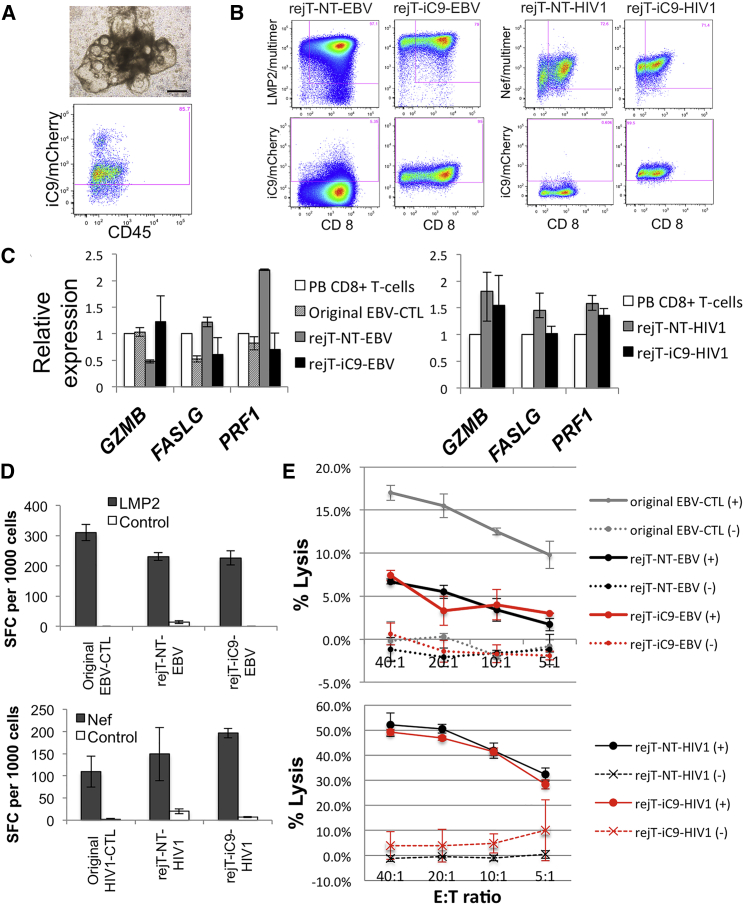
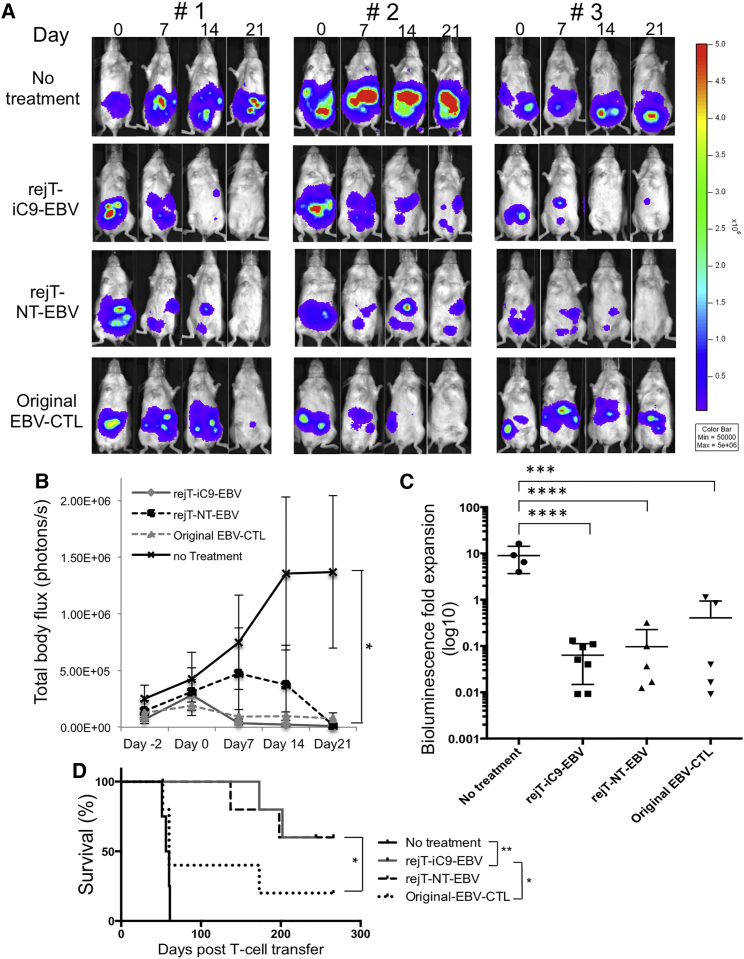
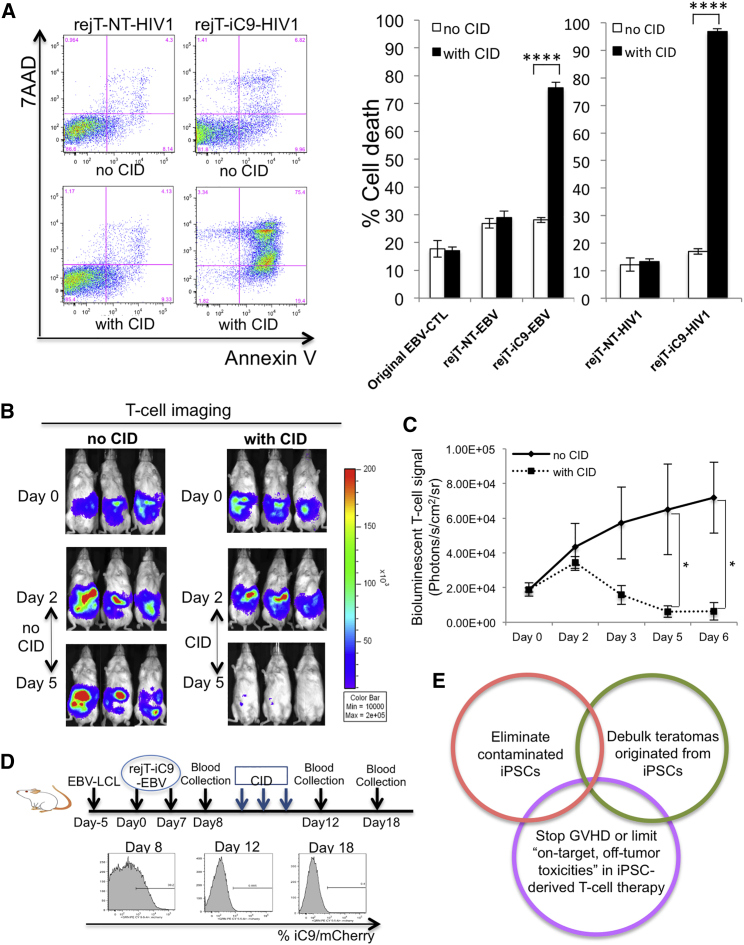
The discovery of induced pluripotent stem cells (iPSCs) has created promising new avenues for therapies in regenerative medicine. However, the tumorigenic potential of undifferentiated iPSCs is a major safety concern for clinical translation. To address this issue, we demonstrated the efficacy of suicide gene therapy by introducing inducible caspase-9 (iC9) into iPSCs. Activation of iC9 with a specific chemical inducer of dimerization (CID) initiates a caspase cascade that eliminates iPSCs and tumors originated from iPSCs. We introduced this iC9/CID safeguard system into a previously reported iPSC-derived, rejuvenated cytotoxic T lymphocyte (rejCTL) therapy model and confirmed that we can generate rejCTLs from iPSCs expressing high levels of iC9 without disturbing antigen-specific killing activity. iC9-expressing rejCTLs exert antitumor effects in vivo. The system efficiently and safely induces apoptosis in these rejCTLs. These results unite to suggest that the iC9/CID safeguard system is a promising tool for future iPSC-mediated approaches to clinical therapy.


Figures

None
Graphical abstract
Figure 1
Figure 1
iC9 Activation with CID Induces Robust Apoptosis of iPSCs (A) Schematic representation of two lentiviral iC9 bicistronic vectors containing Ubc or EF1α promoters. Both vectors contain the suicide gene iC9, cleavable 2A-like sequence, and mCherry as a selectable marker. (B) T-iPSC lines (EBV-iPSC and HIV1-iPSC) and cell lines TKDA3-4 and TKCBSeV9 were transduced with lentiviral Ubc-iC9. These established four Ubc-iC9-iPSC lines and four nontransduced iPSC lines were treated with CID (80 nM), and apoptosis was measured 24 hr later by flow cytometry for annexin V/7-AAD marking. Data are representative of three independent triplicate experiments. Error bars represent ± SD. ∗∗∗∗p < 0.0001 by two-way ANOVA. ns, not significant. (C) NT-EBV-iPSCs and iC9-EBV-iPSCs were plated; on the following day, both iPSCs were left untreated or were treated with CID. On days 1, 3, and 7 after CID treatment, iPSCs in each dish were stained with methylene blue. Data are representative of three independent experiments. See also Figure S1.
Figure 2
Figure 2
iC9 Can Debulk Teratomas Originated from iPSCs (A) NT-iPSCs or iC9-iPSCs were injected into the testes of NOD-Scid mice (day 0). Around day 30, mice were divided into four groups (EBV-iPS: NT without CID [n = 4], NT with CID [n = 3], iC9 without CID [n = 6], and iC9 with CID [n = 6]; HIV1-iPS: NT without CID [n = 4], NT with CID [n = 3], iC9 without CID [n = 4], and iC9 with CID [n = 4]) with or without daily intraperitoneal injections of CID. The average tumor volume in each group from day 0 to day 45 is shown (left). Error bars represent ± SEM. ∗∗p < 0.01 and ∗∗∗p < 0.001 by two-way ANOVA. Using TVs on days 0, 29, and 36, the tumor size ratio was calculated (right). p < 0.05, ∗∗p < 0.01, and ∗∗∗p < 0.001 by two-way ANOVA. (B) Tumors formed by iC9-HIV1-iPSCs in testes of male NOD-Scid mice were untreated or treated by CID (left). Representative H&E-stained sections of intratesticular tumors of untreated or CID-treated mice (middle). The scale bars represent 1 mm. A high-magnification view of the testis of a CID-treated mouse (right). Hematoxylinophilic debris marks cell loss ascribed to CID-induced apoptosis. The scale bar represents 100 μm.
Figure 3
Figure 3
iC9-iPSCs Can Efficiently Differentiate into Virus-Specific CTLs (A) iC9-HIV1-iPSC sacs on day 14 of culture on C3H10T1/2 feeder cells (upper). The scale bar represents 500 μm. One day after sac extraction, extracted hematopoietic progenitor cells were analyzed by flow cytometry. Flow cytometric analysis of iC9/mCherry expression by CD235a, CD34+, and CD43+ gated cells (lower). (B) Flow cytometric analysis of peptide-HLA multimer labeling/CD8 expression by iPSC-derived CTLs 14 days after the third stimulation. Expression of iC9/mCherry by these CTLs is shown. The plots are representative of at least five independent differentiation experiments. (C) Quantitative PCR analysis to compare the expression of cell-lysis molecules in PB CD8+ T cells, original EBV-CTLs, rejT-NT-EBV, and rejT-iC9-EBV (left). The same analysis was also carried out in PB CD8+ T cells, rejT-NT-HIV1, and rejT-iC9-HIV1 (right). Individual PCR results were normalized against 18S rRNA. Data are presented as the mean of three independent experiments ± SD. (D) IFN-γ production by original EBV-CTLs, rejT-NT-EBV, and rejT-iC9-EBV in the presence of LMP2 peptide was measured using ELISPOT. IFN-γ production by original HIV1-CTLs, rejT-NT-HIV1, and rejT-iC9-HIV1 in the presence of Nef peptide was measured similarly. Data are presented as the mean ± SD and are representative of three independent triplicate experiments. (E) In vitro 51Cr-release assay of original EBV-CTLs, rejT-NT-EBV, and rejT-iC9-EBV (effectors) and EBV-transformed B lymphoblastoid cell lines (targets) (upper) and that of rejT-NT-HIV1 and rejT-iC9-HIV1 (effectors) and Nef-presenting LCLs (targets) (lower). Data are presented as the mean ± SD and are representative of at least three independent triplicate experiments. See also Figure S2.
Figure 4
Figure 4
In Vivo Antitumor Effect of iC9-iPSC-Derived EBV-CTLs (A) NOD-Scid mice were inoculated intraperitoneally with HLA-A02-positive EBV-LCL cells labeled with GFP/FFluc and then treated either with control or EBV-CTL lines. Mice were divided into three groups that around 5 days later received rejT-iC9-EBV (n = 7), rejT-NT-EBV (n = 5), or original EBV-CTLs (n = 5). “No treatment” indicates that mice were injected with EBV-LCLs but not with CTLs (n = 4). Images of three representative mice from each group are shown. (B) Total body flux (photons/s) for each mouse was quantified, and group averages were calculated. Error bars represent ± SEM. p < 0.05 by one-way ANOVA comparing no treatment to rejT-iC9-EBV, rejT-NT-EBV, or original EBV-CTLs. (C) Total tumor growth by day 21 after CTL infusions is represented as log10 signal change. Error bars represent ± SD. ∗∗∗∗p < 0.0001 and ∗∗∗p < 0.001 by one-way ANOVA. (D) Kaplan-Meier survival curves for treated and control mice (rejT-iC9-EBV, n = 7; rejT-NT-EBV, n = 5; original EBV-CTLs, n = 5; no treatment, n = 4). ∗∗p < 0.01 and p < 0.05 by the Gehan-Breslow-Wilcoxon test.
Figure 5
Figure 5
Induction of Apoptosis in iC9-iPSC-Derived CTLs by Activation of iC9 (A) Flow cytometric analysis of annexin V binding and 7-AAD uptake by rejT-NT-HIV1 and rejT-iC9-HIV1 24 hr after CID treatment (left). Original EBV-CTLs, rejT-NT-EBV, rejT-iC9-EBV, rejT-NT-HIV1, and rejT-iC9-HIV1 were left untreated or treated with CID. Apoptosis was assessed 24 hr after treatment. Data are representative of three independent triplicate experiments. Error bars represent ± SD. ∗∗∗∗p < 0.0001 by two-way ANOVA. (B) In vivo bioluminescent imaging of rejT-iC9-EBV expressing FFluc. NOD-Scid mice inoculated intraperitoneally with EBV-LCL cells and with rejT-iC9-EBV cells received three doses of CID (50 μg) intraperitoneally (n = 4). Comparison mice received no CID (n = 3). Images of three representative mice from each group are shown. (C) FFluc signal intensities after rejT-iC9-EBV cell transfer in each group. Error bars represent ± SEM. p < 0.05 by unpaired Student’s t test (two-tailed). (D) Study schema of in vivo rejT-iC9-mCherry detection in peripheral blood (upper). mCherry expression was quantified by flow cytometry (n = 4 per group). Representative data of three experiments are shown (lower). (E) Schematic illustration of the iC9/CID safeguard system to protect patients receiving iPSC-derived CTL therapy. See also Figure S3.

References

    1. Albeck J.G., Burke J.M., Aldridge B.B., Zhang M., Lauffenburger D.A., Sorger P.K. Quantitative analysis of pathways controlling extrinsic apoptosis in single cells. Mol. Cell. 2008;30:11–25. - PMC - PubMed
    1. Ando M., Hoyos V., Yagyu S., Tao W., Ramos C.A., Dotti G., Brenner M.K., Bouchier-Hayes L. Bortezomib sensitizes non-small cell lung cancer to mesenchymal stromal cell-delivered inducible caspase-9-mediated cytotoxicity. Cancer Gene Ther. 2014;21:472–482. - PMC - PubMed
    1. Ben-David U., Gan Q.F., Golan-Lev T., Arora P., Yanuka O., Oren Y.S., Leikin-Frenkel A., Graf M., Garippa R., Boehringer M. Selective elimination of human pluripotent stem cells by an oleate synthesis inhibitor discovered in a high-throughput screen. Cell Stem Cell. 2013;12:167–179. - PubMed
    1. Berger C., Flowers M.E., Warren E.H., Riddell S.R. Analysis of transgene-specific immune responses that limit the in vivo persistence of adoptively transferred HSV-TK-modified donor T cells after allogeneic hematopoietic cell transplantation. Blood. 2006;107:2294–2302. - PMC - PubMed
    1. Boch J., Bonas U. Xanthomonas AvrBs3 family-type III effectors: discovery and function. Annu. Rev. Phytopathol. 2010;48:419–436. - PubMed

Publication types