. 2015 Sep 3;59(5):744-54.
doi: 10.1016/j.molcel.2015.07.018. Epub 2015 Aug 27.

Codon Usage Influences the Local Rate of Translation Elongation to Regulate Co-translational Protein Folding

Affiliations

Codon Usage Influences the Local Rate of Translation Elongation to Regulate Co-translational Protein Folding

Chien-Hung Yu et al. Mol Cell. .

Abstract

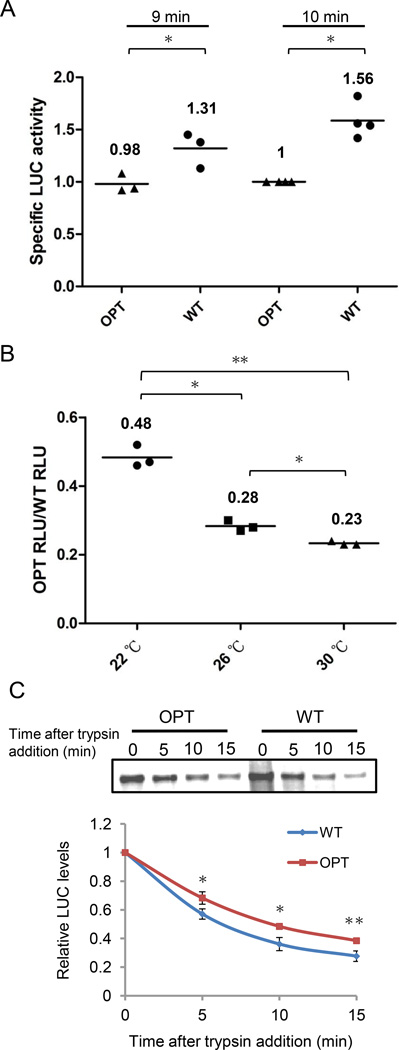
Codon usage bias is a universal feature of eukaryotic and prokaryotic genomes and has been proposed to regulate translation efficiency, accuracy, and protein folding based on the assumption that codon usage affects translation dynamics. The roles of codon usage in translation, however, are not clear and have been challenged by recent ribosome profiling studies. Here we used a Neurospora cell-free translation system to directly monitor the velocity of mRNA translation. We demonstrated that the preferred codons enhance the rate of translation elongation, whereas non-optimal codons slow elongation. Codon usage also controls ribosome traffic on mRNA. These conclusions were supported by ribosome profiling results in vitro and in vivo with template mRNAs designed to increase the signal-to-noise ratio. Finally, we demonstrate that codon usage regulates protein function by affecting co-translational protein folding. These results resolve a long-standing fundamental question and suggest the existence of a codon usage code for protein folding.


Conflict of interest statement

All authors declare that there is no financial conflict of interest that might be construed to influence the results or interpretation of our manuscript.

Figures

Figure 1
Figure 1. Codon usage affects translation elongation rate
(A) Real-time measurement of firefly luciferase (Luc) activity using Neurospora cell-free translation system at 26 °C. Recorded relative light units (RLU) were plotted versus translation reaction time in 30 seconds intervals. Time of first appearances (TFAs) are indicated by arrows. Data are represented as mean +/− standard deviations. (B) SDS-PAGE analysis showing the [35S]methionine-labeled translational products from WT and OPT Luc mRNAs obtained from micrococcal nuclease-treated Neurospora cell-free lysates. NC is background translation (without added mRNA). The arrow indicates the position of full-length LUC. (C and D) The Scatter plots show the effect of codon usage frequency on elongation speed by comparison the TFA of the indicated Luc mRNAs. In (C), N-OP-WT and M-OP-WT have codons corresponding to amino acids 2–223 and 224–423 optimized, respectively. In (D), N-WT-OPT and M-WT-OPT have codons corresponding to amino acids 2–223 and 224–423 as WT sequences, respectively. *P < 0.05, **P < 0.01. (E) Plot shows the real-time LUC activity of FRQ-WT Luc fusion proteins. The TFA of each construct is indicated by an arrow. Means indicated by horizontal bars for all measurements were derived from four to ten independent experiments. Data are represented as mean +/− standard deviations. See also Figure S1.
Figure 2
Figure 2. Elongation rate is affected by codon usage frequency rather than by codon-tRNA balance or mRNA secondary structures
(A) Scatter plot shows the TFA of WT and OPT Luc using Neurospora cell-free lysates at different temperatures. (B) Scatter plot shows the TFA of WT and OPT Luc in micrococcal nuclease-treated and untreated Neurospora cell-free lysates. (C) Scatter plot shows the TFAs of programmed translation reactions using micrococcal-nuclease-treated Neurospora lysates with indicated concentrations of WT and OPT Luc mRNAs. (D) Plot shows the real-time Luc activity of WT and OPT mRNAs using nuclease-treated yeast cell-free extracts. The TFAs are indicated by arrows. Means are indicated by horizontal bars and were derived from three to six independent experiments. Data are represented as mean +/− standard deviations.
Figure 3
Figure 3. Codon usage affects local ribosome traffic on mRNA
(A) SDS-PAGE analysis of [35S]methionine-labeled total translation products and isolated RNCs of WT and OPT Luc after 12 min of translation reaction. The reaction was terminated by cycloheximide (0.5 mg/ml, final concentration). (B) SDS-PAGE analysis of [35S]methionine-labeled translation products of WT and OPT Luc after 12 min at indicated temperatures. The full-length Luc protein is indicated by an arrow. (C) SDS-PAGE analysis of [35S]methionine-labeled translation products of the indicated Luc mRNAs. The colored bar on the left of each lane demonstrates the codon usage patterns of the Luc gene: red indicates optimized codons; blue indicates wild-type codons.
Figure 4
Figure 4. Ribosome profiling analyses reveals that ribosome occupancy on mRNA negatively correlates with codon usage frequency in vitro and in vivo
(A) RPF profile on Luc mRNAs translated in vitro. The sequenced RPFs of indicated Luc constructs from Neurospora in vitro translation are mapped to the corresponding mRNAs. The average CAI values of each gene fragment are indicated. (B) RPF profile on Luc mRNAs translated in vivo. The RPFs of indicated ccg-1-driven Luc constructs, which are transformed into his-3 locus of Neurospora genome, were mapped to the corresponding Luc gene. See also Figure S2.
Figure 5
Figure 5. Genome-wide negative correlations between RPFs and synonymous codon usage in vivo
A scatter plot shows the negative correlation between the relative codon decoding rate (RCDR) and relative codon usage frequency (RCUF) for all coding genes. Spearman's rank correlation coefficient (ρ) and the associated P value are indicated.
Figure 6
Figure 6. Codon usage regulates protein activity by affecting co-translational protein folding
(A) Scatter plot shows the comparison of WT and OPT LUC specific activities in Neurospora cell-free lysate. (B) Scatter plot shows the ratio of relative LUC activity between OPT to the WT mRNA after 12 min of in vitro translation at indicated temperatures. (C) Top panel: SDS-PAGE analysis shows the levels of WT and OPT LUC at the indicated time points after the addition of trypsin (20 µg/ml). Lower panel: Densitometric analyses of LUC levels from four independent experiments. Means are indicated by horizontal bars and were derived from three to four independent experiments. *P < 0.05, **P < 0.01.
Figure 7
Figure 7. Codon usage in a defined structural region affects LUC activity in vitro and in vivo
(A) Top panel: Diagrams shows the codon-optimized region (red) of each WT-based Luc construct. Bottom panel: The relative specific LUC activities of in vitro translated indicated Luc mRNAs are shown by scatter plot. (B) Top panel: Diagrams indicate the regions in which codons are WT sequence (blue) in otherwise OPT Luc constructs. Bottom panel: Scatter plot shows the comparison of the specific Luc activities of in vitro translated Luc mRNAs. (C) Top panel: Diagrams show the regions in which codons are optimized (Red) in the WT Luc. Bottom panel: The relative specific Luc activities of indicated Luc constructs. Means are indicated by horizontal bars and were derived from three to five independent experiments. (D) Scatter plot shows the comparison of LUC specific activity in vivo. The frq promoter-driven OPT Luc and (172–223)WT-Luc were transformed into Neurospora at the his-3 locus. The 24-hr germinating conidia were harvested followed by LUC activity (RLU) measurement and LUC protein quantification by western blot. The RLU and LUC protein levels were normalized to the value of one of the OPT samples. The specific Luc activities were calculated by dividing the normalized RLU by normalized Luc protein level. *P < 0.05, **P < 0.01. See also Figure S3.

Comment in

  • Synthesis at the Speed of Codons.
    Koutmou KS, Radhakrishnan A, Green R. Koutmou KS, et al. Trends Biochem Sci. 2015 Dec;40(12):717-718. doi: 10.1016/j.tibs.2015.10.005. Epub 2015 Oct 31. Trends Biochem Sci. 2015. PMID: 26526516

References

    1. Akashi H. Synonymous codon usage in Drosophila melanogaster: natural selection and translational accuracy. Genetics. 1994;136:927–935. - PMC - PubMed
    1. Artieri CG, Fraser HB. Accounting for biases in riboprofiling data indicates a major role for proline in stalling translation. Genome Res. 2014;24:2011–2021. - PMC - PubMed
    1. Bonekamp F, Dalboge H, Christensen T, Jensen KF. Translation rates of individual codons are not correlated with tRNA abundances or with frequencies of utilization in Escherichia coli. J Bacteriol. 1989;171:5812–5816. - PMC - PubMed
    1. Bull JJ, Molineux IJ, Wilke CO. Slow fitness recovery in a codon-modified viral genome. Mol Biol Evol. 2012;29:2997–3004. - PMC - PubMed
    1. Charneski CA, Hurst LD. Positively charged residues are the major determinants of ribosomal velocity. PLoS biology. 2013;11:e1001508. - PMC - PubMed

Publication types

MeSH terms

Associated data