. 2015 Sep 8;12(10):1575-83.
doi: 10.1016/j.celrep.2015.08.003. Epub 2015 Aug 28.

Multiple Retinal Axons Converge onto Relay Cells in the Adult Mouse Thalamus

Affiliations

Multiple Retinal Axons Converge onto Relay Cells in the Adult Mouse Thalamus

Sarah Hammer et al. Cell Rep. .

Abstract

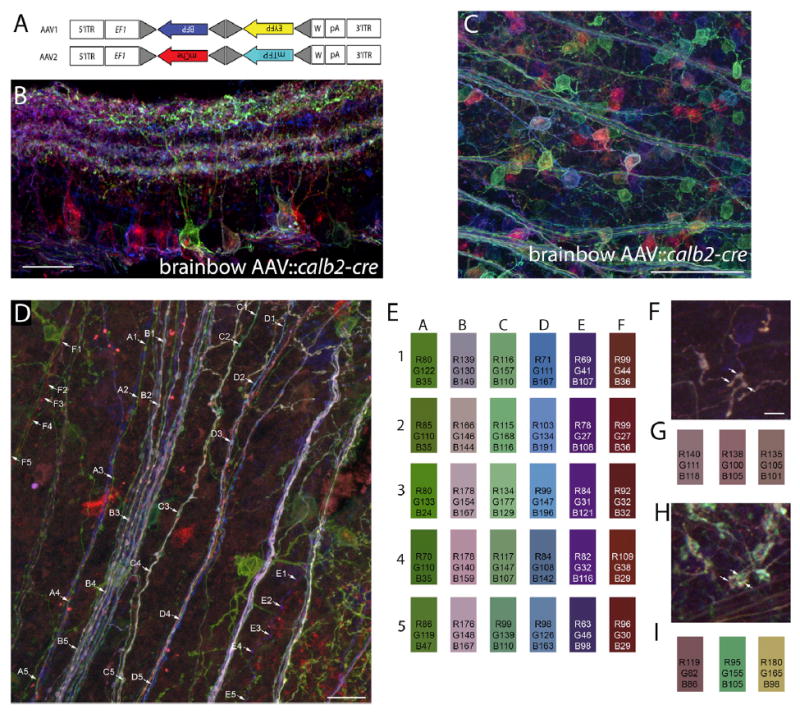
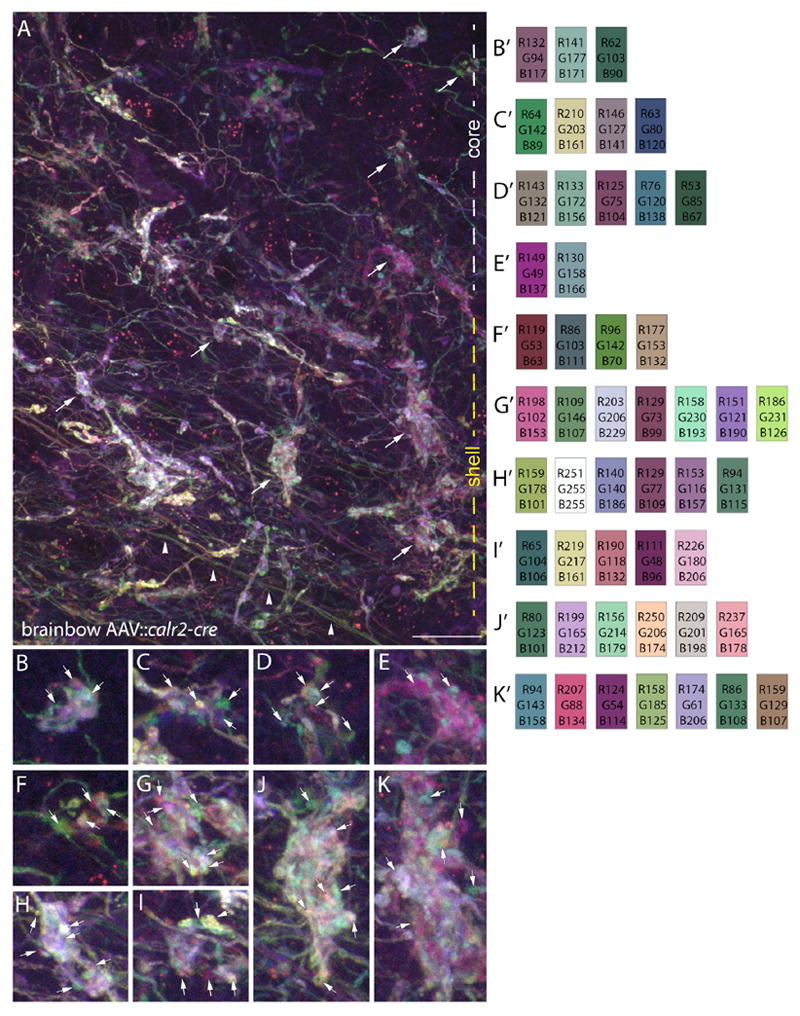
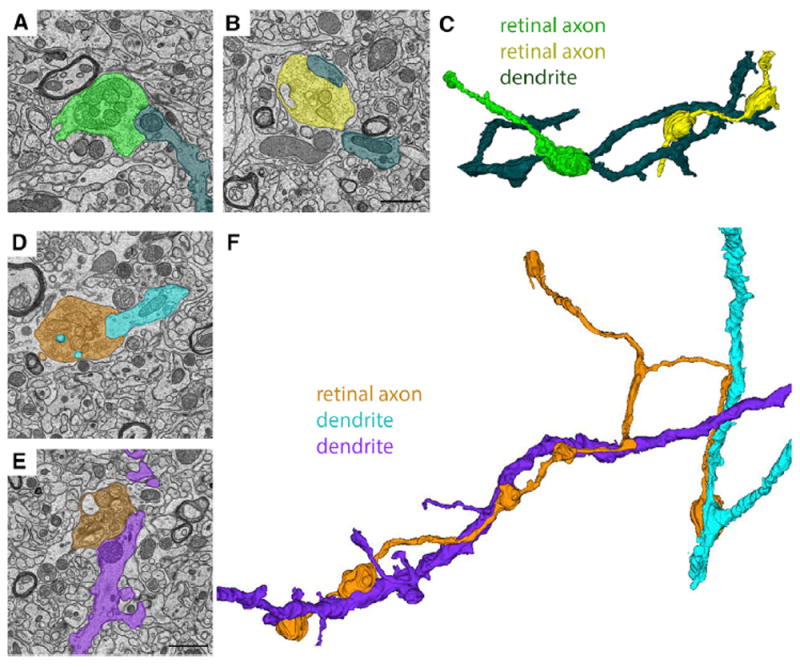
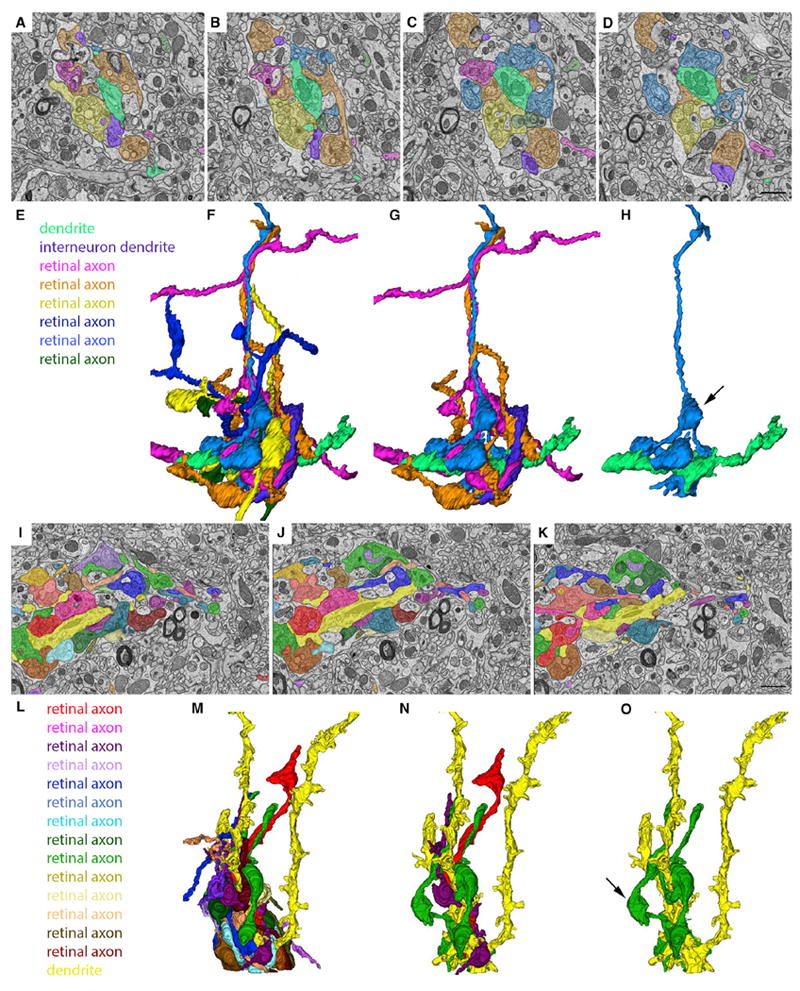
Activity-dependent refinement of neural circuits is a fundamental principle of neural development. This process has been well studied at retinogeniculate synapses-synapses that form between retinal ganglion cells (RGCs) and relay cells within the dorsal lateral geniculate nucleus. Physiological studies suggest that shortly after birth, inputs from ∼20 RGCs converge onto relay cells. Subsequently, all but just one to two of these inputs are eliminated. Despite widespread acceptance, this notion is at odds with ultrastructural studies showing numerous retinal terminals clustering onto relay cell dendrites in the adult. Here, we explored this discrepancy using brainbow AAVs and serial block face scanning electron microscopy (SBFSEM). Results with both approaches demonstrate that terminals from numerous RGCs cluster onto relay cell dendrites, challenging the notion that only one to two RGCs innervate each relay cell. These findings force us to re-evaluate our understanding of subcortical visual circuitry.


Figures

Figure 1
Figure 1. Labeling of RGCs and Retinal Axons with Brainbow AAVs
(A) Schematic representing the constructs of each of the two brainbow AAVs used in these studies. Following Cre recombination, these two constructs generate either farnesylated Tag-blue fluorescent protein (BFP) or enhanced yellow fluorescent protein (EYFP), or monomeric Cherry fluorescent protein (mChe) or monomeric teal fluorescent protein (mTFP). EF1 represent regulatory elements from the elongation 1α gene and W represents elements from the woodchuck hepatitis virus posttranscriptional regulatory element. Lox site mutants are depicted with gray triangles. For additional details, see Cai et al. (2013). (B) Confocal image of a P35 retinal cross-section following intraocular injection of brainbow AAV into calb2-cre mice. Note the ability to delineate the dendritic arbor of the green-labeled RGC from adjacent fluorescently labeled RGCs. (C) Confocal image of a P35 retinal whole mount following intraocular injection of brainbow AAV into calb2-cre mice. (D) Confocal image of differentially labeled RGC axons in a P35 retinal whole-mount brainbow AAV∷calb2-cre mouse. (E) Color analysis at five locations (1–5) along the six axons labeled in (D) (labeled A–F). The color boxes represent the colors at each point highlighted along the axons. Numbers in the boxes represent the red (R), green (G), and blue (B) color intensity values at each point along the axons. Note the relative similar distribution of “color” along each axon. (F and G) A single retinal axon labeled with brainbow AAVs in the “core” region of dLGN of a P35 calb2-cre mouse. (G) Color analysis for the three boutons highlighted by arrows in (F). (H and I) Terminals from three distinct retinal axons converging at a single cluster following labeling with brainbow AAVs in the “core” region of dLGN of a P35 calb2-cre mouse. (I) Color analysis for the three boutons highlighted in (H). Scale bar in (B), 50 μm, in (D), 50 μm, in (C), 100 μm and in (F), 6 μm for (F) and (H).
Figure 2
Figure 2. Clusters of Retinal Terminals in dLGN Contain Boutons from Multiple Retinal Axons
(A) Maximum projection, confocal image of retinal axons, and terminals labeled with brainbow AAVs in the “core” and “shell” region of dLGN of P35 calb2-cre mice. White and yellow dashed lines on the right indicate the “core” and “shell” regions of dLGN in this image. Arrowheads highlight retinal axons traversing this region of dLGN. (B–K) High-magnification images of the retinal boutons indicated by arrows in (A). B′–K′ show color analysis for terminals highlighted with arrowheads in (B)–(K). Scale bar in (A), 20 μm for (A) and 7 μm for (B)–(K).
Figure 3
Figure 3. Ultrastructural Analysis and Reconstruction of Retinal Axons Contributing to “Simple Encapsulated” Retinogeniculate Synapses in dLGN
(A and B) SBFSEM images of two retinal terminals synapsing onto the same relay cell dendrite in the “shell” region of dLGN. (C) 3D reconstruction of the two RGC terminal boutons from (A) and (B) converging on a single relay cell dendrite. (D and E) SBFSEM images of two retinal terminals from the same RGC axon making synaptic contact with two distinct relay cell dendrites in the “shell” region of dLGN. (F) 3D reconstruction of the retinal axon and relay cell dendrites from (D) and (E). Scale bar in (B), 1.5 μm for (A) and (B), and in (E), 1.5 μm for (D) and (E).
Figure 4
Figure 4. Ultrastructural Analysis and Reconstruction of Retinal Axons Contributing to “Complex Encapsulated” Retinogeniculate Synapses in dLGN
(A–D) SBFSEM images of six retinal terminals synapsing onto the same relay cell dendrite (pseudo-colored in bright green) in the “shell” region of dLGN. (E) Key indicates the types of cellular elements pseudo-colored in (A)–(D) and (F)–(H). (F) 3D reconstruction of all of the elements pseudo-colored in (A)–(D). (G) 3D reconstruction of three RGC axons, an inhibitory interneuron dendrite and the relay cell dendrite in (A)–(D). (H) 3D reconstruction of a single RGC axon and the relay cell dendrite in (A)–(D). Arrow indicates a retinal bouton that makes synaptic contact with an element other than the relay cell dendrite pseudo-colored bright green. (I–K) SBFSEM images of 14 retinal terminals synapsing onto the same relay cell dendrite (pseudo-colored in bright yellow). (L) Key indicates the types of cellular elements pseudo-colored in (I)–(K) and (M)–(O). (M) 3D reconstruction of all of the elements pseudo-colored in (I)–(K). (N) 3D reconstruction of three RGC axons and the relay cell dendrite in (I)–(K). (O) 3D reconstruction of a single RGC axon and the relay cell dendrite in (I)–(K). Arrow indicates a retinal bouton that makes synaptic contact with an element other than the relay cell dendrite pseudo-colored bright yellow. Scale bar in (D), 1.5 μm for (A)–(D), and in (K), 1.5 μm for (I)–(K).

References

    1. Bickford ME, Slusarczyk A, Dilger EK, Krahe TE, Kucuk C, Guido W. Synaptic development of the mouse dorsal lateral geniculate nucleus. J Comp Neurol. 2010;518:622–635. - PMC - PubMed
    1. Budisantoso T, Matsui K, Kamasawa N, Fukazawa Y, Shigemoto R. Mechanisms underlying signal filtering at a multisynapse contact. J Neurosci. 2012;32:2357–2376. - PMC - PubMed
    1. Cai D, Cohen KB, Luo T, Lichtman JW, Sanes JR. Improved tools for the Brainbow toolbox. Nat Methods. 2013;10:540–547. - PubMed
    1. Cardona A, Saalfeld S, Schindelin J, Arganda-Carreras I, Preibisch S, Longair M, Tomancak P, Hartenstein V, Douglas RJ. TrakEM2 software for neural circuit reconstruction. PLoS ONE. 2012;7:e38011. - PMC - PubMed
    1. Chen C, Regehr WG. Developmental remodeling of the retinogeniculate synapse. Neuron. 2000;28:955–966. - PubMed

Publication types

LinkOut - more resources