. 2015 Oct 6;22(4):658-68.
doi: 10.1016/j.cmet.2015.07.026. Epub 2015 Aug 27.

Crosstalk between Gut Microbiota and Dietary Lipids Aggravates WAT Inflammation through TLR Signaling

Affiliations

Crosstalk between Gut Microbiota and Dietary Lipids Aggravates WAT Inflammation through TLR Signaling

Robert Caesar et al. Cell Metab. .

Abstract

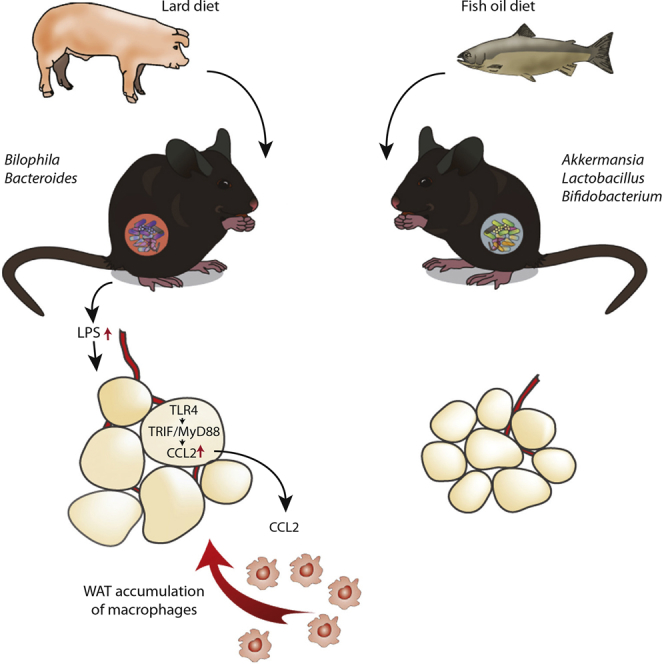
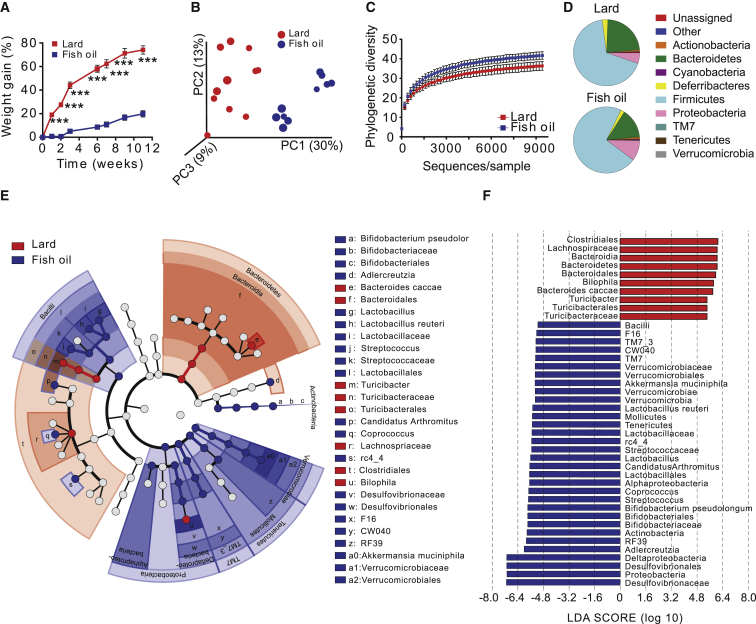
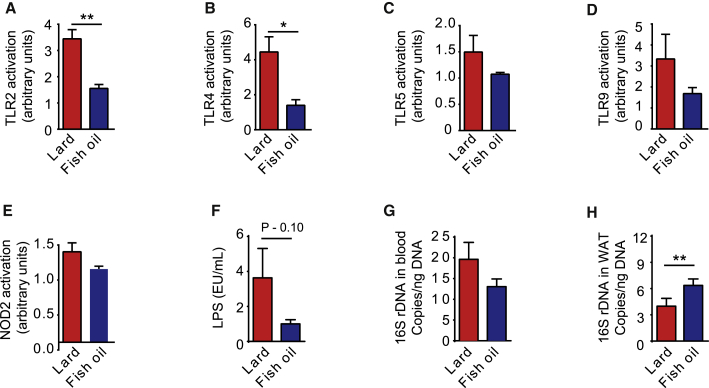
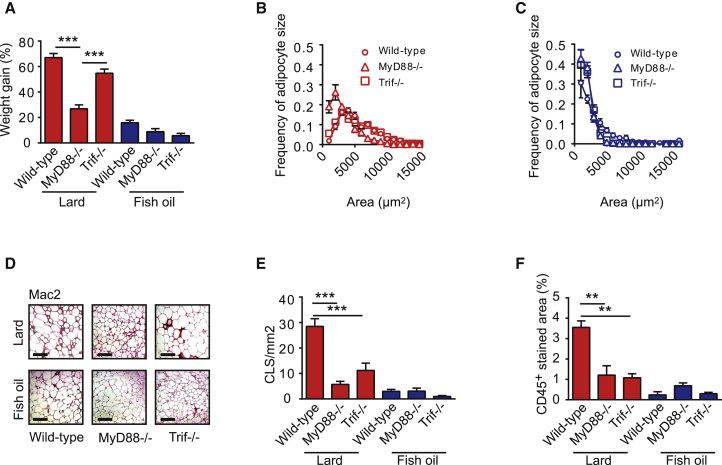
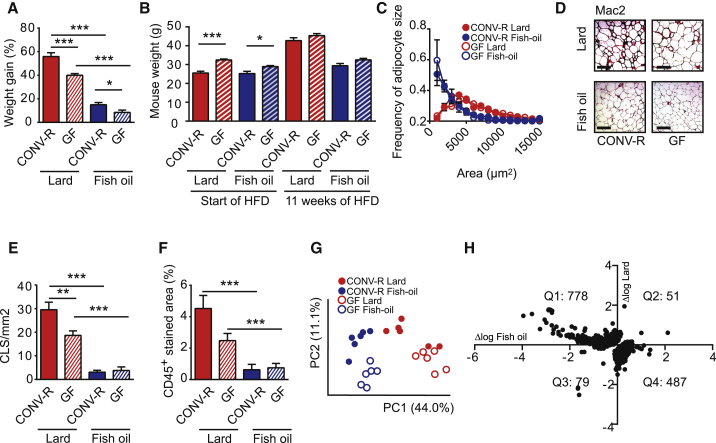
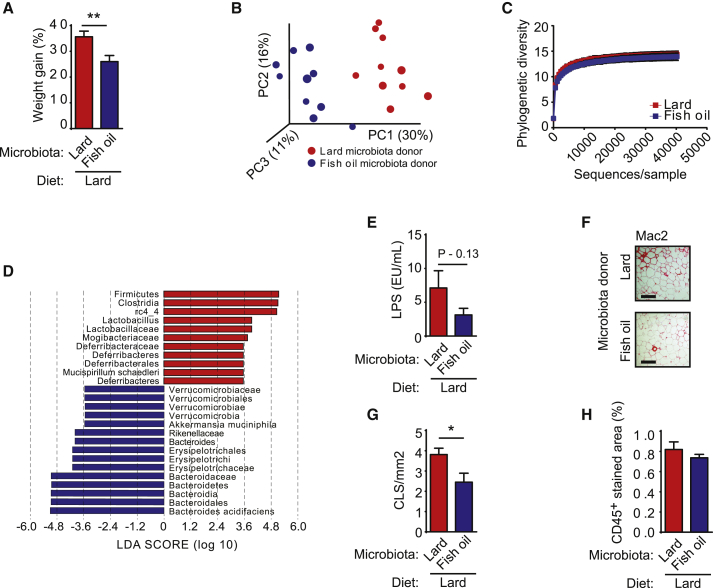
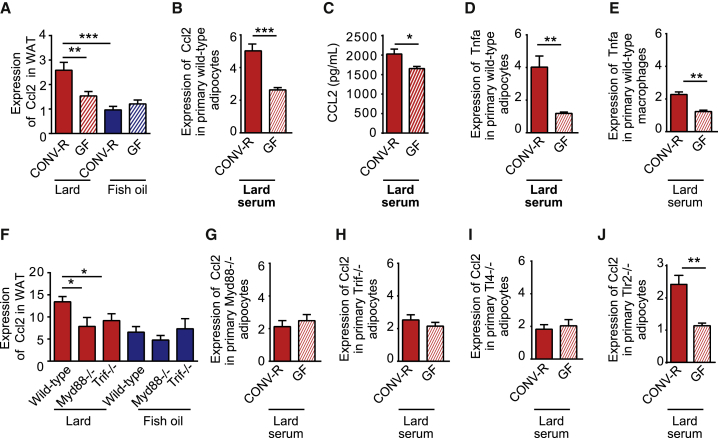
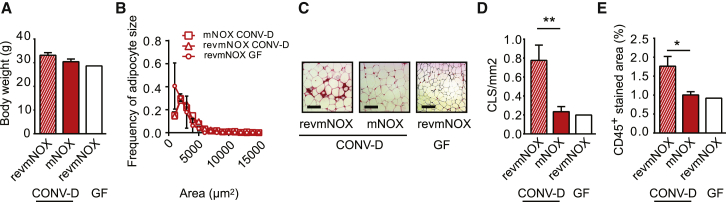
Dietary lipids may influence the abundance of circulating inflammatory microbial factors. Hence, inflammation in white adipose tissue (WAT) induced by dietary lipids may be partly dependent on their interaction with the gut microbiota. Here, we show that mice fed lard for 11 weeks have increased Toll-like receptor (TLR) activation and WAT inflammation and reduced insulin sensitivity compared with mice fed fish oil and that phenotypic differences between the dietary groups can be partly attributed to differences in microbiota composition. Trif(-/-) and Myd88(-/-) mice are protected against lard-induced WAT inflammation and impaired insulin sensitivity. Experiments in germ-free mice show that an interaction between gut microbiota and saturated lipids promotes WAT inflammation independent of adiposity. Finally, we demonstrate that the chemokine CCL2 contributes to microbiota-induced WAT inflammation in lard-fed mice. These results indicate that gut microbiota exacerbates metabolic inflammation through TLR signaling upon challenge with a diet rich in saturated lipids.


Figures

None
Graphical abstract
Figure 1
Figure 1
Mice Fed a Lard Diet Have Increased Adiposity and Distinct Gut Microbiota Composition Compared to Mice Fed an Isocaloric Fish-Oil Diet Mice were fed high-fat diets for 11 weeks. (A) Body weight gain of mice fed lard or fish oil (n = 15). Data indicate means ± SEM. ∗∗∗p < 0.001. (B) Principal coordinate analysis of gut microbiota composition based on unweighted UniFrac in mice fed lard or fish oil (n = 10–11 mice per group). (C) Rarefaction curves for phylogenetic diversity in microbiota from mice fed lard or fish oil (10–9,410 sequences per sample). Data indicate means ± SD. (D) Pie charts of gut microbial phyla composition in mice fed lard or fish oil for 11 weeks (n = 9–10 mice per group) (see Table S2 for the list of differentially abundant taxa grouped at the phylum and genus level). (E) Cladogram generated from LEfSe analysis, showing the most differentially abundant taxa enriched in microbiota from mice fed lard (red) or fish oil (blue). (F) LDA scores of the differentially abundant taxa shown in (E). Taxa enriched in microbiota from mice fed lard (red) or fish oil (blue) are indicated with a positive or negative LDA score, respectively (taxa with LDA score >2 and significance of α < 0.05 determined by Wilcoxon signed-rank test). See also Table S2.
Figure 2
Figure 2
Presence of TLR Ligands, LPS, and Bacterial DNA in Blood and Bacterial DNA in WAT of Mice Fed Lard and Fish Oil (A–E) Activation of innate immunity receptors induced by stimulation with serum isolated from CONV-R mice fed lard or fish oil for 11 weeks (n = 3). (F) Concentrations of LPS in serum isolated from CONV-R mice fed lard or fish oil for 11 weeks (n = 11–13 mice per group). (G) Levels of 16S rDNA in blood from CONV-R mice fed lard or fish oil for 11 weeks (n = 15 mice per group). (H) Levels of 16S rDNA in WAT from CONV-R mice fed lard or fish oil for 11 weeks (n = 15 mice per group). Mean values ± SEM are plotted. p < 0.05; ∗∗p < 0.01.
Figure 3
Figure 3
Mice Lacking MyD88 or TRIF Are Protected against Lard-Diet-Induced WAT Inflammation (A) Body weight gain of wild-type, Myd88−/−, and Trif−/− mice fed lard or fish oil for 11 weeks. ns = 23 (wild-type lard), 7 (Myd88−/− lard), 8 (Trif−/− lard), 22 (wild-type fish oil), 6 (Myd88−/− fish oil), and 9 (Trif−/− fish oil). (B) Distribution of adipocyte sizes in wild-type, Myd88−/− and Trif−/− mice fed lard (n = 4–6 mice per group). (C) Distribution of adipocyte sizes in wild-type, Myd88−/−, and Trif−/− mice fed fish oil. n = 8 for wild-type, and n = 4 for Myd88−/− and Trif−/−. (D) Representative Mac-2 immunostaining of WAT from wild-type, Myd88−/−, and Trif−/− mice fed lard or fish oil. Scale bars, 100 μm. (E) Quantification of CLS. ns = 7 (wild-type lard), 7 (Myd88−/− lard), 5 (Trif−/− lard), 7 (wild-type fish oil), 5 (Myd88−/− fish oil), and 4 (Trif−/− fish oil). (F) Percentage of area occupied by CD45+ cells in WAT of wild-type, Myd88−/−, and Trif−/− mice. ns = 7 (wild-type lard), 7 (Myd88−/− lard), 5 (Trif−/− lard), 3 (wild-type fish-oil), 4 (Myd88−/− fish oil), and 4 (Trif−/− fish oil). Mean values ± SEM are plotted. ∗∗p < 0.01; ∗∗∗p < 0.001.
Figure 4
Figure 4
Gut Microbiota and Dietary Lipid Interact to Regulate WAT Inflammation Independent of Body Weight and Adipocyte Size (A) Body weight gain of CONV-R and GF mice fed lard or fish oil for 11 weeks. ns = 34 (CONV-R lard), 19 (GF lard), 34 (CONV-R fish oil), and 18 (GF fish oil). (B) Initial and final body weight of mice used for analysis of WAT inflammation (n = 6). (C) Distribution of adipocyte sizes in mice used for analysis of inflammation and metabolic perturbations. ns = 4 (CONV-R lard), 5 (GF lard), 6 (CONV-R fish oil), and 6 (GF fish oil). (D) Representative Mac-2 immunostaining of WAT from CONV-R and GF mice fed lard or fish oil. Scale bars, 100 μm. (E) Quantification of CLS (n = 6 mice per group). (F) Percentage of area occupied by CD45+ cells in WAT from CONV-R and GF mice fed lard or fish oil (n = 5–6 mice per group). (G) Principal-component analysis of global gene expression in WAT from CONV-R and GF mice fed lard or fish oil (n = 6 mice per group). (H) Genes that are regulated by the interaction between diet and gut microbiota. WAT genes induced by the gut microbiota in mice fed lard are plotted on the y axis, and WAT genes induced by the gut microbiota in mice fed fish oil are plotted on the x axis (n = 6 mice per group). Interaction was determined by two-way ANOVA. Means ± SEM are plotted. p < 0.05; ∗∗p < 0.01; ∗∗∗p < 0.001.
Figure 5
Figure 5
Gut Microbiota Transplanted from Donor Mice Fed a Fish-Oil Diet Counteract Lard-Diet-Induced Adiposity and WAT Inflammation Mice colonized with gut microbiota from donor mice were fed either a lard or a fish-oil diet for 11 weeks and fed a lard diet for 3 weeks. (A) Body weight gain (n = 10 mice per group). (B and C) Indicated here are the (B) principal coordinate analysis of gut microbiota composition based on unweighted UniFrac and (C) rarefaction curves (10–40,610 sequences per sample) for phylogenetic diversity in microbiota (n = 10). (D) LDA scores of the differentially abundant taxa in blood. Taxa enriched in microbiota from mice fed lard (red) or fish oil (blue) are indicated with a positive or negative LDA score, respectively (taxa with LDA score >2 and a significance of α < 0.05 determined by Wilcoxon signed-rank test are shown). (E) Concentrations of LPS in serum (n = 8–10 mice per group). (F) Representative Mac-2 immunostaining of WAT. Scale bars, 100 μm. (G) Quantification of CLS (n = 10 mice per group). (H) Percentage of area occupied by CD45+ cells (n = 10 mice per group). Mean values ± SEM are plotted. p < 0.05; ∗∗p < 0.01.
Figure 6
Figure 6
CCL2 Production in WAT Is Induced by the Gut Microbiota through Activation of MyD88, TRIF, and TLR4 (A) Expression of Ccl2 in WAT from CONV-R and GF mice fed lard or fish oil for 11 weeks (n = 6). (B) Expression of Ccl2 in primary adipocytes stimulated for 4 hr with 2% serum from the vena cava of CONV-R or GF mice fed lard (n = 5–6 mice per group). (C) Secretion of CCL2 from primary wild-type primary adipocytes stimulated for 4 hr with 2% serum isolated from the vena cava of CONV-R and GF mice fed lard (n = 5–6). (D and E) Expression of Tnfα in primary (D) adipocytes and (E) macrophages stimulated for 4 hr with 2% serum isolated from the vena cava of CONV-R and GF mice fed lard (n = 5–6). (F) Expression of Ccl2 in WAT from CONV-R wild-type, Myd88−/−, and Trif−/− mice fed lard or fish oil for 11 weeks. ns = 6 (wild-type lard), 6 (Myd88−/− lard), and 4 (Trif−/− lard). (G–J) Expression of Ccl2 in (G) Myd88−/−, (H) Trif−/−, (I) Tlr4−/−, and (J) Tlr2−/− primary adipocytes stimulated for 4 hr with 2% serum isolated from the vena cava of CONV-R or GF mice fed lard (n = 5–6). Mean values ± SEM are plotted. p < 0.05; ∗∗p < 0.01; ∗∗∗p < 0.001.
Figure 7
Figure 7
CCL2 Mediates WAT Inflammation (A and B) Indicated here are the (A) body weight and (B) distribution of adipocyte size in WAT from CONV-D mice fed lard for 28 days and treated with either revmNOX or mNOX and from GF mice fed lard for 28 days and treated with revmNOX. n = 8 (CONV-D revmNOX and CONV-D mNOX), and n = 2 (GF revmNOX). (C) Representative Mac-2 immunostaining of WAT from CONV-D mice fed lard and treated with either revmNOX or mNOX and from GF mice fed lard and treated with revmNOX. Scale bars, 100 μm. (D and E) Indicated here are the (D) quantification of CLS and (E) percentage of area occupied by CD45+ cells in WAT from CONV-D mice fed lard and treated with either revmNOX or mNOX and from GF mice fed lard and treated with revmNOX. n = 8 (CONV-D revmNOX and CONV-D mNOX), and n = 2 (GF revmNOX). Mean values ± SEM are plotted; p < 0.05; ∗∗p < 0.01.

References

    1. Amano S.U., Cohen J.L., Vangala P., Tencerova M., Nicoloro S.M., Yawe J.C., Shen Y., Czech M.P., Aouadi M. Local proliferation of macrophages contributes to obesity-associated adipose tissue inflammation. Cell Metab. 2014;19:162–171. - PMC - PubMed
    1. Amar J., Chabo C., Waget A., Klopp P., Vachoux C., Bermúdez-Humarán L.G., Smirnova N., Bergé M., Sulpice T., Lahtinen S. Intestinal mucosal adherence and translocation of commensal bacteria at the early onset of type 2 diabetes: molecular mechanisms and probiotic treatment. EMBO Mol. Med. 2011;3:559–572. - PMC - PubMed
    1. Bäckhed F., Manchester J.K., Semenkovich C.F., Gordon J.I. Mechanisms underlying the resistance to diet-induced obesity in germ-free mice. Proc. Natl. Acad. Sci. USA. 2007;104:979–984. - PMC - PubMed
    1. Baeck C., Wehr A., Karlmark K.R., Heymann F., Vucur M., Gassler N., Huss S., Klussmann S., Eulberg D., Luedde T. Pharmacological inhibition of the chemokine CCL2 (MCP-1) diminishes liver macrophage infiltration and steatohepatitis in chronic hepatic injury. Gut. 2012;61:416–426. - PubMed
    1. Björkbacka H., Kunjathoor V.V., Moore K.J., Koehn S., Ordija C.M., Lee M.A., Means T., Halmen K., Luster A.D., Golenbock D.T., Freeman M.W. Reduced atherosclerosis in MyD88-null mice links elevated serum cholesterol levels to activation of innate immunity signaling pathways. Nat. Med. 2004;10:416–421. - PubMed

Publication types

MeSH terms

Associated data