. 2015 Oct 6;22(4):619-32.
doi: 10.1016/j.cmet.2015.07.025. Epub 2015 Aug 27.

Aging-Dependent Demethylation of Regulatory Elements Correlates with Chromatin State and Improved β Cell Function

Affiliations

Aging-Dependent Demethylation of Regulatory Elements Correlates with Chromatin State and Improved β Cell Function

Dana Avrahami et al. Cell Metab. .

Abstract

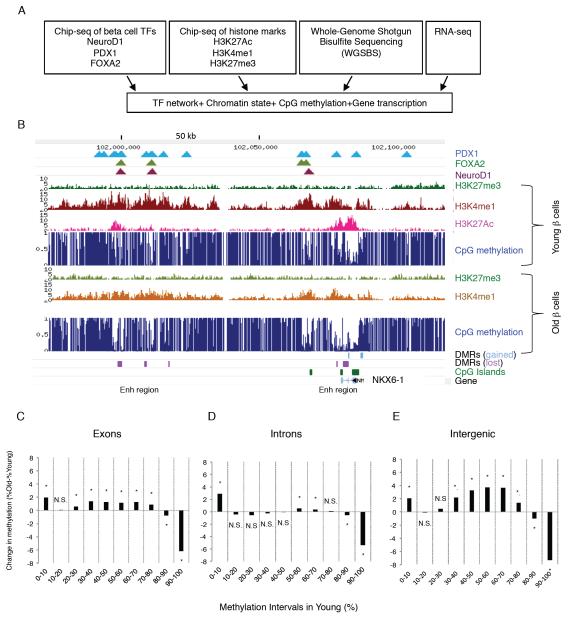
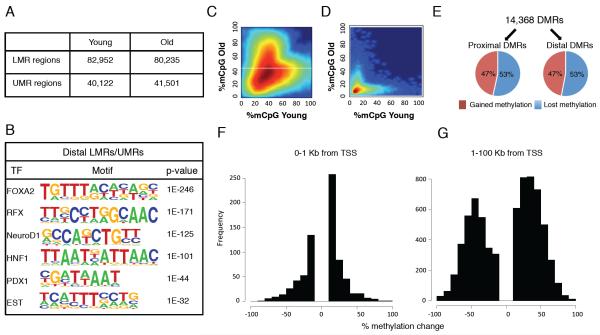
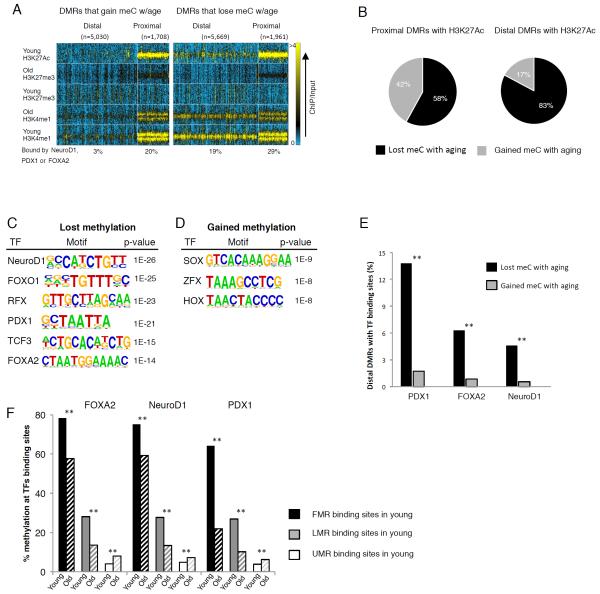
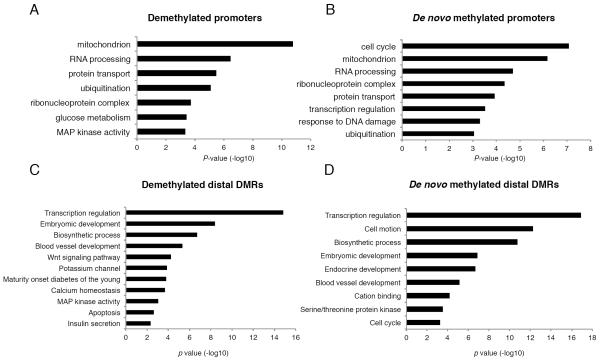
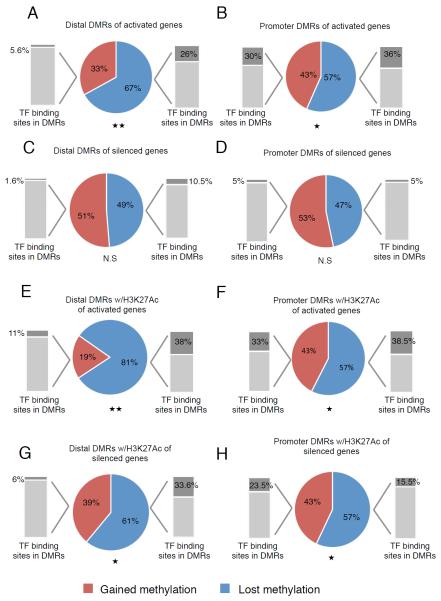
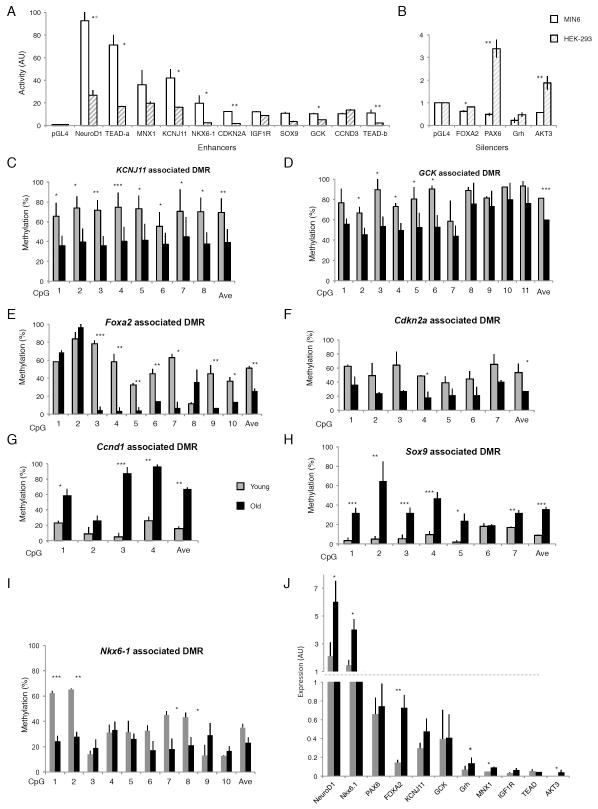
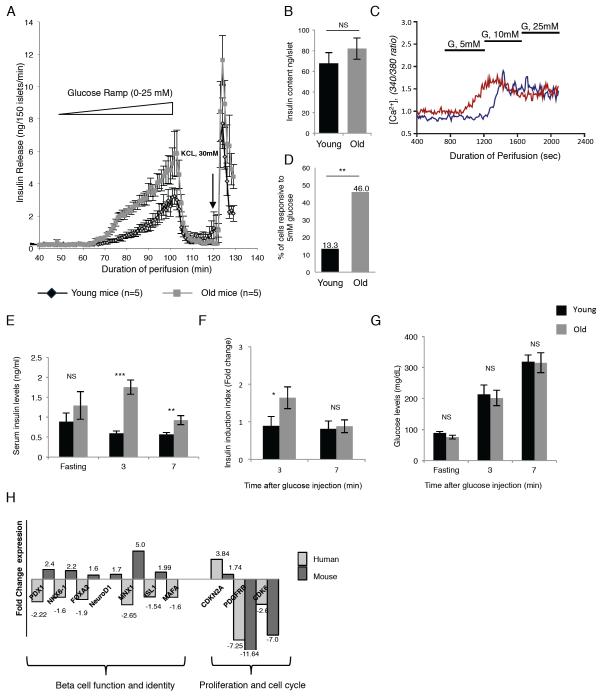
Aging is driven by changes of the epigenetic state that are only partially understood. We performed a comprehensive epigenomic analysis of the pancreatic β cell, key player in glucose homeostasis, in adolescent and very old mice. We observe a global methylation drift resulting in an overall more leveled methylome in old β cells. Importantly, we discover targeted changes in the methylation status of β cell proliferation and function genes that go against the global methylation drift, are specific to β cells, and correlate with repression of the proliferation program and activation of metabolic regulators. These targeted alterations are associated with specific chromatin marks and transcription factor occupancy in young β cells. Strikingly, we find β cell function improved in aged mice, as predicted by the changes in methylome and transcriptome. Thus, aging of terminally differentiated cells in mammals is not always coupled to functional decline.


Figures

Figure 1
Figure 1. Integrative epigenomic analysis of pancreatic β cells aging
(A) Outline of experimental paradigm. Our analysis integrated chromatin state marks, base-resolution methylation profiles and gene transcription in young (4-6 weeks old) and old (16-20 months old) mouse β cells with maps of key β cell transcription factors. (B) Map of the Nkx6.1 locus as an example of our integrated epigenomic map. Differentially methylated regions (DMRs) were identified between the two developmental states as described in the text. Note the multiple areas with lower DNA methylation in old β cells as indicated by the magenta boxes. (C-E) Global changes in methylation levels with aging by genomic region. Methylation states in young β cells were subdivided into bins by degree of methylation, and then the change in methylation levels of the same regions in old β cells were calculated. Note that, regardless of genomic context, regions with very high methylation in young β cells lose methylation with age, while other genomic regions gain methylation. Only CpGs pairs with a minimal read coverage of 11 in both young and old β cell methylomes were included in the analysis and combined into regions. (C) Exons, 23,048 regions, (D) introns, 21,000 regions (E) Intergenic, 21,243 regions. * p < 0.01. See also Figure S1.
Figure 2
Figure 2. DNA methylation is dynamic during β cells aging
(A) Number of genomic regions with low methylation (LMR, between 13.9% and 50% methylation) and unmethylated (UMR, between 0 and 13.9% methylation) regions in β cells isolated from prepubescent (4-6 weeks old) and post-fertile age (16-20 months old) mice. (B) Distal (more than 1 kb from the nearest transcriptional start site) LMRs and UMRs of β cells are highly enriched for the recognition motifs of key β cell transcription factors (HOMER (Heinz et al., 2010)). (C,D) Heatmap of LMRs (C) and UMRs (D) from young and old β cells. Intensity of the color reflects the number or regions, with red being high, and blue being low. Differentially methylated regions (DMRs) are the clouds that fall off the diagonal. (E) Regions with differential methylation between old and young β cells (DMRs) occur both at promoters (“proximal DMRs” - 1000 base pairs ± of TSS, 3,669 regions) and elsewhere in the genome (“distal DMRs” - >1000 base pairs from the nearest TSS, 10,699 regions), and can gain or lose methylation with aging. (F-G) The amplitude of change in DNA methylation is much larger at distal DMRs than at those close to transcriptional start sites. DMRs were subdivided by distance to transcriptional start sites as indicated. X-axis values between (−) 100 and 0 represent gain of methylation with aging and between 0-100, lose of methylation with aging. See also Figure S2 and S3.
Figure 3
Figure 3. Chromatin marks at distal DMRs predict loss of DNA methylation during β cells aging
(A) Heatmap integrating chromatin marks with four subgroups of DMR, located either proximal or distal to TSS and either gaining or losing methylation with aging. Note that greater proportion of distal DMRs that lose methylation with aging are previously marked as active enhancers by both H3K4me1 and H3K27ac in young β cells as compared with distal DMRs that gain methylation with aging. Colorbar scale is linear, representing read density with blue being low and yellow being high. (B) Integration of DMRs with the H3K27ac mark, often found at active enhancers and promoters, yielded 1,028 distal and 1,902 proximal regions that contained both properties. In both groups greater proportion of DMRs becomes demethylated with age, with a stronger effect in distal regions. Black, DMRs that lose methylation with aging, gray, DMRs that gain methylation with aging. (C) Distal DMRs that lose methylation with aging are enriched for recognition sequences for key β cell transcription factors (HOMER (Heinz et al., 2010)). (D) Distal DMRs that gain methylation with aging are enriched for binding motifs for transcription factors important in early embryonic development (HOMER (Heinz et al., 2010)). (E) Percentage of distal DMRs bound by the β cell transcription factors Foxa2, Pdx1 and NeuroD1. Black bars, distal DMRs that lose methylation with aging, gray bars, distal DMRs that gain methylation with aging. (F) DNA methylation levels at the binding sites of Foxa2, Pdx1 and NeuroD1 in young and old. Binding sites were divided into three methylation categories in young previous to analysis; fully methylated (black bars, over 50% on average), Low methylated (gray bars, between 14% - 50% on average) and Unmethylated (white bars, less than 14%). Only binding sites that had coverage depth of over 10 reads in both old and young were considered for the analysis. All methylation differences between young and old β cells were found significant by paired t-test, p<0.0001 (**). See also Figure S2 and S3.
Figure 4
Figure 4. Age-dependent methylation dynamics differentiate among functional gene categories
(A-D) Gene ontology analysis (DAVID (Dennis et al., 2003)) for DMRs classified by location relative to transcriptional start site and direction of methylation change with age. (A) Demethylated proximal promoters are enriched for genes function in cellular metabolism. (B) De novo methylated promoters are frequently involved in the cell cycle. (C) In addition to biological pathways enriched in both distal DMRs that gain or lose methylation with aging, demethylated distal DMRs are enriched for β-cell function genes, while (D) de novo methylated regions are found associated with pancreas development and cell cycle genes. See also Figure S4.
Figure 5
Figure 5. Age-related demethylation of enhancers is associated with gene activation
(A-D), Expression analysis of genes associated with DMRs located within promoter regions (≤±1kb of the nearest TSS) and distal regions (≥ ±1kb from nearest TSS). DMRs that lose methylation with age (blue) correlate with activated genes compared with DMRs that gain methylation (red) in both promoters and distal regions while no such correlation is found with genes downregulated (silenced) with age. (*) p < 0.05, (**) p < 0.01 by z-test, N.S, not significant. Grey bars show the percentage of DMRs containing Pdx1, NeuroD1 and/or Foxa2 binding sites within the specific group of DMRs. (E-H), Expression analysis of only the genes associated with the subset of DMRs marked by H3K27ac. (E,F) H3K27ac enriched DMRs near activated genes show significant demethylation during aging (promoters; 57%, enhancers 81%). (G,H) H3K27ac enriched DMRs in promoters of silenced genes are demethylated with age similarly to DMR in promoters of activated genes (57%; compare F and H) but to a lesser extent than DMRs of enhancers near activated genes (61% in H versus 81% in F, p < 0.01 by t-test). See also Figure S5.
Figure 6
Figure 6. β cell specific DMRs act as enhancers and silencers
(A, B), DMRs activity of β cell enhancers (A) and silencers (B). DMRs associated with key genes of β cell function were cloned upstream of a luciferase gene and transiently transfected into the β cell line MIN6 (white bars) and HEK 293 cells for comparison (gray striped bars). Luciferase activity was normalized against the activity of a cotransfected Renilla construct, and mean values ± (SEM) are shown relative to the empty vector (pGL4.23). Luciferase activity of seven enhancers and three silencers was found significantly elevated in MIN6 as compared with the activity in HEK293 cells, (*) p < 0.05, (**) p<0.01, paired Student’s t-test. (C-I) Targeted bisulfite sequencing validation of age-dependent β cell DMRs identified by whole genome bisulfite sequencing. Three biological replicates of young and old β cells were used to verify methylation at the single-CpG level and each regional average for DMRs associated with Kcnj11, encoding the Kir6.2 subunit of the ATP-sensitive potassium channel (C), Gck, encoding glucokinase (D) Foxa2, encoding the β cell transcription factor FOXA2 (E), Cdkn2a, encoding the cell cycle and senescence regulator p16 (F), Ccnd1, encoding Cyclin D1 (G), Sox9, encoding the β cell transcription factor SOX9 (H) and Nkx6-1, encoding the β cell specific transcription factor NKX6-1 (I). The DMR regions associated with Kcnj11, Gck, Foxa2 and Cdkn2a decrease in their regional average methylation with age (Kcnj11: 30.4% ± 15%; Gck: 21.3% ± 10.65%, Foxa2: 25.7% ± 6.2%; Cdkn2a 26.1% ± 2.3%) while the DMR associated with Nkx6-1 contains several individual CpGs that become significantly demethylated with age. Both DMR regions associated with Ccnd1 and Sox9, increase in their regional average methylation with age significantly (Ccnd1: 51.7% ± 17.4%; Sox9 27.2% ± 7%). (*) p < 0.05; (**) p < 0.01; (***) p < 0.001 by t-test. (J), qPCR validation of differentially expressed key beta cell genes. Genes associated with the above DMRs were validated for their RNA expression levels in old and young β cells by qRT-PCR. The transcription factors NeuroD1, Nkx6-1 and FOXA2 were found significantly upregulated with age, in accordance with the RNA-seq data (*) p < 0.05; (**) p < 0.01 by t-test. See also Figure S6.
Figure 7
Figure 7. Insulin secretory function of β cells increase in old mice
(A) Islet perifusion assay using a glucose ramp (0 to 25 mM) to assess glucose threshold and maximal glucose-stimulated insulin secretion in old (gray line) and young (black line) mice (n=5 each). (B) Islet insulin content in old (gray bar) and young (black bar) mice (n=5 each). (C) Assessment of old and young β cell function by glucose-stimulated calcium influx assay. Dispersed islet cells retrieved from old (16 months) and young (4 weeks old) mice were loaded with Fura-2AM, a fluorescent dye which binds to intracellular free calcium [Ca2+]i and stimulated with three concentrations of glucose. Shown are calcium traces examples of single old and young (red and blue line respectively) β cells. Note that the young β cell (blue trace) responds with elevated calcium levels only at 10 mM glucose, while the old β cell is responsive at 5 mM. (D) Quantification of glucose responsiveness as determined by calcium imaging of individual β cells obtained from old (gray bar) and young (black bar) mice (n= 30 and 37 β cells for young and old mice respectively). (E-G) In vivo insulin secretion assay. 17 months old (average weight 29 gr, gray bars) and four-week old (average weight 20 gr, black bars) male mice, n=5 each, were fasted for 16 hours before an intraperitoneal injection of glucose (2mg/gr body weight). Blood insulin levels were measured before the injection (fasting level) and 3 and 7 minutes following glucose injection. (E), average serum insulin levels (ng/ml). (F), ratios between the averages of fasting insulin levels and insulin levels 3 minutes and 7 minutes after glucose injection. (G), average blood glucose levels (mg/dL). (*) p < 0.05; (**) p < 0.01; (***) p < 0.001; NS, not significant, by t-test. (H) Gene expression analysis of key β-cell function genes and regulators of β cell cycle activity in young (4-6 weeks) and old (16 months) old mouse and human β cells. For the human β cells, samples were from four young donors (ages 6 months, 4, 10 and 14 years old) and six older donors (ages between 28 to 64 years). Data represent the fold change between old and young β cells. Primer sets can be found in the Supplemental Material (Table S7).

References

    1. Ackermann AM, Gannon M. Molecular regulation of pancreatic beta-cell mass development, maintenance, and expansion. Journal of molecular endocrinology. 2007;38:193–206. - PubMed
    1. Almaca J, Molina J, Arrojo EDR, Abdulreda MH, Jeon WB, Berggren PO, Caicedo A, Nam HG. Young capillary vessels rejuvenate aged pancreatic islets. Proceedings of the National Academy of Sciences of the United States of America. 2014;111:17612–17617. - PMC - PubMed
    1. Berninger P, Gaidatzis D, van Nimwegen E, Zavolan M. Computational analysis of small RNA cloning data. Methods. 2008;44:13–21. - PubMed
    1. Bird A. DNA methylation patterns and epigenetic memory. Genes & development. 2002;16:6–21. - PubMed
    1. Bollati V, Schwartz J, Wright R, Litonjua A, Tarantini L, Suh H, Sparrow D, Vokonas P, Baccarelli A. Decline in genomic DNA methylation through aging in a cohort of elderly subjects. Mechanisms of ageing and development. 2009;130:234–239. - PMC - PubMed

Publication types

MeSH terms

Associated data