. 2015 Sep 10;162(6):1299-308.
doi: 10.1016/j.cell.2015.08.011. Epub 2015 Aug 27.

HNRNPA2B1 Is a Mediator of m(6)A-Dependent Nuclear RNA Processing Events

Affiliations

HNRNPA2B1 Is a Mediator of m(6)A-Dependent Nuclear RNA Processing Events

Claudio R Alarcón et al. Cell. .

Abstract

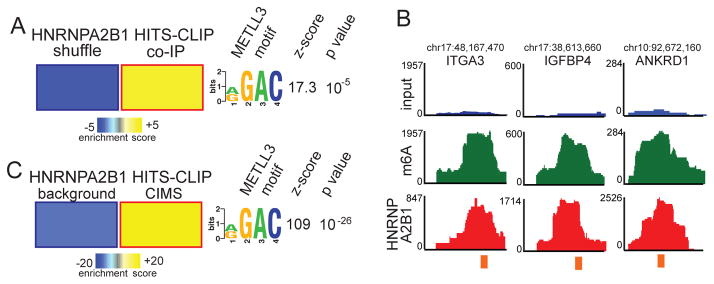
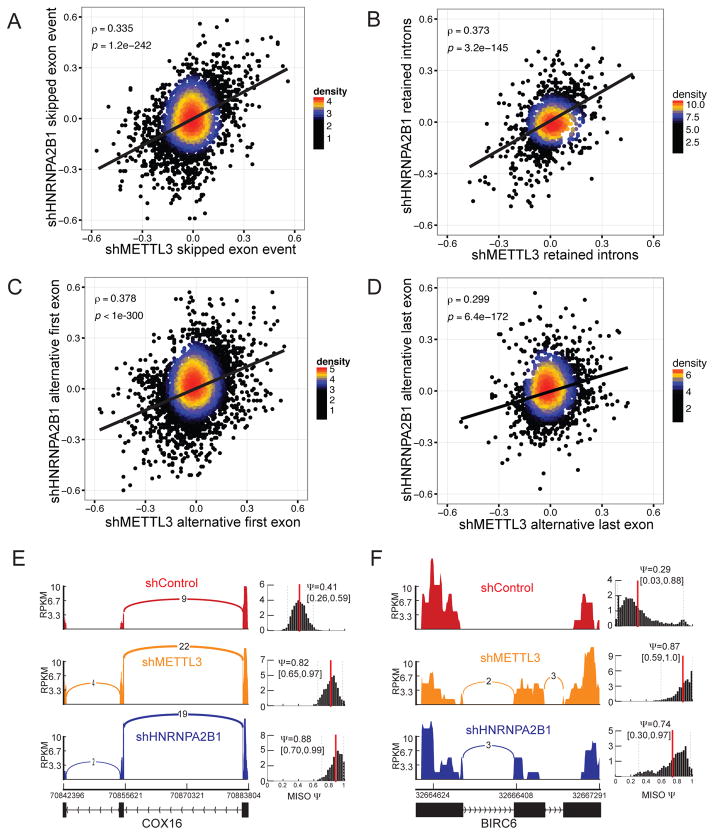
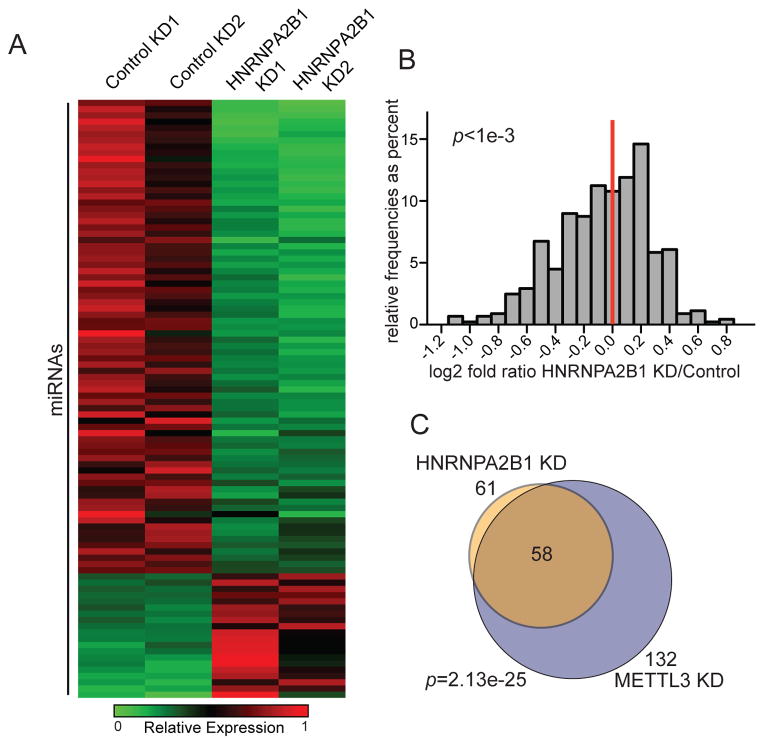
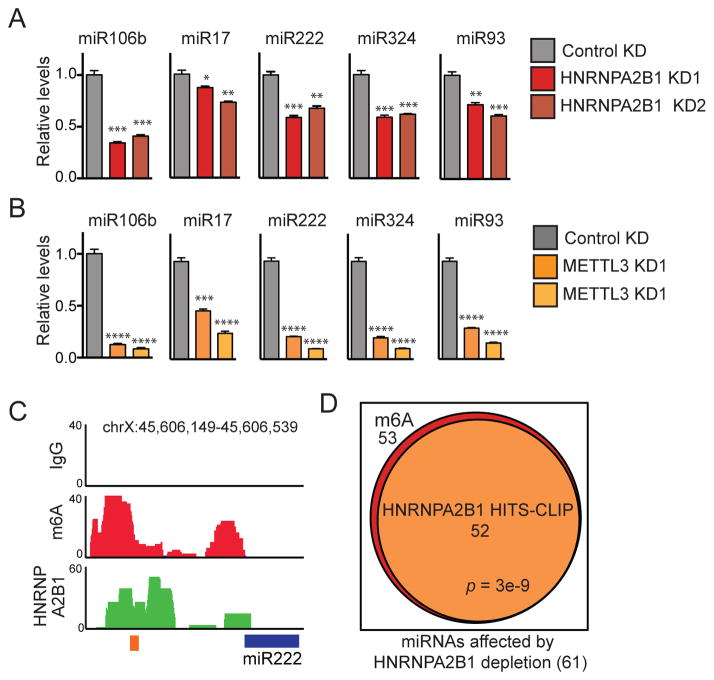
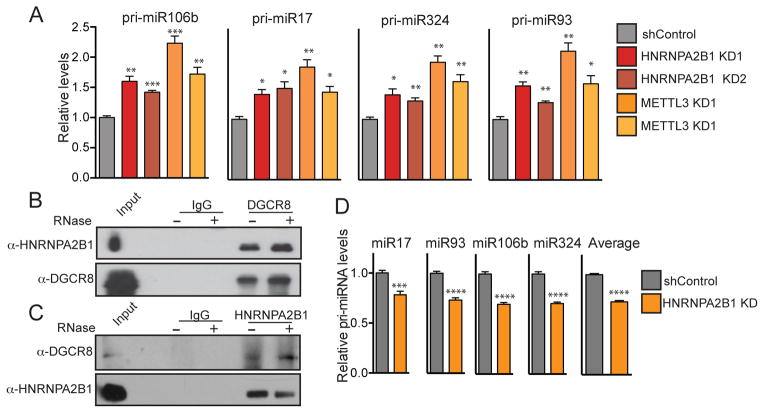
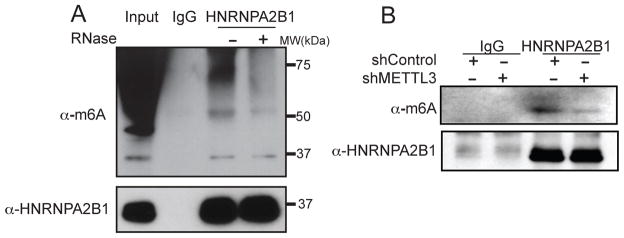
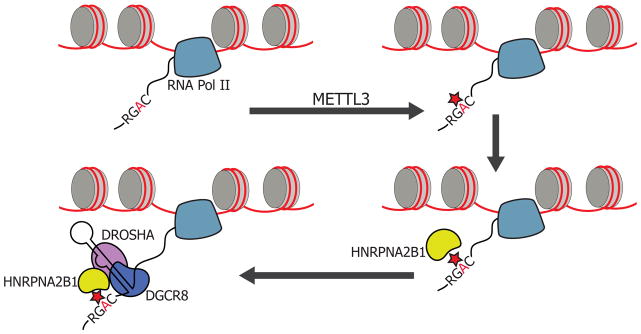
N(6)-methyladenosine (m(6)A) is the most abundant internal modification of messenger RNA. While the presence of m(6)A on transcripts can impact nuclear RNA fates, a reader of this mark that mediates processing of nuclear transcripts has not been identified. We find that the RNA-binding protein HNRNPA2B1 binds m(6)A-bearing RNAs in vivo and in vitro and its biochemical footprint matches the m(6)A consensus motif. HNRNPA2B1 directly binds a set of nuclear transcripts and elicits similar alternative splicing effects as the m(6)A writer METTL3. Moreover, HNRNPA2B1 binds to m(6)A marks in a subset of primary miRNA transcripts, interacts with the microRNA Microprocessor complex protein DGCR8, and promotes primary miRNA processing. Also, HNRNPA2B1 loss and METTL3 depletion cause similar processing defects for these pri-miRNA precursors. We propose HNRNPA2B1 to be a nuclear reader of the m(6)A mark and to mediate, in part, this mark's effects on primary microRNA processing and alternative splicing. PAPERCLIP.


Figures

Figure 1
Figure 1. HNRNPA2B1 recognizes m6A methylated sequences
(A) FIRE, in non-discovery mode, was used to assess enrichment of the RGAC motif among the HNRNPA2B1 HITS-CLIP peaks, obtained from MDA-MB-231 cells, relative to randomly generated sequences with similar dinucleotide frequencies. The figure shows a significant enrichment of the m6A motif (RGAC) in HNRNPA2B1 binding sites, where yellow indicates over-representation and blue represents under-representation. The magnitude of the representation is as per the heat-map scale shown at the bottom. The associated z-score and p-value are also provided. (B) RNA sequencing read density at exemplary loci where HNRNPA2B1 and m6A peaks intersect. Shown are the input nuclear RNA (blue), m6A-seq (green), and HNRNPA2B1 HITS-CLIP (red) reads. The orange bar denotes the sequence match to the RGAC motif. (C) FIRE analysis of the enrichment of the RGAC motif in the HNRNPA2B1 footprints. Sequences within 5nt of HNRNPA2B1 cross-linking induced deletions generated by HITS-CLIP protocol were significantly enriched for the RGAC motif when compared to background deletions. The motif, p-value and z-score are also shown.
Figure 2
Figure 2. Depletion of HNRNPA2B1 and METTL3 similarly affect RNA splicing
(A–D) Correlation between differential percent spliced in (ψ) in annotated alternative splicing events following HNRNPA2B1 and METLL3 depletion. Annotated skipped exons (A), retained introns (B), alternative first exons (C), and alternative last exons (D) were quantified in HNRNPA2B1 and METTL3 knockdown MDA-MB-231 cells respectively (relative to control cells). Spearman correlation was then used to assess the similarity in splicing modulations following depletion of METTL3 (m6A writer) and HNRNPA2B1 (m6A reader). (E) Exemplary sashimi plots (Katz et al., 2015) showing concerted alternative splicing changes that occurred in MDA-MB-231 cells depleted of METTL3 or HNRNPA2B1. (F) Exemplary of sashimi plots as in E but using an independent cell line, HeLa. Shown are the normalized coverage at each exon, along with the estimated ψ value (percent spliced in). For example, in this case, 29% of transcripts were estimated to contain the skipped exon in the control sample, while this estimate was increased to 87% and 74% for METTL3 and HNRNPA2B1 depleted cells, respectively.
Figure 3
Figure 3. Depletion of HNRNPA2B1 impacts miRNA production
(A) Heat map depicting the miRNAs affected at least by 50% by 2 independent shRNAs targeting HNRNPA2B1 in HEK293 cells. Red represents higher expression and green lower expression levels. (B) Histogram of the fold change (log2) observed in miRNA expression, as obtained by genome-wide miRNA expression profiling shown in (A). The ratio of the average level for the two independent shRNAs over the average of the two controls is shown. The p-value of the two-sample Kolmogorov-Smirnov test is indicated. (C) Venn diagram depicting the intersection of miRNAs that were reduced by greater than 50% upon HNRNPA2B1 or METTL3 depletion. 132 miRNAs were downregulated by more than 50% upon METTL3 depletion and 61 miRNAs were downregulated by 50% upon HNRNPA2B1 depletion. The extent of miRNAs detected by microarray in both experiments was 329. The p-value was calculated based on the hypergeometric distribution.
Figure 4
Figure 4. HNRNPA2B1 binds to m6A-methylated pri-miRNA sequences
(A) qRT-PCR quantification of exemplary miRNAs that were modulated by HNRNPA2B1 depletion in MDA-MB-231 cells. Stable cell lines expressing shControl vector or two independent shRNAs targeting HNRNPA2B1 were generated and total RNA was extracted and quantified. ***, p-value <1E-3; **, p-value <1E-2; *, p-value <5E-2. (B) Quantification of the expression levels of miRNAs shown in (A) when METTL3 was depleted in MDA-MB-231 cells by 2 independent shRNAs, as measured by qRT-PCR. P-values as in (A). ****, p-value <5E-4; ***, p-value <1E-3. (C) Genome tracks depicting sequencing read coverage from m6A-seq (red) and HNRNPA2B1 HITS-CLIP (green) within an exemplary pri-miRNA obtained from MDA-MB-231 cells. The upper track represents the reads from the IgG immunoprecipitated control sample. The blue box indicates the position of the pre-miRNA and the orange box indicates the position of the RGAC motif. The chromosomal location of the sequence depicted in the figure is shown at the top of the panel. (D) Venn diagram showing the overlap between m6A-seq tags and HNRNPA2B1-HITS-CLIP tags within pri-miRNA regions of miRNAs affected by HNRNPA2B1 depletion. The p-value was calculated based on the hypergeometric distribution.
Figure 5
Figure 5. HNRNPA2B1 regulates miRNA processing and interacts with the Microprocessor
(A) Pri-miRNA expression levels for the miRNAs shown in (4B–C) upon HNRNPA2B1 and METTL3 depletion as measured by qRT-PCR. All experiments were performed in biological triplicates. ***, p-value <1E-3; **, p-value <1E-2; *, p-value <5E-2. (B) In vivo interaction between DGCR8 and HNRNPA2B1. HEK293 cells were chemically crosslinked before antibody-mediated immunoprecipitation of endogenous DGCR8. After immunoprecipitation, samples were washed and incubated with RNAse as indicated. Western blots for HNRNPA2B1 and DGCR8 are shown. (C) Same as B, but the reciprocal immunoprecipitation was performed. In this case endogenous HNRNPA2B1 was immunoprecipitated and its interaction with DGCR8 was detected by Western blot under similar conditions. (D) Quantification of DGCR8-bound pri-miRNAs. Endogenous DGCR8 was immunoprecititated after UV-crosslinking and pri-miRNAs bound to it were extracted and quantified by qRT-PCR. The bar graph shows the qRT-PCR of a panel of HNRNPA2B1-target miRNAs for which expression was shown to be reduced upon HNRNPA2B1 depletion. ****, p-value <5E-4; ***, p value-<1E-3.
Figure 6
Figure 6. HNRNPA2B1 binds m6A methylated RNA
(A) Immunoprecipitation of endogenous HNRNPA2B1 from MDA-MB-231 cells. Cells were UV-crosslinked before immunoprecipitation and samples were treated with RNase-A or left untreated as indicated after the immunoprecipitation. Western blotting was performed using the indicated antibodies. (B) Immunoprecipitation of endogenous HNRNPA2B1 and associated RNA from control cells or cells depleted of METTL3. Cells were UV-crosslinked prior to immunoprecipitation and Western blotting was done using the antibodies depicted in the figure.
Figure 7
Figure 7. HNRNPA2B1 is a mediator of the m6A mark
Schematic representation of the nuclear role of HNRNPA2B1 in miRNA processing. HNRNPA2B1 is shown as a reader of the m6A methylation mark. Pri-miRNA processing is depicted in the model. The red star represents m6A mark on RNA; and the yellow shape represents the HNRNPA2B1 RNA-binding protein. A similar model could be use to depict alternative splicing, in which HNRNPA2B1 binding to m6A methylated pre-mRNAs would facilitate the engagement of splicing factors.

References

    1. Alarcon CR, Lee H, Goodarzi H, Halberg N, Tavazoie SF. N6-methyladenosine marks primary microRNAs for processing. Nature. 2015;519:482–485. - PMC - PubMed
    1. Batista PJ, Molinie B, Wang J, Qu K, Zhang J, Li L, Bouley DM, Lujan E, Haddad B, Daneshvar K, et al. m(6)A RNA modification controls cell fate transition in mammalian embryonic stem cells. Cell stem cell. 2014;15:707–719. - PMC - PubMed
    1. Carroll SM, Narayan P, Rottman FM. N6-methyladenosine residues in an intron-specific region of prolactin pre-mRNA. Mol Cell Biol. 1990;10:4456–4465. - PMC - PubMed
    1. Csepany T, Lin A, Baldick CJ, Jr, Beemon K. Sequence specificity of mRNA N6-adenosine methyltransferase. The Journal of biological chemistry. 1990;265:20117–20122. - PubMed
    1. Denli AM, Tops BB, Plasterk RH, Ketting RF, Hannon GJ. Processing of primary microRNAs by the Microprocessor complex. Nature. 2004;432:231–235. - PubMed

Publication types

Associated data