. 2015 Sep 10;162(6):1217-28.
doi: 10.1016/j.cell.2015.08.012. Epub 2015 Aug 27.

Phosphoenolpyruvate Is a Metabolic Checkpoint of Anti-tumor T Cell Responses

Affiliations

Phosphoenolpyruvate Is a Metabolic Checkpoint of Anti-tumor T Cell Responses

Ping-Chih Ho et al. Cell. .

Abstract

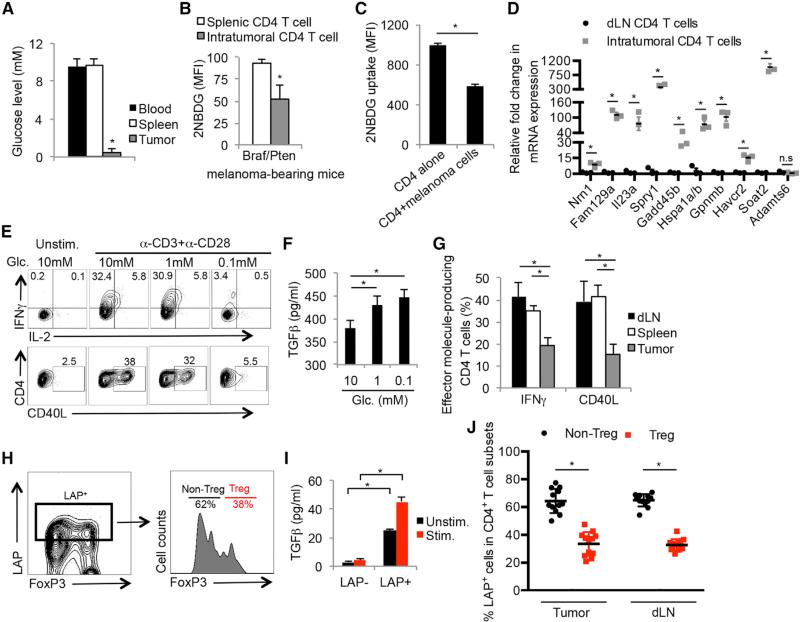
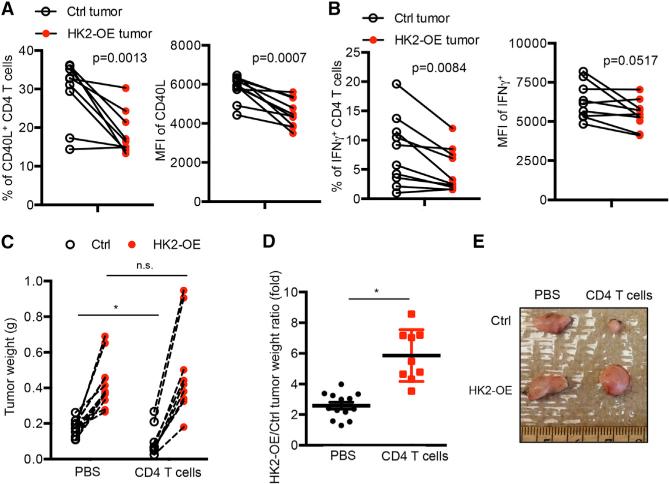
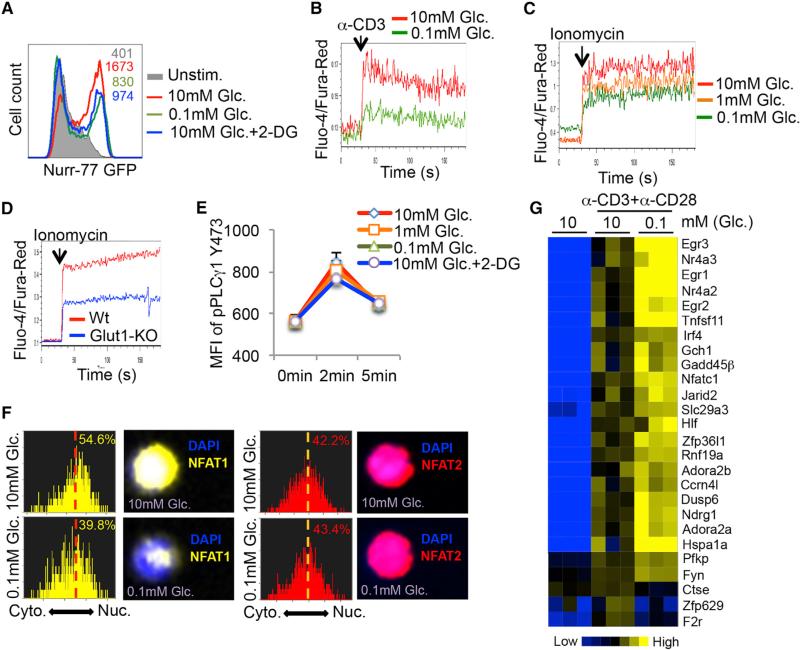
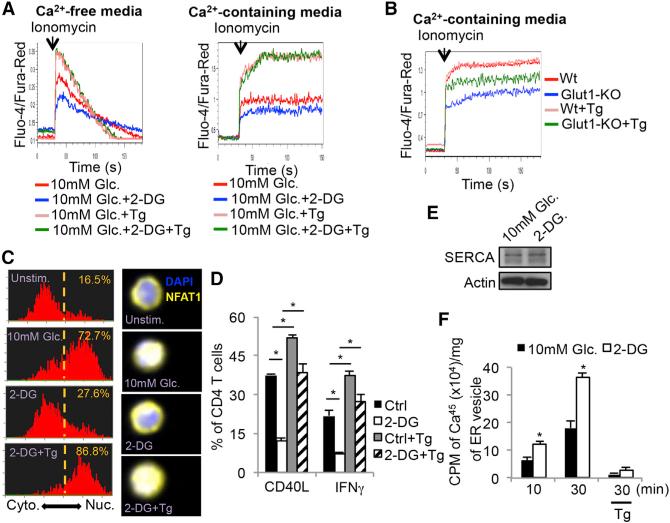
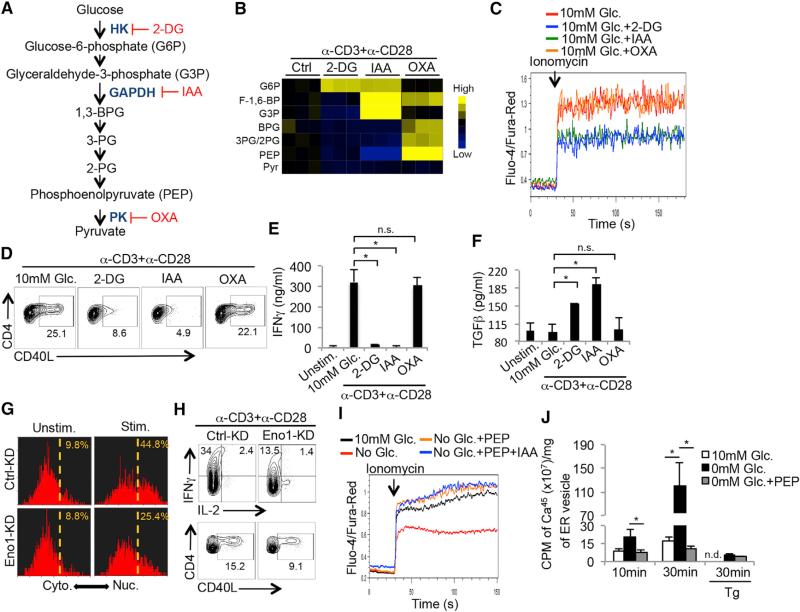
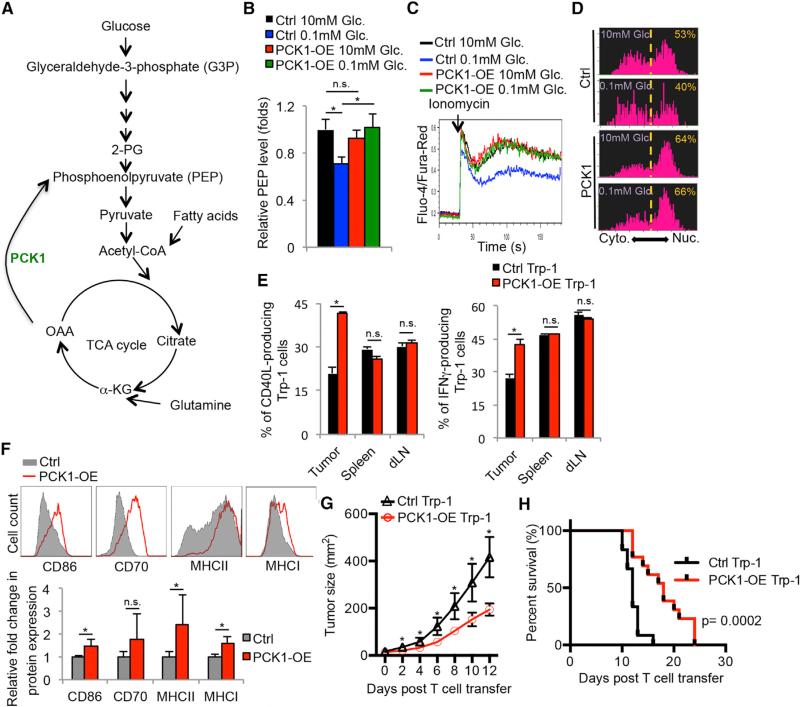
Activated T cells engage aerobic glycolysis and anabolic metabolism for growth, proliferation, and effector functions. We propose that a glucose-poor tumor microenvironment limits aerobic glycolysis in tumor-infiltrating T cells, which suppresses tumoricidal effector functions. We discovered a new role for the glycolytic metabolite phosphoenolpyruvate (PEP) in sustaining T cell receptor-mediated Ca(2+)-NFAT signaling and effector functions by repressing sarco/ER Ca(2+)-ATPase (SERCA) activity. Tumor-specific CD4 and CD8 T cells could be metabolically reprogrammed by increasing PEP production through overexpression of phosphoenolpyruvate carboxykinase 1 (PCK1), which bolstered effector functions. Moreover, PCK1-overexpressing T cells restricted tumor growth and prolonged the survival of melanoma-bearing mice. This study uncovers new metabolic checkpoints for T cell activity and demonstrates that metabolic reprogramming of tumor-reactive T cells can enhance anti-tumor T cell responses, illuminating new forms of immunotherapy.


Figures

Figure 1
Figure 1. Tumor Microenvironment Deprives Glucose to Infiltrating CD4+ T Cells
(A) Bar graphs show the glucose concentration in blood and interstitial fluid of tumors and spleens from Braf/Pten melanoma-bearing mice. (B and C) Glucose uptake in splenic and intratumoral CD44+/CD25lo and CD44+/CD25hi CD4+ T cells (B) or in TH1 cells cultured with or without Braf/Pten melanoma cells (C) was determined using fluorescent 2-NBDG and measured by flow cytometry. (D) The expression of glucose-deprived signature genes in CD4+ T cells isolated from melanomas and draining lymph nodes (dLNs) was determined by qRT-PCR. (E and F) TH1 CD4+ T cells derived from LCMV Armstrong-infected mice were stimulated by anti-CD3/anti-CD28 mAbs in vitro in the indicated glucose concentrations for 5 hr. The expression of IFNγ, IL-2, and CD40L was analyzed by flow cytometry (E), and production of TGFβ was determined by ELISA (F). (G) The production of CD40L and IFNγ in CD4+ T cells isolated from the dLN, spleen, or tumors in Braf/Pten mice was analyzed by flow cytometry. (H) LAP surface expression was compared between activated FoxP3+ (Treg) and FoxP3 (non-Treg) CD4+ T cells within melanomas using flow cytometry. (I) Validation of LAP staining as a surrogate for TGFβ secreting capability was performed by stimulating purified intratumoral LAP+ and LAP CD44+ CD4 T+ cells with or without anti-CD3/anti-CD28 mAbs for 16 hr and measuring the amount of TGFβ in culture supernatants by ELISA. (J) The frequency of LAP+ FoxP3+ (Treg) and FoxP3 (non-Treg) CD4+ T cells within melanomas or dLNs was assessed using flow cytometry. Data shown are cumulative of two (A and B, D, H, I) (n = 3–6 mice/group/experiment) and three (G and J) independent experiments (n = 3–4 mice/group/experiment) or representative of three (C, E and F) independent experiments (n = 3–5/group). Data are expressed as mean ± SD and (C) is presented as mean ± SEM. *p < 0.05 by unpaired Student's t test.
Figure 2
Figure 2. HK2 Overexpression in Melanoma Cells Suppresses CD4+ T Cell-Mediated Anti-tumor Responses
(A and B) Control (Ctrl) or HK2-OE Braf/Pten tumors were engrafted into the right and left flanks of C57BL/6 mice. Fourteen days later, the CD4+ TILs were isolated, stimulated in vitro by anti-CD3/anti-CD28 mAbs for 5 hr and analyzed for CD40L and IFNγ expression by flow cytometry. Left: percentage of CD40L+ (A) or IFNγ+ (B); right: mean fluorescence intensity (MFI) of the indicated proteins. (C–E) Ctrl or HK2-OE Braf/Pten tumors were en-grafted into the right and left flanks of Rag1-KO mice mouse that were either injected with PBS or reconstituted with CD4+ T cells and 14 days later the weight (C and D) and size (E) of tumors was assessed. (C and D) Graphs show tumor weights of the contralateral pairs of ctrl and HK2-OE melanomas collected from same mouse expressed as actual weights (C) or as a ratio (D). Data shown are cumulative of three (A and B) independent experiments (n = 3–4 mice/group) or four (C and D) independent experiments (n = 2–4 mice/group). Data are expressed as mean ± SD and *p < 0.05 by unpaired Student's t test.
Figure 3
Figure 3. Glycolysis Modulates the Ca2+-NFAT1 Signaling Pathway in CD4+ T Cells
(A) Naive CD4+ T cells from Nur-77-eGFP mice were left unstimulated or stimulated with anti-CD3/anti-CD28 mAbs for 5 hr in the indicated conditions and GFP fluorescence was measured by flow cytometry. Glc.: glucose; 2-DG: 2-deoxy-D-glucose. (B and C) Intracellular Ca2+ levels were measured in Fluo-4- and Fura-Red-labeled TH1 CD4+ T cells cultured in 10 mM glucose or 0.1 mM glucose before and after activation with anti-CD3 crosslinking antibodies (B) or ionomycin (C). The ratio of Fluo-4 and Fura-Red fluorescence was measured using flow cytometry. (D) Intracellular Ca2+ levels were measured as above in naive CD4+ T cells isolated from wild-type (Wt) or GLUT-1-knockout (Glut1-KO) mice. (E) TH1 CD4+ T cells were stimulated with anti-CD3/anti-CD28 in the indicated conditions and amounts of phospho-PLCγ1 were measured by flow cytometry. (F) TH1 cells were stimulated with ionomycin in medium containing 10 mM or 0.1 mM glucose for 10 min and the cytoplasmic versus nuclear distribution of NFAT1 and NFAT2 was determined by Amnis Imagestream. Representative histograms and images show the similarity profiles of NFAT1 (yellow, left) or NFAT2 (red, right) with DAPI staining to measure nuclear localization. The percentage of T cells with nuclear NFAT1 or NFAT2 is shown. (G) Heat map shows normalized expression of select genes associated with T cell anergy (Safford et al., 2005) in TH1 cells stimulated for 5 hr with anti-CD3/anti-CD28 mAbs in glucose-sufficient (10 mM) or glucose-deficient (0.1 mM) conditions. Data shown are representative of two (D and E) and three (A–C, F) independent experiments or cumulative of three (G) independent experiments (n = 2 mice/group).
Figure 4
Figure 4. Glycolysis Sustains Cytoplasmic Ca2+ Accumulation via Modulation of SERCA-Mediated Calcium Reuptake
(A) Intracellular calcium levels were measured in Fluo-4- and Fura-Red-labeled CD4+ T cells cultured in Ca2+-free (left) or Ca2+-containing media (right) in 10 mM glucose or 2-DG with or without thapsigargin (Tg). (B) Intracellular Ca2+ levels were measured as above in naive CD4+ T cells isolated from wild-type (Wt) or GLUT-1-knockout (Glut1-KO) mice and cultured in Ca2+-containing media with or without Tg. (C) Naive CD4+ T cells were left unstimulated or stimulated with ionomycin in the presence of 10 mM glucose, 2-DG or 2-DG plus Tg for 10 min and the cytoplasmic versus nuclear distribution of NFAT1 was determined by Amnis Imagestream. Representative histograms (left) and images (right) show the similarity profiles of NFAT1/DAPI staining to measure NFAT1 nuclear localization. The frequency of T cells with nuclear NFAT1 is shown. (D) Control or 2-DG treated TH1 cells were stimulated with anti-CD3/anti-CD28 mAbs for 5 hr in the absence or presence of Tg. The expression of CD40L and IFNγ was analyzed by flow cytometry. (E) Western blots showing the amount of SERCA protein in Jurkat T cells treated with or without 2-DG for 30 min. (F) Ca2+-uptake using radiolabeled 45CaCl2 was measured in ER microsomal fractions isolated from Jurkat T cells treated with or without 2-DG for 10 or 30 min. Data shown are representative of two (E and F) and three (A and B, C–E) independent experiments (n = 3/group in D and F. Data are expressed as mean ± SD and *p < 0.05 by unpaired Student's t test.
Figure 5
Figure 5. PEP Suppresses SERCA-Mediated ER Calcium Reuptake
(A) Illustration of the glycolysis pathway and the targets of the indicated glycolytic inhibitors. 2-DG: 2-deoxyglucose; IAA: iodoacetate; OXA: oxalate. (B) Heat map shows the normalized concentrations of the indicated glycolytic metabolites in CD4+ T cells stimulated with anti-CD3/anti-CD28 mAbs for 1 hr in the absence or presence of the glycolytic inhibitors described in (A) as measured by LC-QE-MS. (C) Intracellular Ca2+ levels were measured in Fluo-4- and Fura-Red-labeled TH1 cells treated with indicated glycolytic inhibitors before and after activation with ionomycin. (D–F) TH1 cells were left alone or stimulated with anti-CD3/anti-CD28 mAbs for 5 hr in 10 mM glucose in the absence or presence of indicated glycolytic inhibitors and the expression of CD40L (D), IFNγ (E) and TGFβ (Φ) was measured by flow cytometry (D) or ELISA (E and F). (G and H) CD4+ T cells were transduced with empty vector control retroviruses (RV, Ctrl-KD) or those expressing enolase-1 shRNAi (eno1-KD). RV-infected T cells were left alone or stimulated with ionomycin for 10 min and the cytoplasmic versus nuclear distribution of NFAT1 was determined by Amnis Imagestream as described in Figure 3F (G), or alternatively were stimulated with anti-CD3/anti-CD28 mAbs in vitro in the presence of 10 mM glucose for 5 hr and the expression of IFNγ, IL-2 and CD40L was analyzed by flow cytometry (H). (I) Intracellular Ca2+ levels in CD4+ T cells that were partially permeabilized and recovered in the absence or presence of PEP were measured as in (C) in the absence or presence of glycolytic inhibitor IAA. (J) Ca2+-uptake assay as described in Figure 4F was performed on ER microsomal fractions isolated from Jurkat T cells cultured in the presence or absence of glucose or exogenous PEP. The addition of Tg served as a specificity control for SERCA-dependent activity. Data shown are representative of two (H and J) and three (C and D, G and I) independent experiments or cumulative of three (B, E and F) independent experiments. Data are expressed as mean ± SD and *p < 0.05 by unpaired Student's t test.
Figure 6
Figure 6. Overexpression of Phosphoenolpyruvate Carboxykinase 1 Boosts Ca2+-NFAT Signaling and Tumoricidal Activities of Tumor-Specific CD4+ T Cells
(A) Illustration of the metabolic function of PCK1 in converting OAA to PEP. (B–D) CD4+ T cells were transduced with control (Ctrl) or PCK-1 overexpressing (PCK1-OE) RVs. (B) Intracellular PEP levels were measured after culturing the RV-transduced cells for 1 hr in the indicated conditions using a fluorescence-based assay. (C) Intracellular Ca2+ levels were measured in the transduced CD4+ T cells cultured in 10 mM or 0.1 mM glucose before and after activation with ionomycin. (D) The cytoplasmic versus nuclear distribution of NFAT1 was determined in the RV-transduced CD4+ T cells stimulated with ionomycin in 10 mM glucose or 0.1 mM glucose for 10 min by Amnis Imagestream as described in Figure 5G. (E–H) Melanoma-specific Trp-1+ CD4+ T cells transduced with Ctrl or PCK-1-OE RVs were adoptively transferred into B16 melanoma-bearing mice. (E and F) Three days later, the donor Trp-1+ CD4+ T cells (E) or TAMs (F) were isolated from the indicated tissues and analyzed for expression of the indicated proteins by flow cytometry. Rates of tumor growth (G) and animal survival (H) were determined over time. Data shown are representative of two (D) and three (C) independent experiments or cumulative of two (F) (n = 2–3 mice/group/experiment), three (B, E) (n = 2–3 mice/group/experiment), and four (G and H) independent experiments (n = 3–4 mice/group/experiment). Data are expressed as mean ± SD (B and F) or mean ± SEM (E) and *p < 0.05 by unpaired Student's t test.

Comment in

References

    1. Anastasiou D, Yu Y, Israelsen WJ, Jiang JK, Boxer MB, Hong BS, Tempel W, Dimov S, Shen M, Jha A, et al. Pyruvate kinase M2 activators promote tetramer formation and suppress tumorigenesis. Nat. Chem. Biol. 2012;8:839–847. - PMC - PubMed
    1. Baitsch L, Fuertes-Marraco SA, Legat A, Meyer C, Speiser DE. The three main stumbling blocks for anticancer T cells. Trends Immunol. 2012;33:364–372. - PubMed
    1. Blagih J, Coulombe F, Vincent EE, Dupuy F, Galicia-Vázquez G, Yurchenko E, Raissi TC, van der Windt GJ, Viollet B, Pearce EL, et al. The energy sensor AMPK regulates T cell metabolic adaptation and effector responses in vivo. Immunity. 2015;42:41–54. - PubMed
    1. Borge PD, Jr., Wolf BA. Insulin receptor substrate 1 regulation of sarco-endoplasmic reticulum calcium ATPase 3 in insulin-secreting beta-cells. J. Biol. Chem. 2003;278:11359–11368. - PubMed
    1. Braumüller H, Wieder T, Brenner E, Aßmann S, Hahn M, Alkhaled M, Schilbach K, Essmann F, Kneilling M, Griessinger C, et al. T-helper-1-cell cytokines drive cancer into senescence. Nature. 2013;494:361–365. - PubMed

Publication types

MeSH terms

Associated data