

THz and mm-Wave Sensing of Corneal Tissue Water Content: Electromagnetic Modeling and Analysis
- PMID: 26322247
- PMCID: PMC4551413
- DOI: 10.1109/TTHZ.2015.2392619
THz and mm-Wave Sensing of Corneal Tissue Water Content: Electromagnetic Modeling and Analysis
Abstract
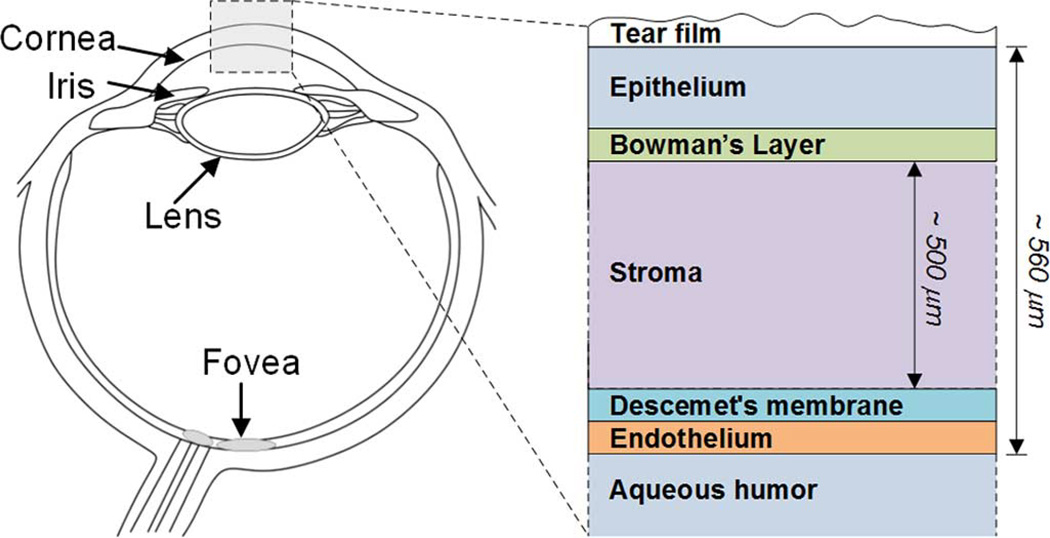
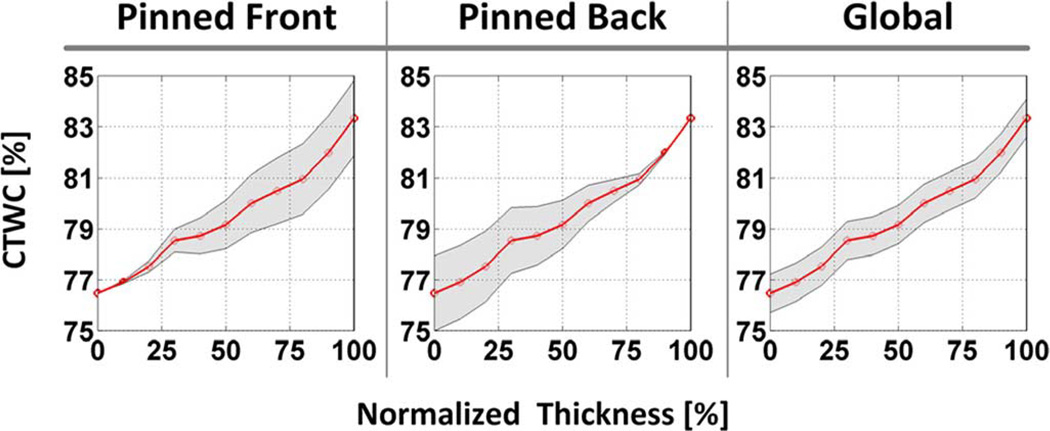
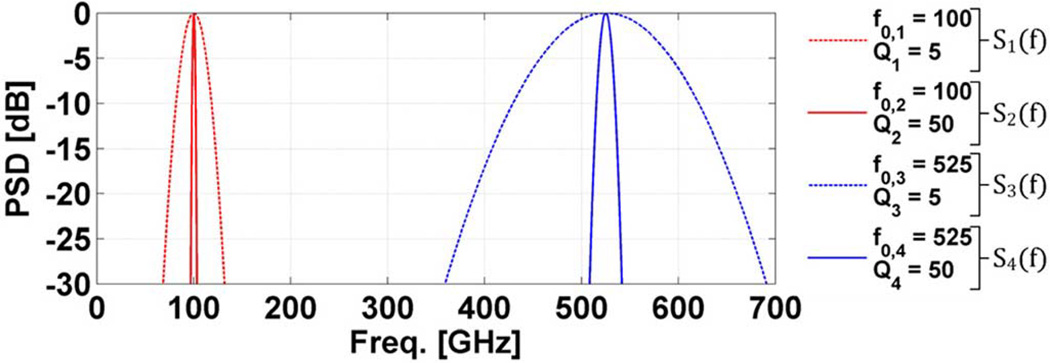
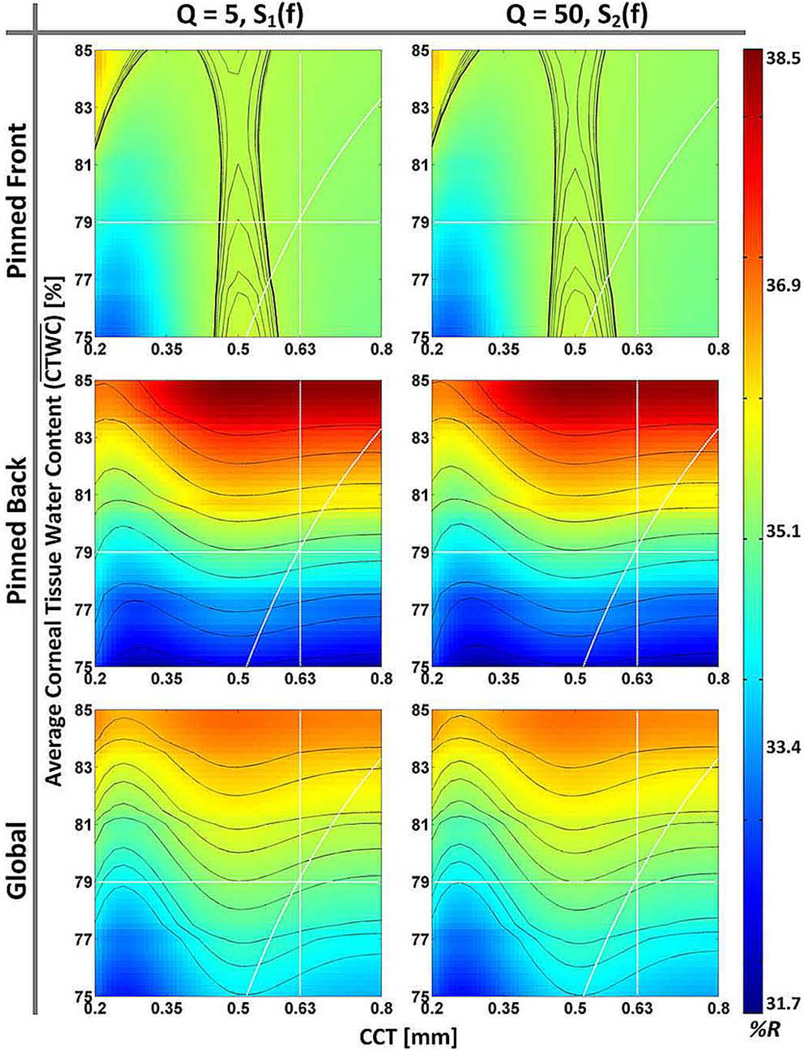
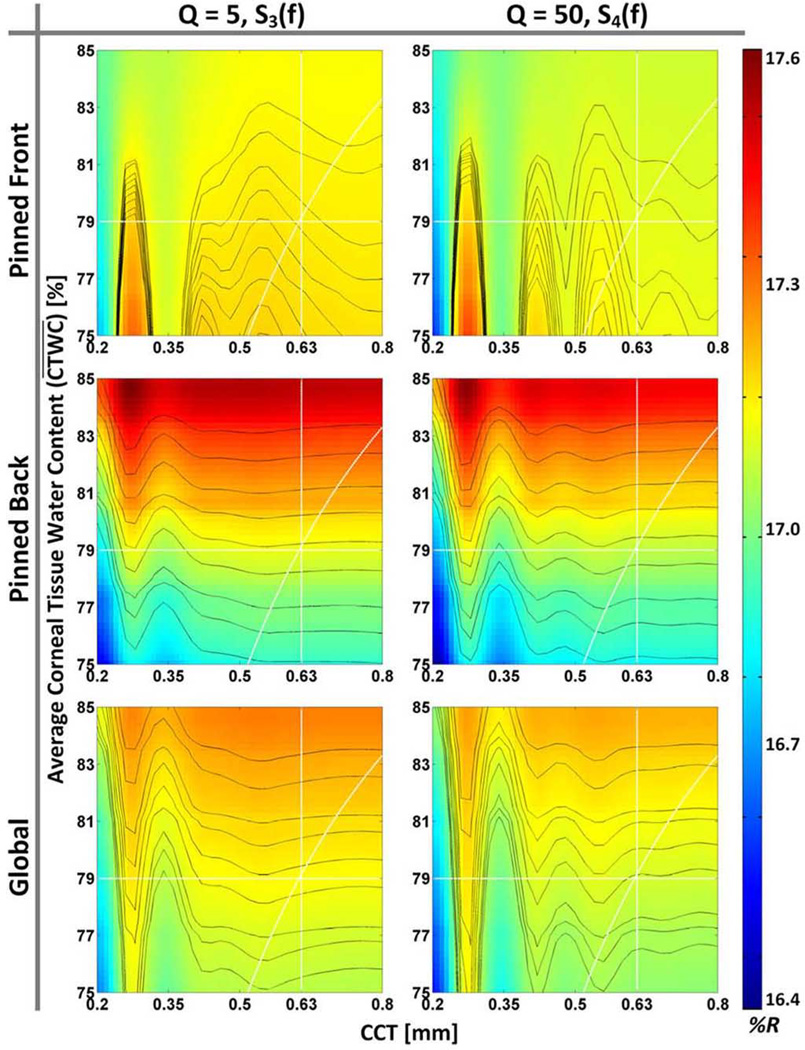
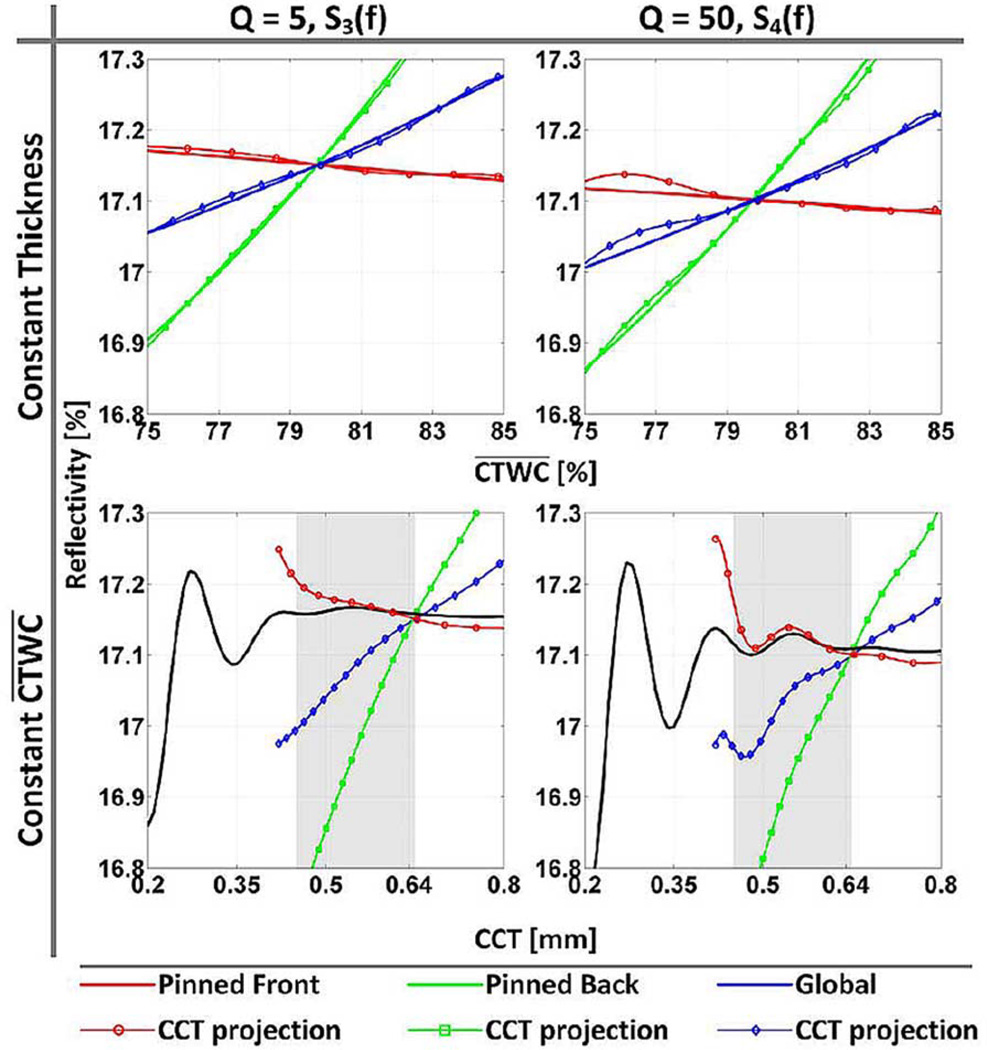
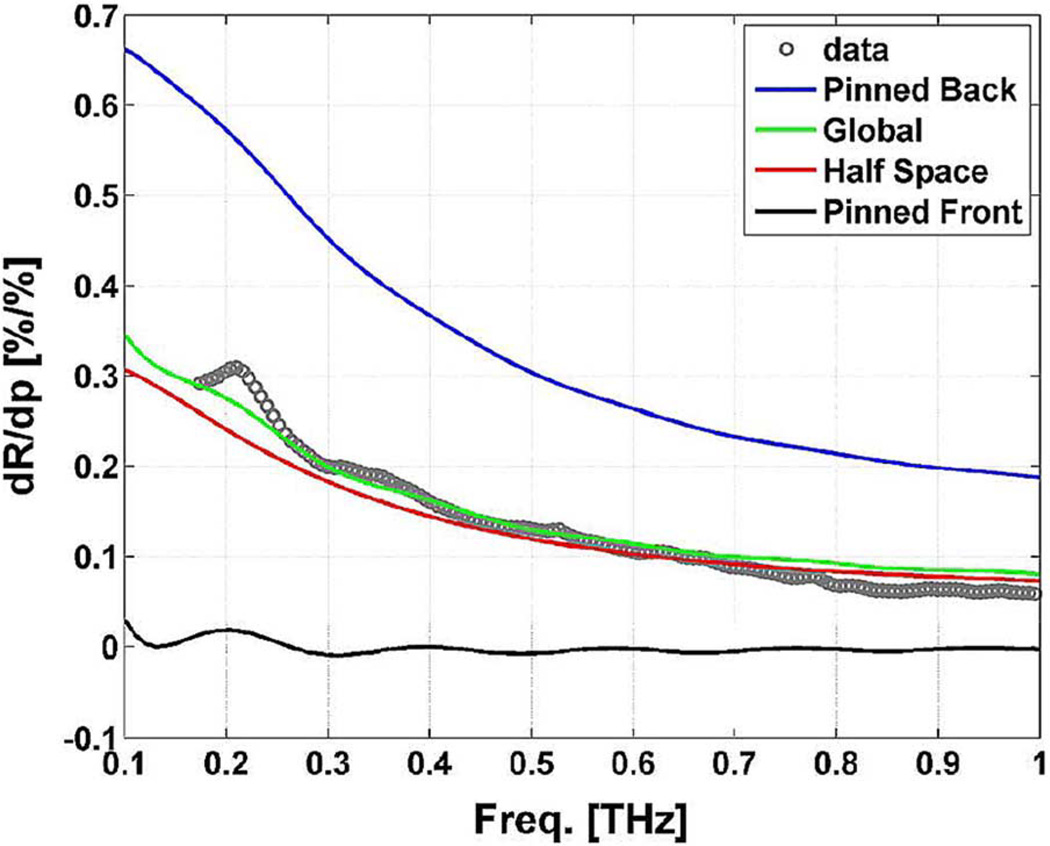
Terahertz (THz) spectral properties of human cornea are explored as a function of central corneal thickness (CCT) and corneal water content, and the clinical utility of THz-based corneal water content sensing is discussed. Three candidate corneal tissue water content (CTWC) perturbations, based on corneal physiology, are investigated that affect the axial water distribution and total thickness. The THz frequency reflectivity properties of the three CTWC perturbations were simulated and explored with varying system center frequency and bandwidths (Q-factors). The modeling showed that at effective optical path lengths on the order of a wavelength the cornea presents a lossy etalon bordered by air at the anterior and the aqueous humor at the posterior. The simulated standing wave peak-to-valley ratio is pronounced at lower frequencies and its effect on acquired data can be modulated by adjusting the bandwidth of the sensing system. These observations are supported with experimental spectroscopic data. The results suggest that a priori knowledge of corneal thickness can be utilized for accurate assessments of corneal tissue water content. The physiologic variation of corneal thickness with respect to the wavelengths spanned by the THz band is extremely limited compared to all other structures in the body making CTWC sensing unique amongst all proposed applications of THz medical imaging.
Keywords: Biological and medical imaging; clinical instruments; hydration interactions; medical diagnostics.
Figures

Similar articles
-
THz and mm-Wave Sensing of Corneal Tissue Water Content: In Vivo Sensing and Imaging Results.IEEE Trans Terahertz Sci Technol. 2015 Mar;5(2):184-196. doi: 10.1109/TTHZ.2015.2392628. IEEE Trans Terahertz Sci Technol. 2015. PMID: 26161292 Free PMC article.
-
Optical System Design for Noncontact, Normal Incidence, THz Imaging of in vivo Human Cornea.IEEE Trans Terahertz Sci Technol. 2018 Jan;8(1):1-12. doi: 10.1109/TTHZ.2017.2771754. Epub 2017 Nov 22. IEEE Trans Terahertz Sci Technol. 2018. PMID: 29450106 Free PMC article.
-
THz imaging system for in vivo human cornea.IEEE Trans Terahertz Sci Technol. 2018 Jan;8(1):27-37. doi: 10.1109/TTHZ.2017.2775445. Epub 2017 Dec 7. IEEE Trans Terahertz Sci Technol. 2018. PMID: 29430335 Free PMC article.
-
The Application of Terahertz Technology in Corneas and Corneal Diseases: A Systematic Review.Bioengineering (Basel). 2025 Jan 8;12(1):45. doi: 10.3390/bioengineering12010045. Bioengineering (Basel). 2025. PMID: 39851319 Free PMC article. Review.
-
Metasurface-Assisted Terahertz Sensing.Sensors (Basel). 2023 Jun 25;23(13):5902. doi: 10.3390/s23135902. Sensors (Basel). 2023. PMID: 37447747 Free PMC article. Review.
Cited by
-
Inflammation-suppressing cornea-in-a-syringe with anti-viral GF19 peptide promotes regeneration in HSV-1 infected rabbit corneas.NPJ Regen Med. 2024 Mar 1;9(1):11. doi: 10.1038/s41536-024-00355-1. NPJ Regen Med. 2024. PMID: 38429307 Free PMC article.
-
Design and validation of ultra-compact metamaterial-based biosensor for non-invasive cervical cancer diagnosis in terahertz regime.PLoS One. 2025 Feb 3;20(2):e0311431. doi: 10.1371/journal.pone.0311431. eCollection 2025. PLoS One. 2025. PMID: 39899558 Free PMC article.
-
Triage of in vivo burn injuries and prediction of wound healing outcome using neural networks and modeling of the terahertz permittivity based on the double Debye dielectric parameters.Biomed Opt Express. 2023 Jan 30;14(2):918-931. doi: 10.1364/BOE.479567. eCollection 2023 Feb 1. Biomed Opt Express. 2023. PMID: 36874480 Free PMC article.
-
Corneal stromal dehydration and optimal stromal exposure time during corneal refractive surgery measured using a three-dimensional optical profiler.Graefes Arch Clin Exp Ophthalmol. 2022 Dec;260(12):4005-4013. doi: 10.1007/s00417-022-05764-w. Epub 2022 Jul 25. Graefes Arch Clin Exp Ophthalmol. 2022. PMID: 35876884
-
Corneal hydration assessment indicator based on terahertz time domain spectroscopy.Biomed Opt Express. 2020 Mar 18;11(4):2073-2084. doi: 10.1364/BOE.387826. eCollection 2020 Apr 1. Biomed Opt Express. 2020. PMID: 32341867 Free PMC article.
References
-
- Ferguson B, Wang S, Gray D, Abbott D, Zhang XC. Identification of biological tissue using chirped probe THz imaging. Microelectron. J. 2002;33:1043–1051.
-
- Han PY, Cho GC, Zhang XC. Time-domain transillumination of biological tissues with terahertz pulses. Opt. Lett. 2000;25:242–244. - PubMed
-
- LöFfler T, Bauer T, Siebert K, Roskos H, Fitzgerald A, Czasch S. Terahertz dark-field imaging of biomedical tissue. Opt. Express. 2001;9:616–621. - PubMed
-
- Ferguson B, Wang S, Gray D, Abbot D, Zhang XC. T-ray computed tomography. Opt. Lett. 2002;27:1312–1314. - PubMed
-
- Arnone DD, et al. Appl. THz Technol. to Medical Imag. Munich, Germany: 1999. pp. 209–219.
Grants and funding
LinkOut - more resources
Full Text Sources
Other Literature Sources