

In Vivo Processing of Ceria Nanoparticles inside Liver: Impact on Free-Radical Scavenging Activity and Oxidative Stress
- PMID: 26322251
- PMCID: PMC4551665
- DOI: 10.1002/cplu.201402080
In Vivo Processing of Ceria Nanoparticles inside Liver: Impact on Free-Radical Scavenging Activity and Oxidative Stress
Abstract
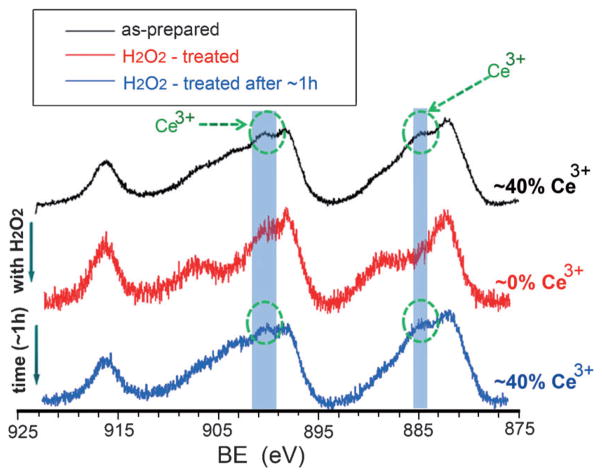
The cytotoxicity of ceria ultimately lies in its electronic structure, which is defined by the crystal structure, composition, and size. Despite previous studies focused on ceria uptake, distribution, biopersistance, and cellular effects, little is known about its chemical and structural stability and solubility once sequestered inside the liver. Mechanisms will be presented that elucidate the in vivo transformation in the liver. In vivo processed ceria reveals a particle-size effect towards the formation of ultrafines, which represent a second generation of ceria. A measurable change in the valence reduction of the second-generation ceria can be linked to an increased free-radical scavenging potential. The in vivo processing of the ceria nanoparticles in the liver occurs in temporal relation to the brain cellular and protein clearance responses that stem from the ceria uptake. This information is critical to establish a possible link between cellular processes and the observed in vivo transformation of ceria. The temporal linkage between the reversal of the pro-oxidant effect (brain) and ceria transformation (liver) suggests a cause-effect relationship.
Keywords: biotransformations; cellular chemistry; cerium; nanoparticles; redox chemistry.
Figures


Similar articles
-
Ceria Nanoparticles Improve the Quality of Aging Oocytes in Mice by Enhancing ROS Scavenging Ability.ACS Appl Bio Mater. 2025 Feb 17;8(2):992-1001. doi: 10.1021/acsabm.4c01086. Epub 2025 Jan 21. ACS Appl Bio Mater. 2025. PMID: 39957429
-
Comparative pulmonary toxicity of two ceria nanoparticles with the same primary size.Int J Mol Sci. 2014 Apr 10;15(4):6072-85. doi: 10.3390/ijms15046072. Int J Mol Sci. 2014. PMID: 24727375 Free PMC article.
-
Environment-mediated structure, surface redox activity and reactivity of ceria nanoparticles.Nanoscale. 2013 Jul 7;5(13):6063-73. doi: 10.1039/c3nr00917c. Epub 2013 May 29. Nanoscale. 2013. PMID: 23719690
-
Ceria-Based Therapeutic Antioxidants for Biomedical Applications.Adv Mater. 2024 Mar;36(10):e2210819. doi: 10.1002/adma.202210819. Epub 2023 Jun 25. Adv Mater. 2024. PMID: 36793245 Review.
-
Ceria-based solid catalysts for organic chemistry.ChemSusChem. 2010 Jun 21;3(6):654-78. doi: 10.1002/cssc.201000054. ChemSusChem. 2010. PMID: 20486156 Review.
Cited by
-
A drug-free nanozyme for mitigating oxidative stress and inflammatory bowel disease.J Nanobiotechnology. 2022 Mar 4;20(1):107. doi: 10.1186/s12951-022-01319-7. J Nanobiotechnology. 2022. PMID: 35246140 Free PMC article.
-
The Yin: An adverse health perspective of nanoceria: uptake, distribution, accumulation, and mechanisms of its toxicity.Environ Sci Nano. 2014 Oct 1;1(5):406-428. doi: 10.1039/C4EN00039K. Environ Sci Nano. 2014. PMID: 25243070 Free PMC article.
-
Antioxidant Cerium Oxide Nanoparticles in Biology and Medicine.Antioxidants (Basel). 2016 May 17;5(2):15. doi: 10.3390/antiox5020015. Antioxidants (Basel). 2016. PMID: 27196936 Free PMC article. Review.
-
Cerium oxide nanoparticles in neuroprotection and considerations for efficacy and safety.Wiley Interdiscip Rev Nanomed Nanobiotechnol. 2017 Jul;9(4):10.1002/wnan.1444. doi: 10.1002/wnan.1444. Epub 2016 Nov 8. Wiley Interdiscip Rev Nanomed Nanobiotechnol. 2017. PMID: 27860449 Free PMC article. Review.
-
Nanoceria distribution and effects are mouse-strain dependent.Nanotoxicology. 2020 Aug;14(6):827-846. doi: 10.1080/17435390.2020.1770887. Epub 2020 Jun 18. Nanotoxicology. 2020. PMID: 32552239 Free PMC article.
References
Grants and funding
LinkOut - more resources
Full Text Sources
Other Literature Sources
