. 2015;2(1):11.
doi: 10.1140/epjti/s40485-015-0020-z. Epub 2015 Jul 28.

Analysis of velocity-mapped ion images from high-resolution crossed-beam scattering experiments: a tutorial review

Affiliations

Analysis of velocity-mapped ion images from high-resolution crossed-beam scattering experiments: a tutorial review

Alexander von Zastrow et al. EPJ Tech Instrum. 2015.

Abstract

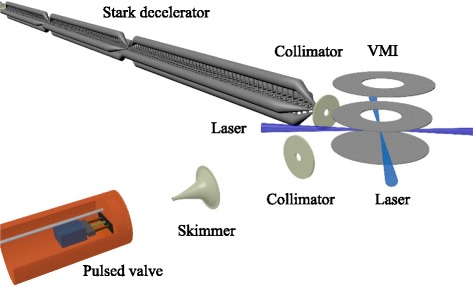
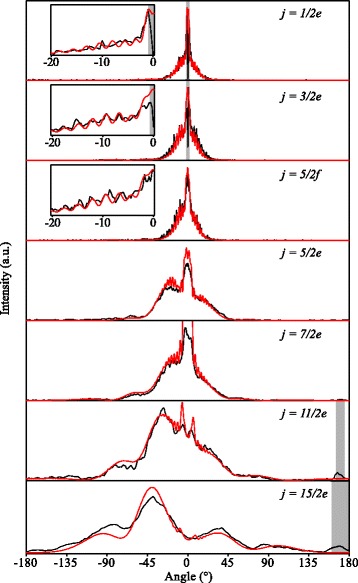
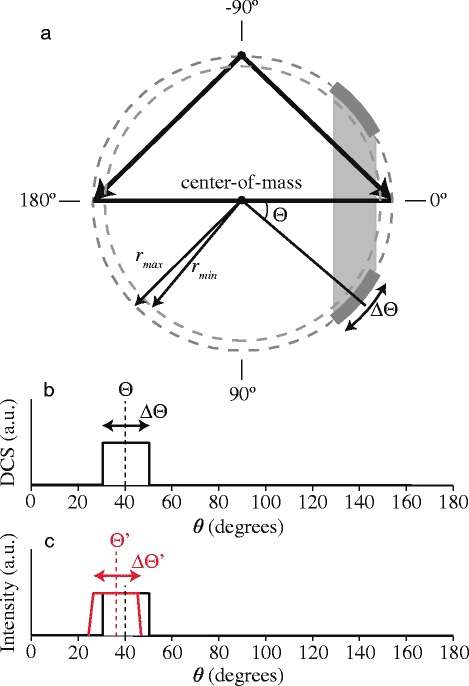
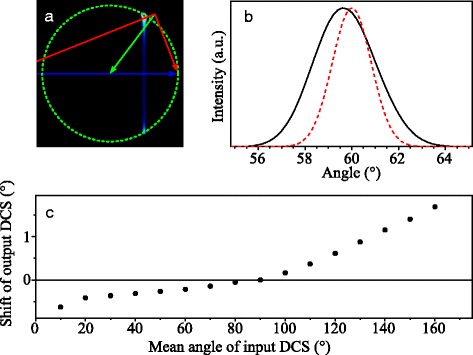
A Stark decelerator produces beams of molecules with high quantum state purity, and small spatial, temporal and velocity spreads. These tamed molecular beams are ideally suited for high-resolution crossed beam scattering experiments. When velocity map imaging is used, the Stark decelerator allows the measurement of scattering images with unprecedented radial sharpness and angular resolution. Differential cross sections must be extracted from these high-resolution images with extreme care, however. Common image analysis techniques that are used throughout in crossed beam experiments can result in systematic errors, in particular in the determination of collision energy, and the allocation of scattering angles to observed peaks in the angular scattering distribution. Using a high-resolution data set on inelastic collisions of velocity-controlled NO radicals with Ne atoms, we describe the challenges met by the high resolution, and present methods to mitigate or overcome them. PACS Codes: 34.50.-s; 37.10.Mn.

Keywords: Differential cross sections; Image analysis; Inelastic scattering; Ion imaging; Molecular beams; Stark decelerator; VMI.


Figures

Fig. 1
Fig. 1
Schematic representation of the experimental set-up. A pulsed beam of NO radicals is passed through a 2.6-meter long Stark decelerator, and is scattered with a pulsed beam of rare gas atoms at a 90 ° beam intersection angle. The inelastically scattered NO radicals are state-selectively ionized without excess recoil energy using two pulsed lasers. The ions are subsequently detected using a standard velocity map imaging arrangement
Fig. 2
Fig. 2
Rotational energy level diagram of NO (X 2 Π Ω,v=0) radicals. Two spin-orbit manifolds exist with Ω=1/2 and Ω=3/2. Each rotational level is labeled by the rotational quantum number j, and is split into two Λ-doublet components with e and f parity. The energy splitting between the Λ-doublet components of each rotational level is greatly exaggerated for clarity. The NO radicals that exit the Stark decelerator almost exclusively reside in the j=1/2f state
Fig. 3
Fig. 3
Velocity mapped ion image for the inelastic scattering process NO(j=1/2f)+Ne→NO(j=7/2e)+Ne. The Newton diagram pertaining to this scattering process is given as an overlay. The pre-collision laboratory (red) and center-of-mass (blue) velocity vectors of the NO and Ne beams, as well as the center-of-mass velocity vector (green) are indicated. Scattered molecules are expected on the so-called Newton circle indicated by the dashed green circle. Throughout this manuscript, scattering images are presented such that the mean relative velocity is oriented horizontally, and the laboratory zero-velocity is found in the top half of the image
Fig. 4
Fig. 4
Scattering images for inelastic collisions of NO (j = 1/2f) radicals with Ne atoms. The left column shows the raw experimental scattering images for NO-Ne collisions, exciting the NO radicals (from top to bottom) to the (j=1/2e), (3/2e), (5/2f), (5/2e), (7/2e), (11/2e) and (15/2e) states. The images that result from full simulations of the experiment, using the differential cross sections from quantum scattering calculations based on ab initio potential energy surfaces as inputs, are shown in the right column. The image for the final state (11/2e) contains a second component near forward scattering, due to overlapping REMPI transitions (see also ref. [2])
Fig. 5
Fig. 5
Angular scattering distributions. These distributions result from the experimental (black curves) and simulated (red curves) scattering images of Fig. 4, corresponding to the final states (from top to bottom) (j=1/2e), (3/2e), (5/2f), (5/2e), (7/2e), (11/2e) and (15/2e). The black and red curves are scaled with respect to each other. Parts of the distributions are shown on an enlarged scale in the insets to appreciate better the rapid diffraction oscillations that are recorded for inelastic channels with low rotational excitation
Fig. 6
Fig. 6
Simulated scattering images for elastic NO-Ne collisions. The images illustrate the asymmetry in intensity and resolution due to the velocity spreads of the beams alone (a) and due to a combination of beam spreads and the flux-to-density effect (b). The simulation parameters pertain to the experimental conditions; in (a) the finite laser probe volume is neglected, whereas in (b) the probe volume is taken into account. In both simulations an isotropic DCS is assumed
Fig. 7
Fig. 7
Simulation of the angular shift of small features in the DCS of a scattering process. a Schematic representation of the Newton diagram describing the scattering of two beams with particles of equal mass and equal pre-collision speed, with the relative velocity vector oriented horizontally. A DCS with a block feature as defined in panel (b) results in the gray area when the Newton sphere is crushed onto a two-dimensional plane. c Integration of the image intensity in an annulus between r min and r max results in an angular intensity distribution (shown by the red curve) that is shifted towards forward scattering with respect to the original DCS. This figure has been originally published in the supplement of reference [2] and was slightly adapted
Fig. 8
Fig. 8
Distribution of angular features with a large velocity spread in one of the beams. a Schematic representation of the Newton diagram describing the scattering of two beams with particles of equal mass and equal pre-collision speed. One of the beams has zero velocity spread, whereas the other beam has a large velocity spread. Three Newton diagrams are drawn that correspond to scattering with the mean (black diagram) and two outermost values for the velocity (red and green diagrams). A DCS with a series of delta functions as defined in panel (b) results in line segments in the angular intensity distribution. The orientation of these line segments with respect to the mean relative velocity vector strongly depends on the scattering angle. This figure has been originally published in the supplement of reference [2] and was slightly adapted
Fig. 9
Fig. 9
Angular shift of features in the DCS as present in the experiment. a Simulated scattering image that results from a hypothetical DCS that is centered around a mean position Θ= 60 °. b The hypothetical DCS (red dashed curve), together with the angular scattering intensity distribution (solid black curve) resulting from the simulated image. c Angular shift of the peak position of the angular scattering distribution with respect to the peak position of the input DCS, as a function of the mean position Θ
Fig. 10
Fig. 10
Illustration of the DCS extraction process using the (11/2e) final state as an example. a Simulated scattering image, using an isotropic DCS as input. b Angular scattering distribution that results from the image in panel (a), which is referred to as the apparatus function. c Simulated scattering image, using the DCS for the (11/2e) final state from quantum scattering calculations as input. d Angular scattering distribution that results from the image in panel (c). e Extracted DCS (black curve) that is obtained using the apparatus function to correct the angular scattering distribution, together with the DCS from quantum scattering calculations (red curve)
Fig. 11
Fig. 11
Experimentally determined differential cross sections. The experimentally determined and corrected DCSs (black curves) are shown together with the cross sections resulting from quantum scattering calculations (red curves), for the final states (from top to bottom) (5/2e), (7/2e), (11/2e) and (15/2e)
Fig. 12
Fig. 12
Illustration of misinterpretation of center and radius of Newton circle. The figure shows the error when these parameters are derived from a scattering image. a Hypothetical block DCS that is unity from θ= 0 ° to θ max= 100 ° and zero otherwise. b Scattering image that results from this block DCS, together with the true Newton diagram for this scattering process (green) and the Newton ring that is found by fitting the scattering intensity of the image using the Hough transformation (red curve). (c and d) Center point coordinates (x c and y c in panel (c) and (d), respectively) of the Newton diagram resulting from the Hough transform for hypothetical block DCSs as a function of the value for θ max. The center points of the true Newton diagram are indicated by horizontal dashed lines

References

    1. Eppink ATJB, Parker DH. Velocity map imaging of ions and electrons using electrostatic lenses: Application in photoelectron and photofragment ion imaging of molecular oxygen. Rev Sci Instrum. 1997;68:3477. doi: 10.1063/1.1148310. - DOI
    1. von Zastrow A, Onvlee J, Vogels SN, Groenenboom GC, van der Avoird A, van de Meerakker SYT. State-resolved diffraction oscillations imaged for inelastic collisions of NO radicals with He, Ne and Ar. Nat Chem. 2014;6:216–21. doi: 10.1038/nchem.1860. - DOI - PubMed
    1. Onvlee J, Vogels SN, von Zastrow A, Parker DH, van de Meerakker SYT. Molecular collisions coming into focus. Phys Chem Chem Phys. 2014;16:15768–79. doi: 10.1039/C4CP01519C. - DOI - PubMed
    1. van de Meerakker SYT, Bethlem HL, Vanhaecke N, Meijer G. Manipulation and control of molecular beams. Chem Rev. 2012;112:4828–878. doi: 10.1021/cr200349r. - DOI - PubMed
    1. Vogels SN, Onvlee J, von Zastrow A, Groenenboom GC, van der Avoird A, van de Meerakker SYT. High-resolution imaging of velocity-controlled molecular collisions using counterpropagating beams. Phys Rev Lett. 2014;113:263202. doi: 10.1103/PhysRevLett.113.263202. - DOI - PubMed

LinkOut - more resources