. 2015 Oct;16(10):1077-84.
doi: 10.1038/ni.3252. Epub 2015 Aug 31.

The DNA-binding inhibitor Id3 regulates IL-9 production in CD4(+) T cells

Affiliations

The DNA-binding inhibitor Id3 regulates IL-9 production in CD4(+) T cells

Hiroko Nakatsukasa et al. Nat Immunol. 2015 Oct.

Abstract

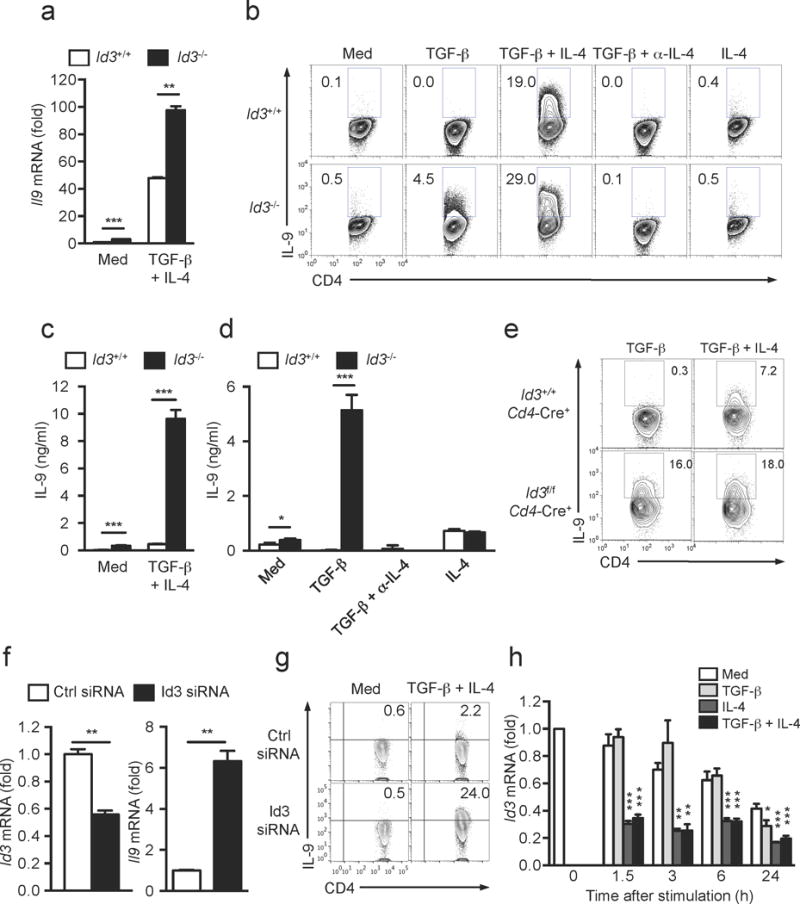
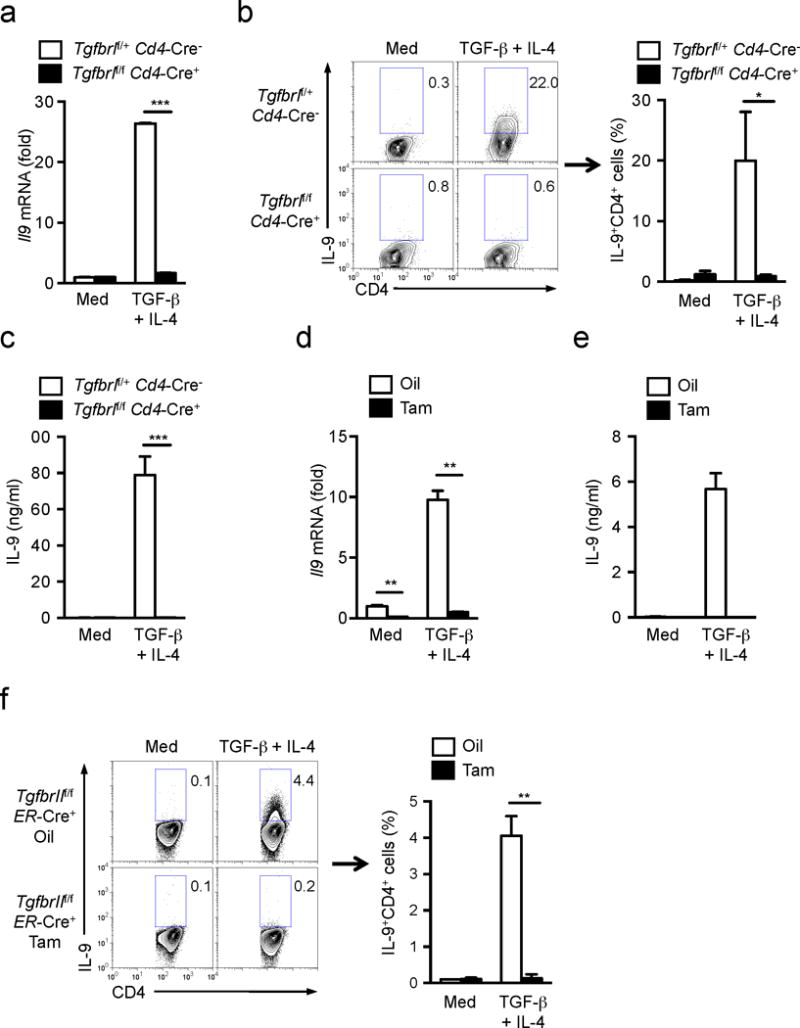
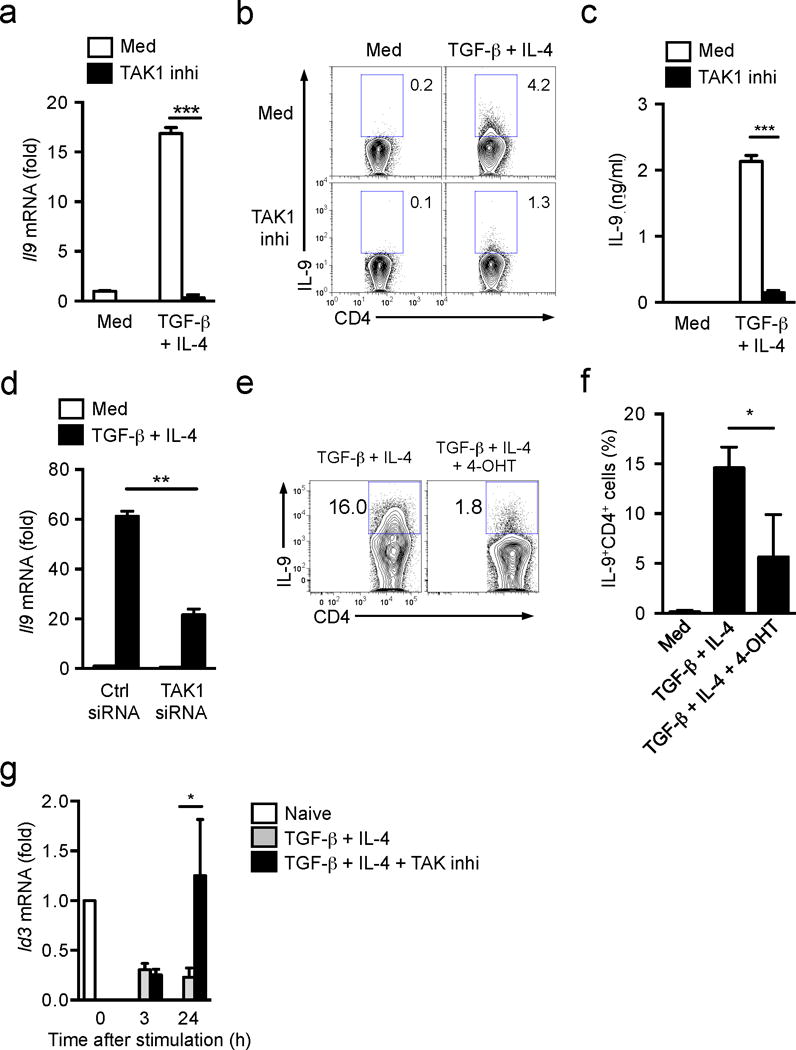
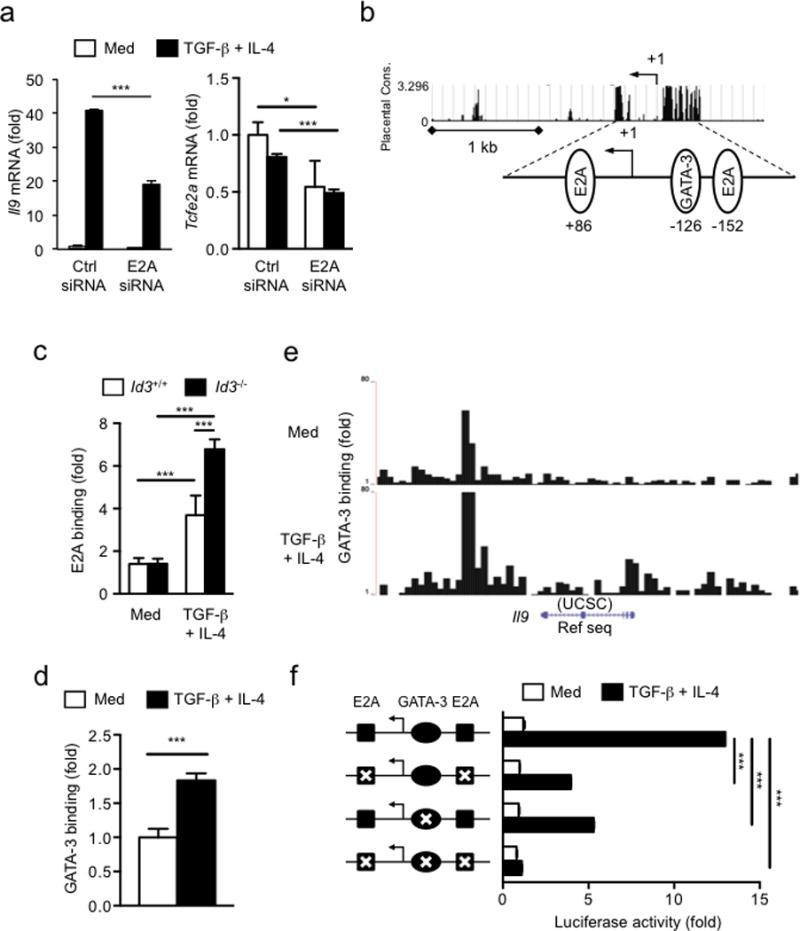
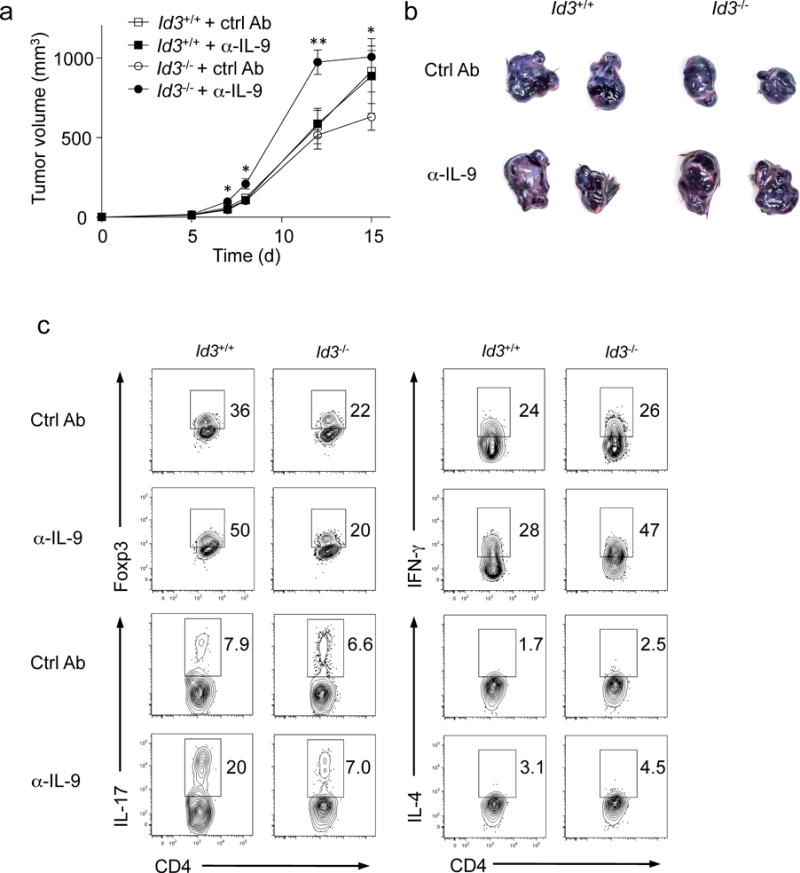
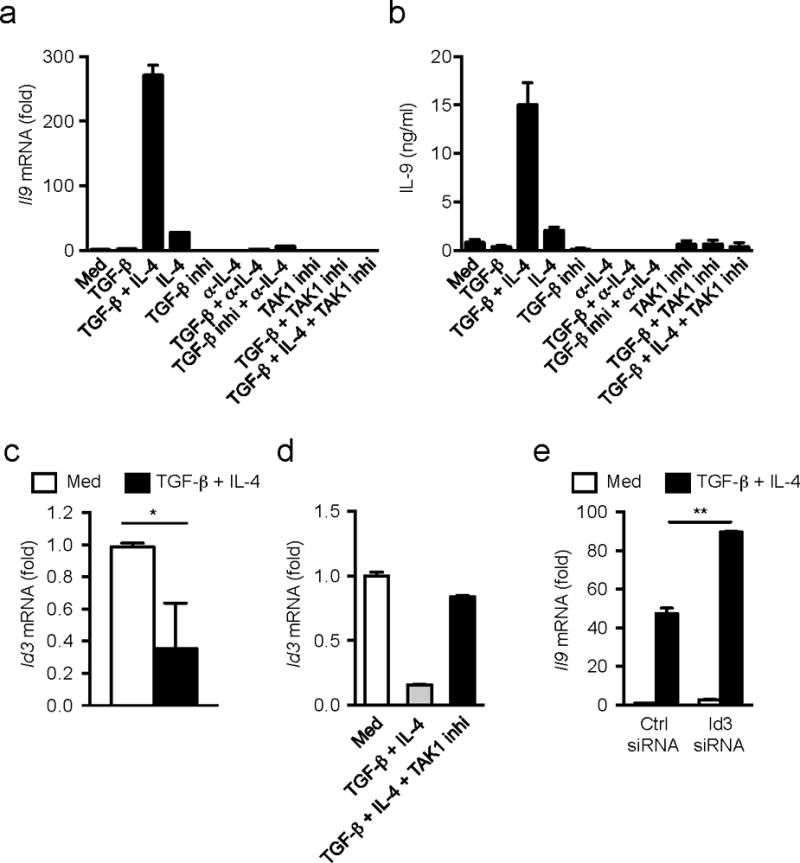
The molecular mechanisms by which signaling via transforming growth factor-β (TGF-β) and interleukin 4 (IL-4) control the differentiation of CD4(+) IL-9-producing helper T cells (TH9 cells) remain incompletely understood. We found here that the DNA-binding inhibitor Id3 regulated TH9 differentiation, as deletion of Id3 increased IL-9 production from CD4(+) T cells. Mechanistically, TGF-β1 and IL-4 downregulated Id3 expression, and this process required the kinase TAK1. A reduction in Id3 expression enhanced binding of the transcription factors E2A and GATA-3 to the Il9 promoter region, which promoted Il9 transcription. Notably, Id3-mediated control of TH9 differentiation regulated anti-tumor immunity in an experimental melanoma-bearing model in vivo and also in human CD4(+) T cells in vitro. Thus, our study reveals a previously unrecognized TAK1-Id3-E2A-GATA-3 pathway that regulates TH9 differentiation.


Conflict of interest statement

Competing financial interests

The authors declare no competing financial interests.

Figures

Figure 1
Figure 1. Id3 deficiency increases TH9 cell differentiation in vitro
(a) mRNA expression of Il9 in naive CD4+ T cells from Id3+/+ or Id3−/− mice cultured with anti-CD3+CD28, with various combination of TGF-β1, IL-4 and anti-IL-4 for 24h. (b) Intracellular staining of IL-9 protein in CD4+ T cells differentiated as described in a for 72h. (c,d) IL-9 production in TH9-polarizing condition (c) and Treg (TGF-β)- or TH2 (IL-4)-polarizing conditions (d) was determined by ELISA from culture media as described in b. (e) Flow cytometry of intracellular IL-9 expression in CD4+ T cells differentiated from naïve CD4+CD25 T cells isolated from the spleen and lymph nodes of Id3f/fCd4-Cre+ or Id3+/+Cd4-Cre+ mice and cultured with anti-CD3+CD28 together with TGF-β1 alone or TGF-β1 plus IL-4 for 3 days. Data shown are representative of two independent experiments. (f) Il9 and Id3 mRNA expression in naive CD4+CD25 T cells isolated from wild-type mice, transfected with Id3-specific or control siRNA and stimulated with anti-CD3+CD28 with or without TGF-β1 plus IL-4 and analyzed 48h post-stimulation. Expression is relative to Gapdh expression. (g) Flow cytometry analysis of intracellular IL-9 protein in cells differentiated as in f at 72h post-stimulation with anti-CD3+CD28 with or without TGF-β1 plus IL-4. (h) Time course change of Id3 mRNA expression in wild-type naive CD4+ T cells cultured with anti-CD3+CD28 with or without TGF-β1 and/or IL-4. Statistical analysis was shown as comparison to Med of respective time points. Data are representative of two (e-g) or three (a-d) or pooled from five independent experiments (h). Error bars represent mean± SD of duplicate (a,f,h) or triplicate (c,d) well measurements. *p<0.05, **p<0.01, ***p<0.001 (Student’s t-test (a,c,d,f) or one-way ANOVA with post-hoc Bonferroni’s test (h)).
Figure 2
Figure 2. Non-Smad TGF-β signaling is dominant during TH9 cell differentiation
(a) mRNA expression of Il9 in naïve T cells from Tgfbr1f/fCd4-Cre+ and Tgfbr1f/+Cd4-Cre mice cultured with anti-CD3+CD28 with or without TGF-β1 plus IL-4 for 24h. (b) Intracellular staining of IL-9 protein in CD4+ T cells differentiated as described in a for 72h. Left; Representative of three indepednent experiments. Right; Frequency of IL-9+ TH9 cells from three independent experiments. (c) IL-9 production in culture media of b was determined by ELISA. (d) mRNA expression of Il9 in naïve T cells from TgfbrIIf/fER-Cre+ mice that had been injected with oil or tamoxifen i.p. for consecutive 5 days cultured with anti-CD3+CD28 with or without TGF-β1 plus IL-4 for 24h. (e) IL-9 production in culture media of CD4+ T cells differentiated as described in d was determined by ELISA. (f) Intracellular staining of IL-9 protein in CD4+ T cells differentiated as in e for 72h. Left; Representative of two experiments. Right; Frequency of IL-9+ TH9 cells from two experiments. Data are representative of two (d, e, f(left)) or three (a, b(left), c) independent experiments or are pooled from two (f(right)) or three (b(right)) experiments. Error bars represent mean ± SD. *p<0.05, **p<0.01, ***p<0.001 (Student’s t-test,).
Figure 3
Figure 3. TAK1 regulates Id3 expression during TH9 cell differentiation
(a) mRNA expression of Il9 in naïve T cells from wild-type mice cultured with anti-CD3+CD28 with or without TGF-β1 plus IL-4 in the absence and presence of TAK1 inhibitor for 24h. (b) Intracellular staining of IL-9 protein in CD4+ T cells differentiated as described in a for 72h. (c) ELISA determination of IL-9 production in culture media of b. (d) mRNA expression of Il9 in wild-type naïve T cells transfected with TAK1-specific or control siRNA followed by the stimulation with anti-CD3+CD28 with or without TGF-β1 plus IL-4 for 24h. (e,f) Flow cytometry of intracellular IL-9 protein in naive CD4+ T cells from Tak1f/f-ERCre+ mice cultured with anti-CD3+CD28 in the absence or presence of 4-hydroxytamoxifen (4-OHT) for overnight to delete TAK1 expression, followed by stimulation with TGF-β1 plus IL-4 for additional 2.5 days. (e) Representative flow cytometry profile from one of three independent experiments; (f) Combined results of three individual experiments. (g) mRNA expression of Id3 in wild-type naive CD4+ T cells cultured with anti-CD3+CD28 and TGF-β1 plus IL-4 in the absence or presence of TAK1 inhibitor for 3-24h. Data are representative of two (d) three (a-c,e) and four (g) independent experiments or are pooled from three experiments (f). Error bars represent mean ± SD. *p<0.05, **p<0.01, ***p<0.001 (Student’s t-test).
Figure 4
Figure 4. E2A and GATA-3 are enriched at Il9 promoter region to promote IL-9 expression
(a), Il9 (left panel) and Tcfe2a (E2A) (right panel) mRNA expression in wild-type naive CD4+ T cells treated with E2A-specific or control siRNA, assessed after stimulation with anti-CD3+CD28 with or without TGF-β1 plus IL-4 for 24h and presented relative to Hprt expression. (b) Genomatix Matinspector analysis of E-protein binding sites (E-boxes) and GATA-3 binding site at the Il9 promoter. (c) ChIP-coupled quantitative PCR analysis of the enrichment of E2A at Il9 promoter region in naive CD4+ T cells isolated from Id3+/+ or Id3−/− mice and cultured for 24 h after stimulation with anti-CD3+CD28 with or without TGF-β1 plus IL-4 and presented relative to results obtained with control IgG, set as 1. (d,e) ChIP-coupled quantitative PCR analysis (d) and ChIP-sequencing analysis (e) of the enrichment of GATA-3 at Il9 promoter region in wild-type naive CD4+ T cells after stimulation with anti-CD3+CD28 with or without TGF-β1 plus IL-4 for 24h. (f) Luciferase assay of TGF-β1 and IL-4-induced Il9 activity (right) in naive CD4+ T cells with wild-type or E-boxes and/or GATA-3 binding site mutated Il9 constructs (left), assessed after stimulation with anti-CD3+CD28 with or without TGF-β1 plus IL-4 for 24h. Data are representative of two (c,d), three (a) and four (f) independent experiments. Error bars represent mean ± SD. * p<0.05, ***p<0.001 (Student’s t-test).
Figure 5
Figure 5. IL-9 production by Id3−/− CD4+ T cells is involved in anti-tumor immunity
(a) Tumor growth was monitored over time of Rag1−/− mice transferred intravenously with TCR plus TGF-β1-treated CD4+ CD25 T cells from Id3−/− or Id3+/+ mice simultaneously injected with B16 melanoma cells subcutaneously on day 0. The mice were treated with anti-IL-9 or isotype control antibodies every three days from day 0. (b) Representative tumors in each group harvested at the end of experiments as in a. (c) Intracellular staining of Foxp3, IFN-γ, IL-17, and IL-4 in intratumor CD4+ T cells as in a. Error bars represent mean ± SEM (n=4, Id3+/++ CtrlAb and Id3+/++α-IL-9; n=5, Id3−/−+ CtrlAb and Id3−/−+α-IL-9). *p<0.05, **p<0.01 (Student’s t-test). Data are representative of three independent experiments.
Figure 6
Figure 6. Id3 controls IL-9 production in human CD4+ T cells
(a) mRNA expression of Il9 in naïve CD4+CD25CD45RA+ cells isolated from human peripheral blood mononuclear cells after stimulation with anti-CD3+CD28 with various combination of TGF-β1, IL-4, TGF-β receptor inhibitor, anti-IL-4, or TAK1 inhibitor for 48h. (b) ELISA determination of IL-9 production in culture media of a. (c,d) mRNA expression of Id3 in human naïve CD4+ T cells after stimulation with anti-CD3+CD28 with or without TGF-β1 plus IL-4 in the absence (c) or presence (d) of TAK1 inhibitor for 48h. (e) mRNA expression of Il9 in human naïve CD4+ T cells transfected with Id3-specific or control siRNA followed by the stimulation with anti-CD3+CD28 with or without TGF-β1 plus IL-4 for 48h. mRNA expressions are relative to Gapdh expression. Data representative of two (d,b) or three (a,e) experiments or combined four separate experiments (c). Error bars represent mean ± SD. *p<0.05, **p<0.01 (Student’s t-test).

References

    1. Schmitt E, Germann T, Goedert S, Hoehn P, Huels C, Koelsch S, et al. IL-9 production of naive CD4+ T cells depends on IL-2, is synergistically enhanced by a combination of TGF-beta and IL-4, and is inhibited by IFN-gamma. J Immunol. 1994;153(9):3989–3996. - PubMed
    1. Veldhoen M, Uyttenhove C, van Snick J, Helmby H, Westendorf A, Buer J, et al. Transforming growth factor-beta ‘reprograms’ the differentiation of T helper 2 cells and promotes an interleukin 9-producing subset. Nature immunology. 2008;9(12):1341–1346. - PubMed
    1. Dardalhon V, Awasthi A, Kwon H, Galileos G, Gao W, Sobel RA, et al. IL-4 inhibits TGF-beta-induced Foxp3+ T cells and, together with TGF-beta, generates IL-9+ IL-10+ Foxp3(-) effector T cells. Nature immunology. 2008;9(12):1347–1355. - PMC - PubMed
    1. Nicolaides NC, Holroyd KJ, Ewart SL, Eleff SM, Kiser MB, Dragwa CR, et al. Interleukin 9: a candidate gene for asthma. Proceedings of the National Academy of Sciences of the United States of America. 1997;94(24):13175–13180. - PMC - PubMed
    1. Cheng G, Arima M, Honda K, Hirata H, Eda F, Yoshida N, et al. Anti-interleukin-9 antibody treatment inhibits airway inflammation and hyperreactivity in mouse asthma model. American journal of respiratory and critical care medicine. 2002;166(3):409–416. - PubMed

Publication types