. 2015;6(5):310-20.
doi: 10.1080/19490976.2015.1086056.

Pregnancy-related changes in the maternal gut microbiota are dependent upon the mother's periconceptional diet

Affiliations

Pregnancy-related changes in the maternal gut microbiota are dependent upon the mother's periconceptional diet

Wajiha Gohir et al. Gut Microbes. 2015.

Abstract

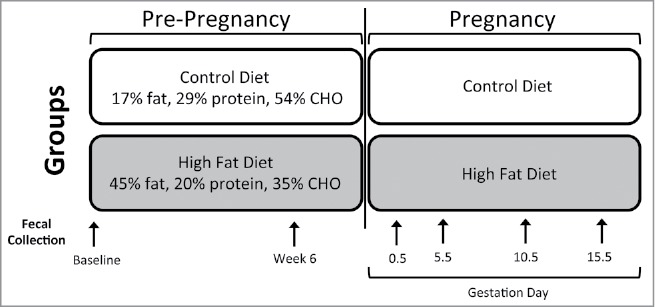
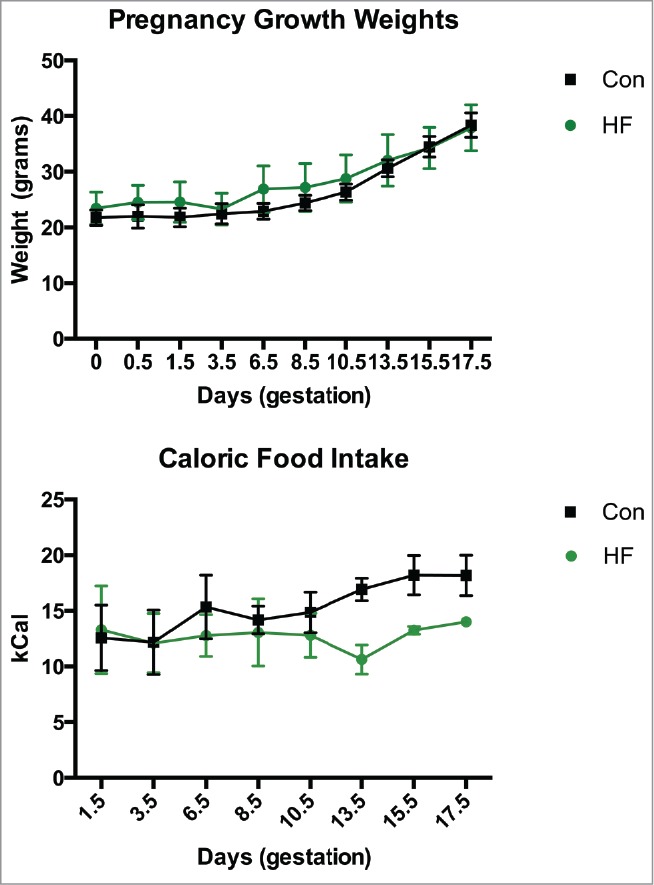
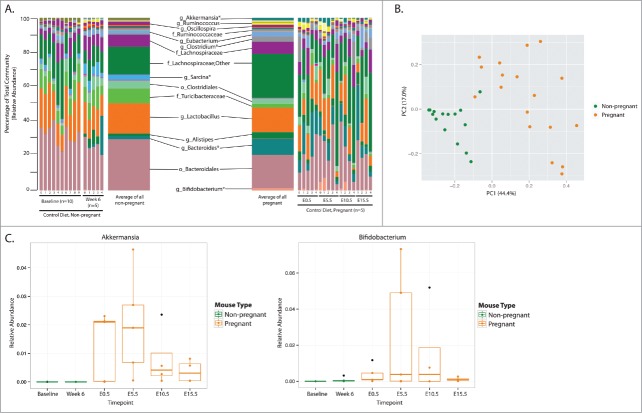
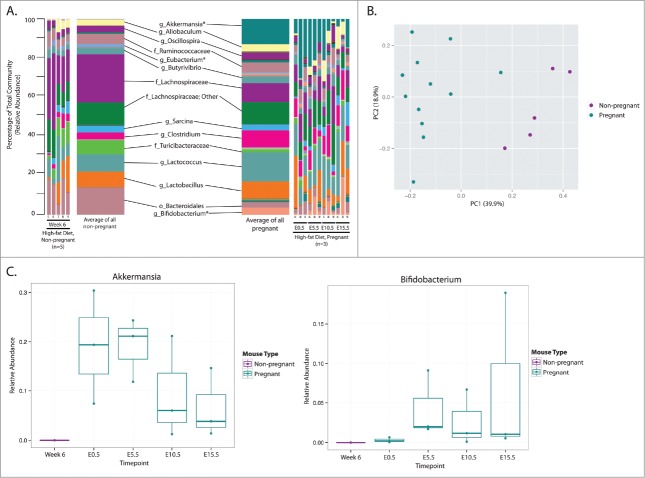
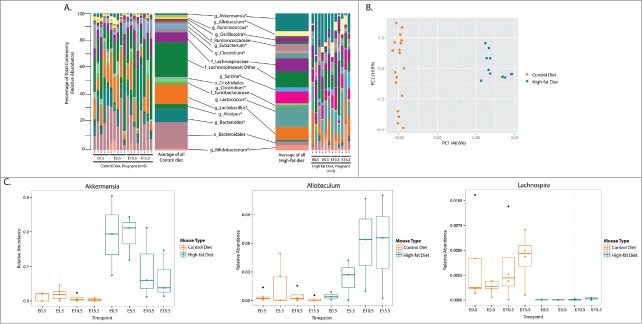
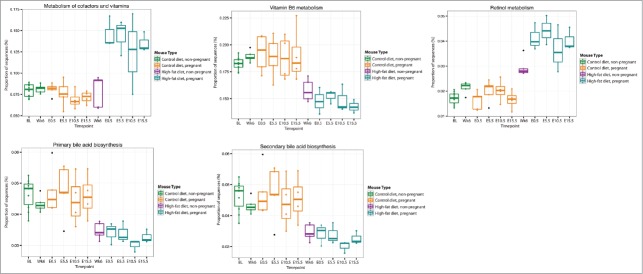
Shifts in the maternal gut microbiome have been implicated in metabolic adaptations to pregnancy. We investigated how pregnancy and diet interact to influence the composition of the maternal gut microbiota. Female C57BL/6 mice were fed either a control or a high fat diet for 8 weeks prior to mating. After confirmation of pregnancy, maternal weight gain and food intake were recorded. Fecal pellets were collected at 2 timepoints prior to mating (at the beginning of the experiment, and after 6 weeks of the specified diet) and at 4 timepoints during pregnancy (gestation day 0.5, 5.5, 10.5, and 15.5). The microbial composition and predicted metabolic functionality of the non-pregnant and pregnant gut was determined via sequencing of the variable 3 region of the 16S rRNA gene. Upon conception, differences in gut microbial communities were observed in both control and high fat-fed mice, including an increase in mucin-degrading bacteria. Control versus high fat-fed pregnant mice possessed the most profound changes to their maternal gut microbiota as indicated by statistically significant taxonomic differences. High fat-fed pregnant mice, when compared to control-fed animals, were found to be significantly enriched in microbes involved in metabolic pathways favoring fatty acid, ketone, vitamin, and bile synthesis. We show that pregnancy-induced changes in the female gut microbiota occur immediately at the onset of pregnancy, are vulnerable to modulation by diet, but are not dependent upon increases in maternal weight gain during pregnancy. High fat diet intake before and during pregnancy results in distinctive shifts in the pregnant gut microbiota in a gestational-age dependent manner and these shifts predict significant differences in the abundance of genes that favor lipid metabolism, glycolysis and gluconeogenic metabolic pathways over the course of pregnancy.

Keywords: gut; high fat diet; intestine; microbiome; obesity; pregnancy.


Figures

Figure 1.
Figure 1.
Schematic of mouse model. Schematic representation of the experimental design. Six-week-old female C57BL/6J mice (n = 10) were randomly assigned to one of 2 nutritional groups: 1) Control diet (Con; n = 5 17% fat, 29% protein, 54% CHO, 3 kcal/g) or 2) high fat diet (HF; n = 5; 45% fat, 20% protein, 35% CHO, 4.73 kcal/g), fed for 8 weeks and then mated with viable males. Pregnancy was identified when a vaginal plug was visible and designated as gestational day (E) 0.5 in both control (n = 5) and high fat (n = 3) groups. Fecal samples were collected from control mice prior to nutritional randomization (Baseline), after 6 weeks of either control or high fat diet feeding (Week 6) and then at timepoints during pregnancy (0.5, 5.5, 10.5 and 15.5; n = 5 control, n = 3 high fat fed).
Figure 2.
Figure 2.
Maternal weight gain and caloric intake. Maternal weight gain over the course of pregnancy and caloric intake (expressed as calories consumed / gram body weight) in mothers during pregnancy. Data are mean ± SEM; n = 5 in control group, n = 3 in the HF group. Con = control diet, HF = high fat diet.
Figure 3.
Figure 3.
Pregnancy alters the maternal gut microbial community of Control-fed mice. Mice fed a control diet were sampled twice during an 8-week period prior to impregnation (Baseline (BL), Week 6 (Wk6)), at 0.5 days of pregnancy (E0.5) and then every 5 days during pregnancy (E5.5, E10.5, E15.5). (A) Taxonomic summaries of microbial relative abundance for each mouse sampled at each timepoint are displayed; the microbial communities of non-pregnant and pregnant mice are summarized and taxonomic classifications, resolved to the order (o), family (f), or genus (g) level, are displayed and those with relative abundance > 1.0% are labeled. Asterisks identify genera that were significantly different between non-pregnant and pregnant mice; additional low abundance genera identified as significantly different are listed in Additional File 2. Further, an average taxonomic summary of each group displays the mean relative abundance of each genus. (B) A Principal Coordinates Analysis (PcoA) using the Bray Curtis distance metric displays separation of non-pregnant and pregnant animals (PERMANOVA, P = 0.001). (C) The relative abundance of the genera with the largest change in relative abundance between non-pregnant and pregnant animals are displayed. The x-axis indicates the sampling timepoints and samples are colored by pregnancy information. All other significant genera are displayed in Figure S1.
Figure 4.
Figure 4.
The maternal gut microbiota of animals fed a High fat diet is altered upon pregnancy. High fat-fed mice were sampled following 6 weeks of high fat feeding (Wk 6) prior to impregnation at 0.5 days of pregnancy (E0.5) and then every 5 days during pregnancy (E5.5, E10.5, E15.5). (A) Taxonomic summaries of microbial relative abundance for each mouse sampled at each timepoint are displayed; the microbial communities of non-pregnant and pregnant mice are summarized and taxonomic classifications, resolved to the order (o), family (f), or genus (g) level, are displayed and all genera present at a relative abundance of >1.0% are labeled. Asterisks identify genera that were significantly different between non-pregnant and pregnant mice on this diet; significantly different low abundance genera are listed in Additional File 4. Also, the mean relative abundance of each genus per group is displayed as an average taxonomic summary. (B) A Principal Coordinates Analysis (PcoA) using the Bray Curtis distance metric displays separation of non-pregnant and pregnant animals (PERMANOVA, P = 0.001). (C) The relative abundances of 2 genera identified as significantly different between non-pregnant and pregnant HF-fed animals are visualized. The x-axis indicates the sampling timepoints and samples are colored by pregnancy information. All other significant genera are displayed in Figure S2.
Figure 5.
Figure 5.
The maternal gut microbiota during pregnancy is dependent on maternal diet. Pregnant mice in the Con and HF groups are compared to each other. (A) Taxonomic summaries of microbial relative abundance reveal more significant differences in taxa then in any other comparisons made. Each mouse sampled at each timepoint are displayed; the microbial communities of Con and HF pregnant mice are summarized and taxonomic classifications, resolved to the order (o), family (f), or genus (g) level, are displayed and all genera present at a relative abundance of >1.0% are labeled. Asterisks identify genera that were significantly different between Con and HF pregnant mice on this diet; significantly different low abundance genera are listed in Additional File 6. Further, an average taxonomic summary displays the mean relative abundance of each genus per grouping. (B) A Principal Coordinates Analysis (PcoA) using the Bray Curtis distance metric displays distinct separation of pregnant animals on differing diets, and distinct clustering of mice from each diet type (PERMANOVA, P = 0.001). (C) The relative abundances of 3 genera identified as significantly different between Con-fed and HF-fed pregnant animals are visualized. The x-axis indicates the sampling timepoints and samples are colored by pregnancy information. All other significant genera are displayed in Figure S3.
Figure 6.
Figure 6.
Maternal diet- and pregnancy-induced changes in the abundance of microbe containing genes predicted to regulate metabolic pathways related to fuel metabolism. Mice fed a control diet were sampled twice during an 8 week period prior to impregnation (BL, Wk6), at 0.5 days of pregnancy (E0.5) and then every 5 days during pregnancy (E5.5, E10.5, E15.5). HF fed mice were sampled following 6 weeks of high fat feeding (Wk 6) prior to impregnation, and at 0.5 days of pregnancy (E0.5) and then every 5 days during pregnancy (E5.5, E10.5, E15.5). Here, estimations of changes in metabolic pathways between Con pregnant and HF pregnant groups were calculated using Phylogenetic Investigation of Communities by Reconstruction of Unobserved States (PICRUSt) and the proportion of genes predicted to be present for significantly different pathways of interest are visualized. The corresponding abundances for non-pregnant groups are show for the sake of comparison. The x-axis indicates the sampling timepoints and samples are colored by diet and pregnancy information. All other significant pathways are listed in Table S4.
Figure 7.
Figure 7.
Maternal diet- and pregnancy-induced changes in the abundance of microbe containing genes predicted to regulate metabolic pathways related to vitamin and bile acid metabolism. Mice fed a control diet were sampled twice during an 8 week period prior to impregnation (BL, Wk6), at 0.5 days of pregnancy (E0.5) and then every 5 days during pregnancy (E5.5, E10.5, E15.5). HF fed mice were sampled following 6 weeks of high fat feeding (Wk 6) prior to impregnation, and at 0.5 days of pregnancy (E0.5) and then every 5 days during pregnancy (E5.5, E10.5, E15.5). Here, estimations of changes in metabolic pathways between Con pregnant and HF pregnant groups were calculated using Phylogenetic Investigation of Communities by Reconstruction of Unobserved States (PICRUSt) and the proportion of genes predicted to be present for significantly different pathways of interest are visualized. The corresponding abundances for non-pregnant groups are show for the sake of comparison. The x-axis indicates the sampling timepoints and samples are colored by diet and pregnancy information. All other significant pathways are listed in Table S4.

References

    1. Organization WH Obesity 2013.
    1. Gluckman PD, Hanson MA. Developmental plasticity and human disease: research directions. J Intern Med 2007; 261:461-71; PMID:17444885; http://dx.doi.org/ 10.1111/j.1365-2796.2007.01802.x - DOI - PubMed
    1. Kristensen J, Vestergaard M, Wisborg K, Kesmodel U, Secher NJ. Pre-pregnancy weight and the risk of stillbirth and neonatal death. BJOG 2005; 112:403-8; PMID:15777435; http://dx.doi.org/ 10.1111/j.1471-0528.2005.00437.x - DOI - PubMed
    1. Patro B, Liber A, Zalewski B, Poston L, Szajewska H, Koletzko B. Maternal and paternal body mass index and offspring obesity: a systematic review. Ann Nutr Metab 2013; 63:32-41; PMID:23887153; http://dx.doi.org/ 10.1159/000350313 - DOI - PubMed
    1. Poston L. Maternal obesity, gestational weight gain and diet as determinants of offspring long term health. Best Pract Res Clin Endocrinol Metab 2012; 26:627-39; PMID:22980045; http://dx.doi.org/ 10.1016/j.beem.2012.03.010 - DOI - PubMed

Publication types

LinkOut - more resources